文章目录
- 一、简介
- 二、安装
- 三、示例
- 四、所有参数说明
一、简介
雷达图(Radar Chart)又称蛛网图(Spider Chart)是一种常见的多维数据可视化手段,能够直观地对比多个指标并揭示其整体分布特征。
雷达图以中心点为原点,依次向外延伸出 n n n 条放射状轴,每条轴对应一个维度指标。若有数据点 x 1 , x 2 , … , x n {x_1, x_2, \dots, x_n} x1,x2,…,xn,则在第 i i i 条轴上,按量值 x i x_i xi 的大小标定距离,将各点连线后即得到一个封闭的多边形——类似雷达扫描回波或昆虫蛛网的形态。
- 轴的均匀分布:第 i i i 条轴相对于水平线的角度可设为
θ i = 2 π ( i − 1 ) n , i = 1 , 2 , … , n . \theta_i = \frac{2\pi (i-1)}{n},\quad i=1,2,\dots,n. θi=n2π(i−1),i=1,2,…,n. - 数据标度:各轴通常需先将原始值归一化为 [ 0 , 1 ] [0,1] [0,1] 区间(这个也不是一定的,不同的轴也可以使用不同的量纲,不过需要标注一下),记归一化后数据为 x ~ i \tilde x_i x~i,再映射到同一半径范围。
二、安装
这个用极坐标就可以画,但是要得到一个功能强大、样式丰富的图,比较麻烦,直接用其他人开发的工具箱吧。
去附加功能管理器搜索radar(清空过滤条件),即可看到这个:不是Radar Toolbox,那个是真的雷达工具箱。

也可以去File Exchange下载:不过截至现在,mathworks的这个网页还没修复,下不了(都一个多星期了还没搞好😅)。
这个不是App,只是个工具箱,即几份代码文件,下载后默认保存在你的C盘某个位置,默认会添加到路径。

这个文件夹你可以直接复制到别的地方,或者分享给他人。
三、示例
生成一个示例数据:5行,10列,即5个样本,每个10个指标(比如5个城市的10个指标)。
% 生成 5×10 的随机示例数据(0–10 之间)
rng(1);
data_matrix = rand(5,10) * 10;
画图:
spider_plot(data_matrix);
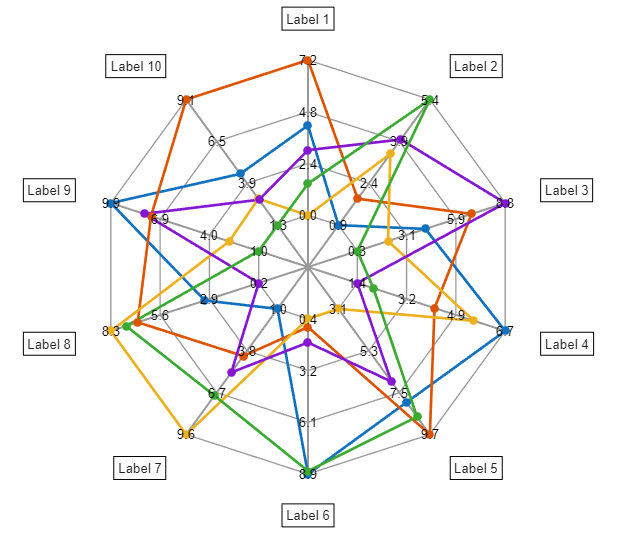
这就是默认的绘图风格。
图中所有的内容都可以自定义:数据标注、标签、数据线型、射线、网状线(web)等内容都可以设置。
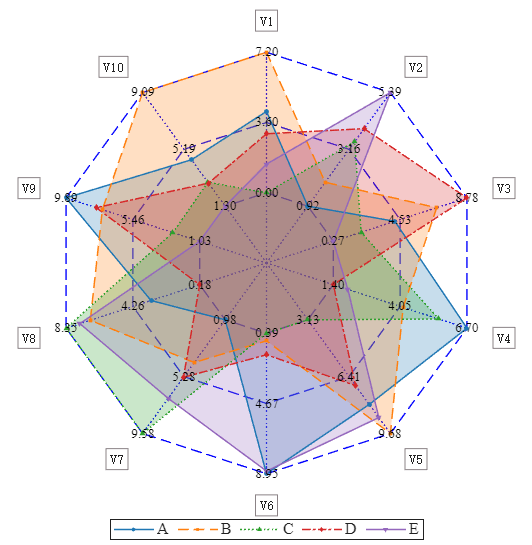
下面做一个复杂一点的示例:完整参数见文末。
close all
clear
clc%% —— 示例数据生成 ——
% 生成 5×10 的随机示例数据(0–10 之间)
rng(1);
data_matrix = rand(5,10) * 10;%% —— 雷达图绘制 —— % 英文标签
labels = {'V1','V2','V3','V4','V5','V6','V7','V8','V9','V10'};% 配色:五种清晰可区分的颜色
colors = ["#1f77b4", "#ff7f0e", "#2ca02c", "#d62728", "#9467bd"];rgb_color = zeros(length(colors), 3);
for i = 1:length(colors)rgb_color(i,:) = sscanf(colors(i), '#%2x%2x%2x', [1 3]) / 255;
endline_styles = {'-','--',':','-.','-'};
markers     = {'o','s','^','d','v'};
legend_str  = {'A','B','C','D','E'}';% 新建 figure 并设置字体、大小
f = figure('Color','white','Units','inches','Position',[3 3 8 7]);
set(f, ...'DefaultAxesFontName','Times New Roman', ...'DefaultTextFontName','Times New Roman', ...'DefaultAxesFontSize',12, ...'DefaultTextFontSize',12);% 调用 spider_plot
h_spider = spider_plot(data_matrix, ...'AxesLabels',        labels, ...'AxesDisplay',       'all', ...'FillOption',        'on', ...'FillTransparency',  0.25, ...'Color',             rgb_color, ...'LineStyle',         line_styles, ...'Marker',            markers, ...'MarkerSize',        10, ...'LineWidth',         1.1, ...'AxesRadial',        'on', ...'AxesLabelsRotate',  'off', ...'AxesInterval',      2, ...'AxesPrecision',     2, ...'AxesLabelsOffset',  0.15, ...'AxesColor',         'b', ...'AxesFont',          'Times New Roman', ...'LabelFont',         'simsun', ...'BackgroundColor',   'w', ...'AxesRadialLineStyle',':', ...'AxesRadialLineWidth',1, ...'AxesLabelsEdge',    '#8B8386', ...'AxesWebLineStyle',  '--', ...'AxesFontColor',     'k');% 添加图例
legend(legend_str, ...'Location','south', ...'Orientation','horizontal', ...'FontSize',12, ...'FontName','Times New Roman', ...'Position',[0.3750 0.1106 0.2865 0.0214]);% 保存高分辨率图片
% exportgraphics(gcf, 'radar_plot.png', 'Resolution', 600);
四、所有参数说明
| Argument Name | Description | Default Value | Possible Values |
|---|---|---|---|
AxesLabels | 指定每个轴的标签。 | auto-generated | auto-generated , cell array of strings, 'none' |
AxesInterval | 更改 web 之间显示的间隔数。 | 3 | integer |
AxesPrecision | 更改轴上显示值的精度级别。 | 1 | integer, vector |
AxesDisplay | 更改显示轴文本的轴数。 | 'all' | 'all', 'none', 'one', 'data', 'data-percent' |
AxesLimits | 手动设置轴限制。 | auto-scaled | matrix (2 x size(P, 2)), auto-scaled |
FillOption | 切换填充颜色选项。 | 'off' | 'off', 'on', cell array of character vectors |
FillTransparency | 设置填充颜色透明度。 | 0.1 | scalar in range (0, 1), vector |
Color | 指定线条颜色,以 RGB 三元组形式指定。 | MATLAB colors | RGB triplet |
LineStyle | 更改绘图的线条样式。 | '-' | '-', '--', ':', '-.', 'none', cell array of character vectors |
LineWidth | 更改线宽,其中 1 point 为 1/72 英寸。 | 0.5 | positive value, vector |
LineTransparency | 设置线条颜色透明度。 | 1 | scalar in range (0, 1), vector |
Marker | 更改绘图的标记符号。 | 'o' | 'o', '*', 's', 'd', '+', '.', 'x', '^', 'v', 'h', 'none', cell array of character vectors |
MarkerSize | 更改标记大小,其中 1 point 为 1/72 英寸。 | 36 | positive value, vector |
MarkerTransparency | 设置标记颜色透明度。 | 1 | scalar in range (0, 1), vector |
AxesFont | 更改轴上显示的值的字体类型。 | 'Helvetica' | supported font name |
LabelFont | 更改标签的字体类型。 | 'Helvetica' | supported font name |
AxesFontSize | 更改轴上显示的值的字体大小。 | 10 | scalar value greater than zero |
AxesFontColor | 更改轴上显示的值的字体颜色。 | 'black' | RGB triplet |
LabelFontSize | 更改标签的字体大小。 | 10 | scalar value greater than zero |
Direction | 更改绘制的数据和轴标签的旋转方向。 | 'clockwise' | 'clockwise', 'counterclockwise' |
AxesDirection | 更改轴的方向。 | 'normal' | 'normal', 'reverse', cell array of character vectors |
AxesLabelsOffset | 调整轴标签的位置偏移。 | 0.2 | positive value |
AxesDataOffset | 当 AxesDisplay 设置为 'data' 时,调整数据标签的位置偏移。 | 0.1 | positive value |
AxesScaling | 更改轴的缩放。 | 'linear' | 'linear', 'log', cell array of character vectors |
AxesColor | 更改 spider 轴的颜色。 | 'grey' | RGB triplet, hexadecimal color code |
AxesLabelsEdge | 更改轴标签的边缘颜色。 | 'black' | RGB triplet, hexadecimal color code, 'none' |
AxesOffset | 更改轴与原点的偏移。 | 1 | any integer less than the axes interval |
AxesZoom | 更改轴的缩放。 | 0.7 | scalar in range (0, 1) |
AxesHorzAlign | 更改轴刻度标签的水平对齐方式。 | 'center' | 'center', 'left', 'right', 'quadrant' |
AxesVertAlign | 更改轴刻度标签的垂直对齐方式。 | 'middle' | 'middle', 'top', 'cap', 'bottom', 'baseline', 'quadrant' |
PlotVisible | 更改绘制的线条和标记的可见性。 | 'on' | 'on', 'off' |
AxesTickLabels | 更改轴刻度标签。 | 'data' | cell array of character vectors |
AxesInterpreter | 更改轴标签和轴刻度标签的文本解释器。 | 'tex' | 'tex', 'latex', 'none', cell array of character vectors |
BackgroundColor | 更改背景颜色。 | 'white' | RGB triplet, hexadecimal color code, 'r', 'g', 'b', … |
MinorGrid | 切换次要网格。 | 'off' | 'off', 'on' |
MinorGridInterval | 更改主要网格线之间的次要网格线数量。 | 2 | integer value greater than zero |
AxesZero | 在值零处添加参考轴。 | 'off' | 'off', 'on' |
AxesZeroColor | 更改零参考轴的颜色。 | 'black' | RGB triplet, hexadecimal color code, 'r', 'g', 'b', … |
AxesZeroWidth | 更改零参考轴的线宽。 | 2 | positive value |
AxesRadial | 切换径向轴。 | 'on' | 'on', 'off' |
AxesWeb | 切换 web 轴。 | 'on' | 'on', 'off' |
AxesShaded | 切换轴周围的阴影区域。 | 'off' | 'off', 'on' |
AxesShadedLimits | 设置阴影区域的限制。 | AxesLimits | cell array (matrix of 2 x size(P, 2)) |
AxesShadedColor | 更改阴影区域的颜色。 | 'green' | RGB triplet, hexadecimal color code, 'r', 'g', 'b', cell array |
AxesShadedTransparency | 设置阴影区域透明度。 | 0.2 | vector in range (0, 1) |
AxesLabelsRotate | 旋转轴标签以与轴对齐。 | 'off' | 'off', 'on' |
AxesHandle | 指定要在其中绘图的轴。 | new axes | Axes object |
ErrorBars | 使用 +/- 标准差端点切换误差条模式。 | 'off' | 'off', 'on' |
AxesWebType | 设置绘制的 web 类型。 | 'web' | 'web', 'circular' |
AxesTickFormat | 格式化轴刻度文本。 覆盖 AxesPrecision 值。 | '%.2f' | cell array of character vectors |
FillCData | 当填充选项设置为 'interp' 时,设置填充颜色。 | empty | vector |
ErrorPositive | 当 'ErrorBars' 设置为 'on' 时,设置正方向的误差条长度。 | empty | vector |
ErrorNegative | 当 'ErrorBars' 设置为 'on' 时,设置负方向的误差条长度。 | empty | vector |
AxesStart | 设置轴的初始起点。 指定一个介于 [0, 2pi] 之间的值。 | pi/2 | scalar |
AxesRadialLineWidth | 设置径向轴的线宽。 | 1.5 | scalar |
AxesRadialLineStyle | 设置径向轴的线条样式。 | '-' | '-', '--', ':', '-.', 'none', cell array of character vectors |
AxesWebLineWidth | 设置轴 web 的线宽。 | 1 | scalar |
AxesWebLineStyle | 设置轴 web 的线条样式。 | '-' | '-', '--', ':', '-.', 'none', cell array of character vectors |
LegendLabels | 添加图例标签。 (仅 spider_plot_class 属性) | N/A (类属性) | cell array of character vectors |
LegendHandle | 自定义图例设置。 (仅 spider_plot_class 属性) | N/A (类属性) | legend handle object |
TiledLayoutHandle | 自定义分块布局设置。 (仅 spider_plot_class 属性) | N/A (类属性) | tiled chart layout handle object |
TiledLegendHandle | 自定义分块图例设置。 (仅 spider_plot_class 属性) | N/A (类属性) | legend handle object of tiled layout |
NextTileIter | 使用连续分块图进行迭代。 (仅 spider_plot_class 属性) | 1 | N/A |
Notes:
- “N/A” 在
Default Value列中表示该属性仅适用于spider_plot_class,而不是作为 Name-Value Pair 参数直接传递给函数。 RGB triplet指的是 [R, G, B] 的一个数组,其中 R, G, B 分别代表红色,绿色,蓝色的强度,取值范围为 [0, 1]。hexadecimal color code指的是以#开头的十六进制颜色码,例如#FF0000代表红色。
)
创建型模式)


)


——进程(概念篇))

)

)


