目录
一.网络设备监控
1、GNS模拟器的使用
创建路由
创建交换机
2.构建网络
3.添加Cisco路由器的监控
二.中间件监控
1、MySQL数据库监控
1.1、拷贝自定义的监控脚本到指定目录
1.2、添加监控用户
1.3、重启zabbix-agent服务
1.4、在zabbix-server服务端测试数据
1.5、在UI界面添加监控模版
2、Redis数据库监控
下载agent2
修改配置
3、Nginx服务监控
修改Nginx配置文件
重启Nginx生效配置
验证状态页是否正常
配置Zabbix Agent
4、MySQL主从监控
配置主从配置
主库配置(192.168.71.192)
从库配置(192.168.71.193)
在被监控端创建监控脚本
配置Zabbix Agent2
5、Redis集群监控
一.网络设备监控
1、GNS模拟器的使用
创建路由
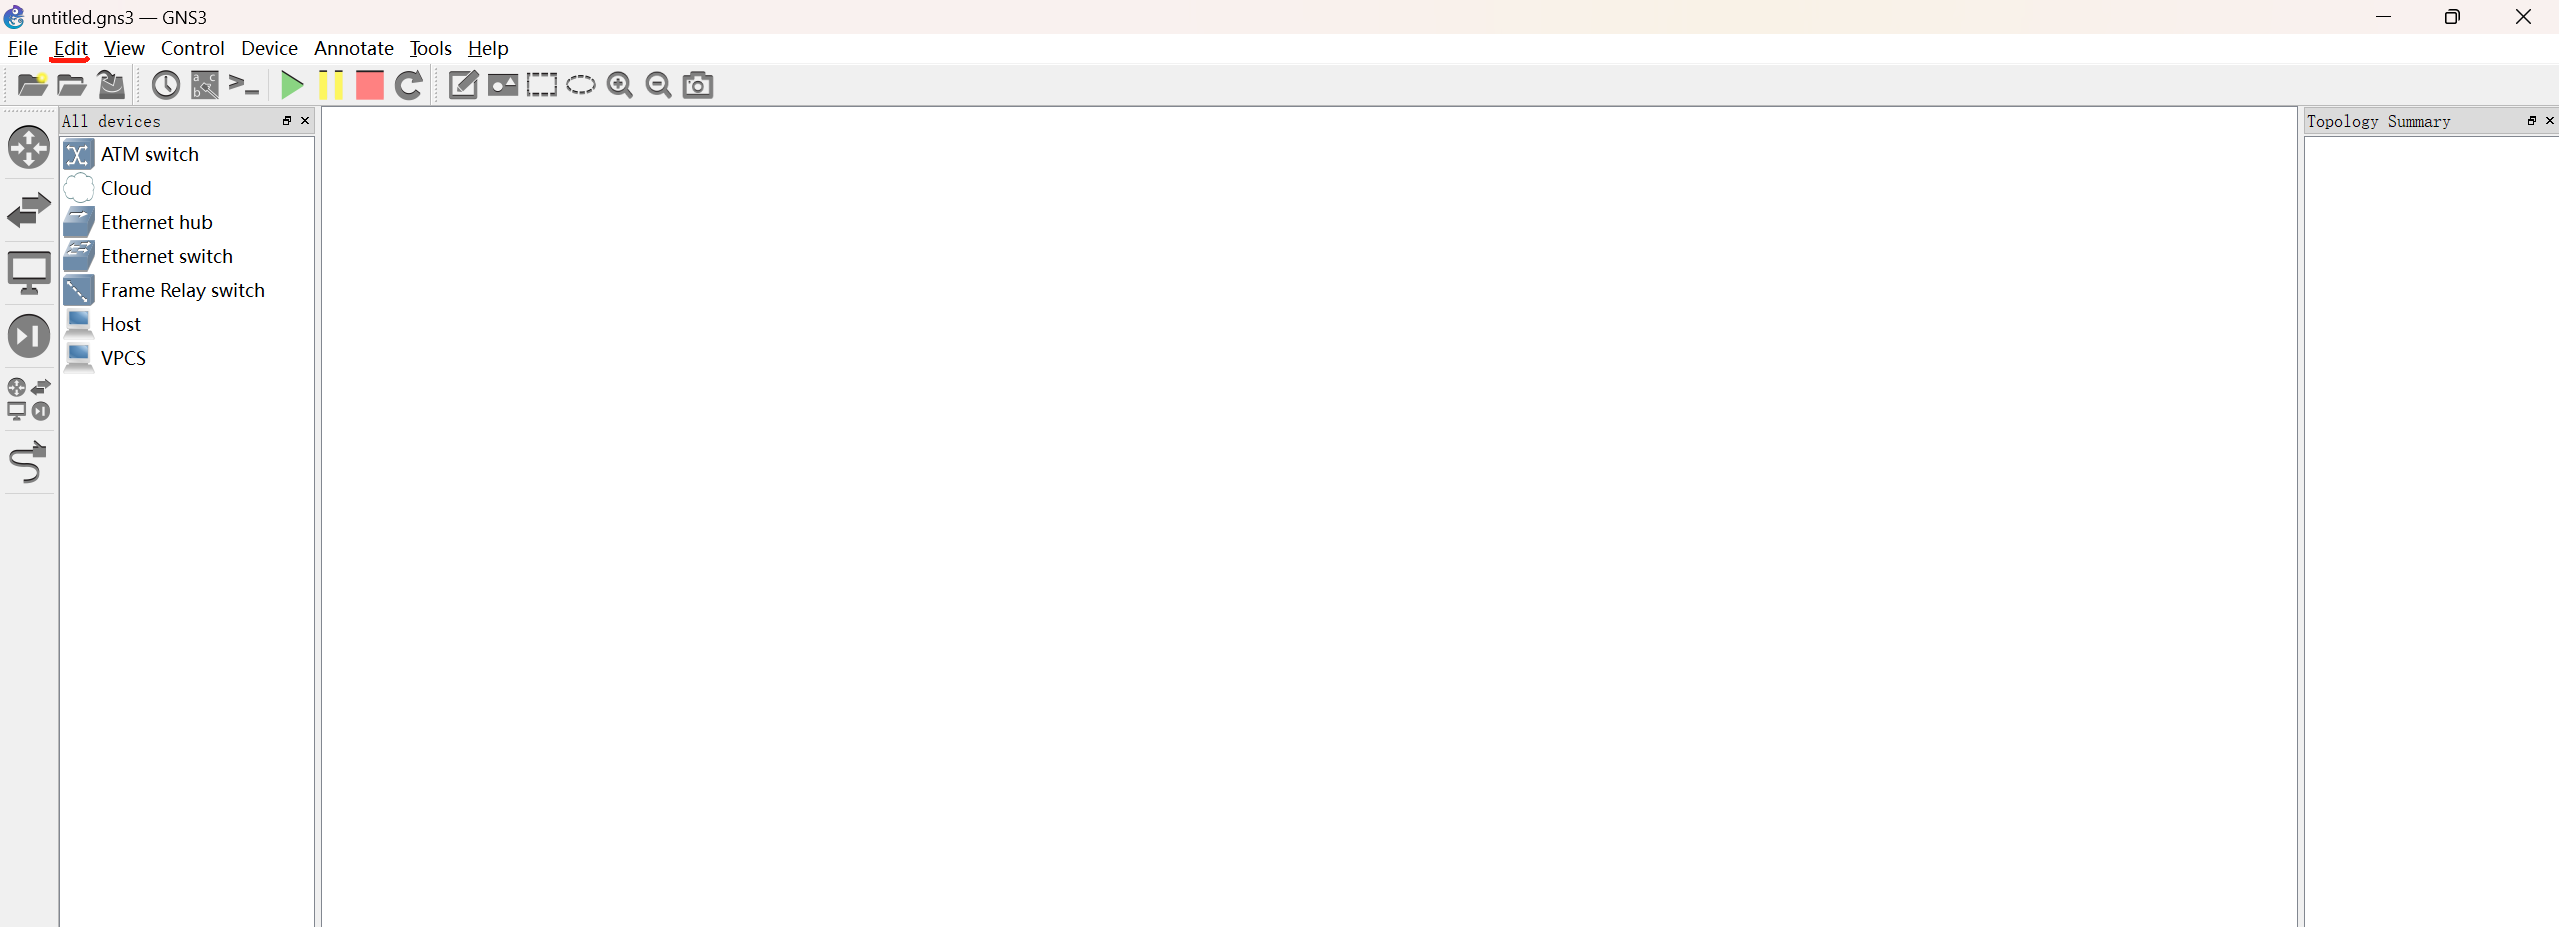
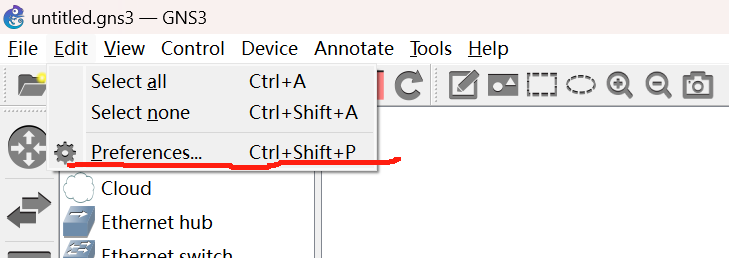
下载安装好GNS后,最开始是没有路由设备的,需要自己创建,先点击Edit里的Preferences
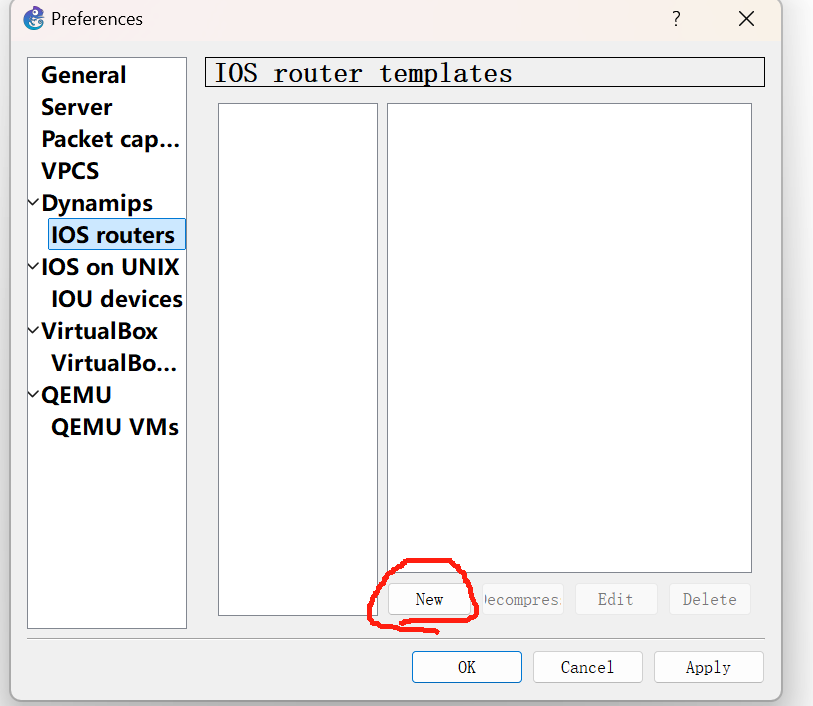
进去之后点击IOS routers下的new创建新路由
选择之前安装包所在文件夹里的C3640 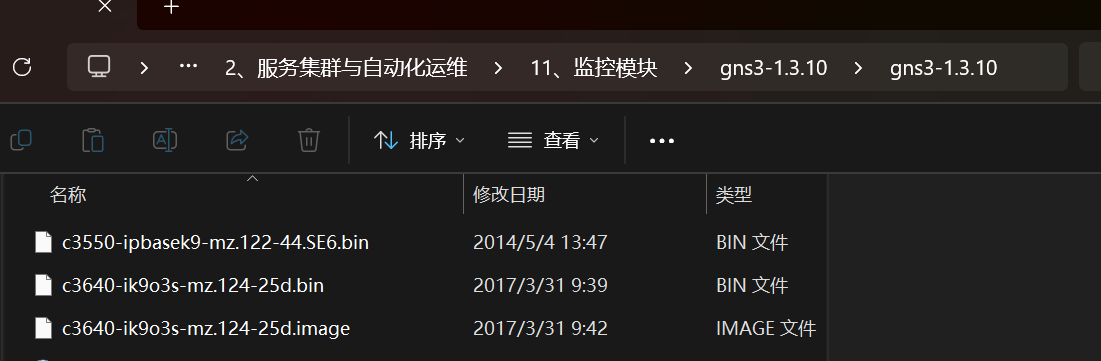
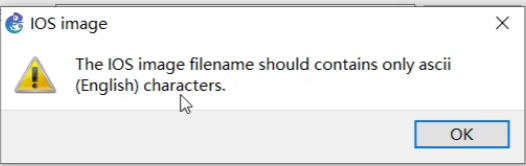
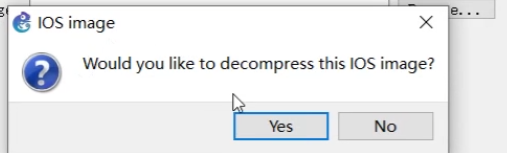
点击选择后出现提示不是英文要转换一下,点ok和yes即可
一直点下一步即可完成创建路由器
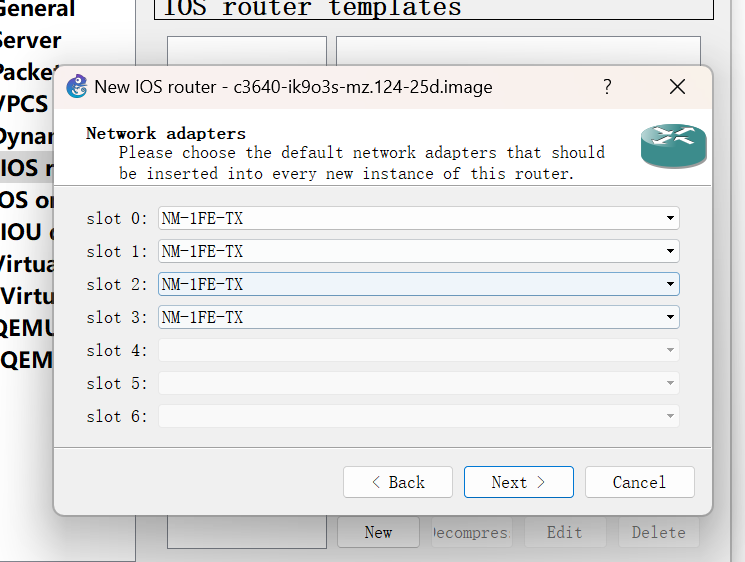
完成后发现完成创建
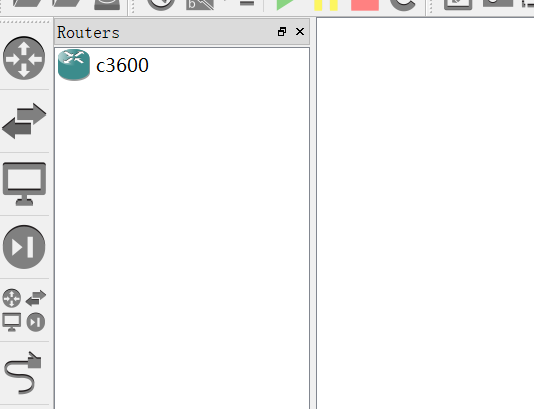
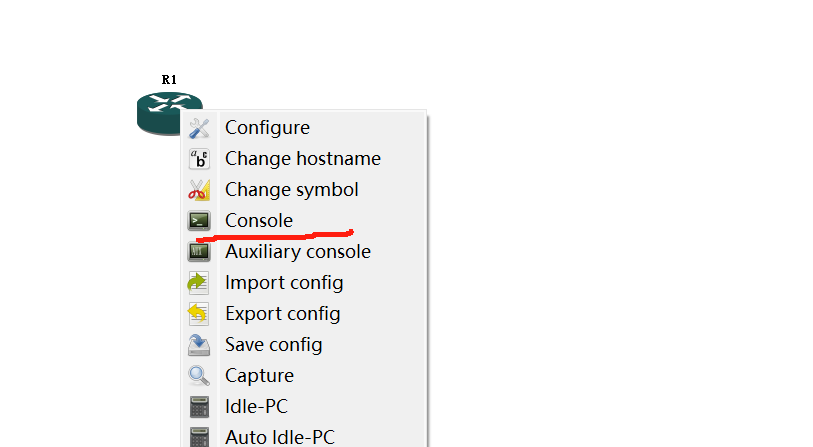
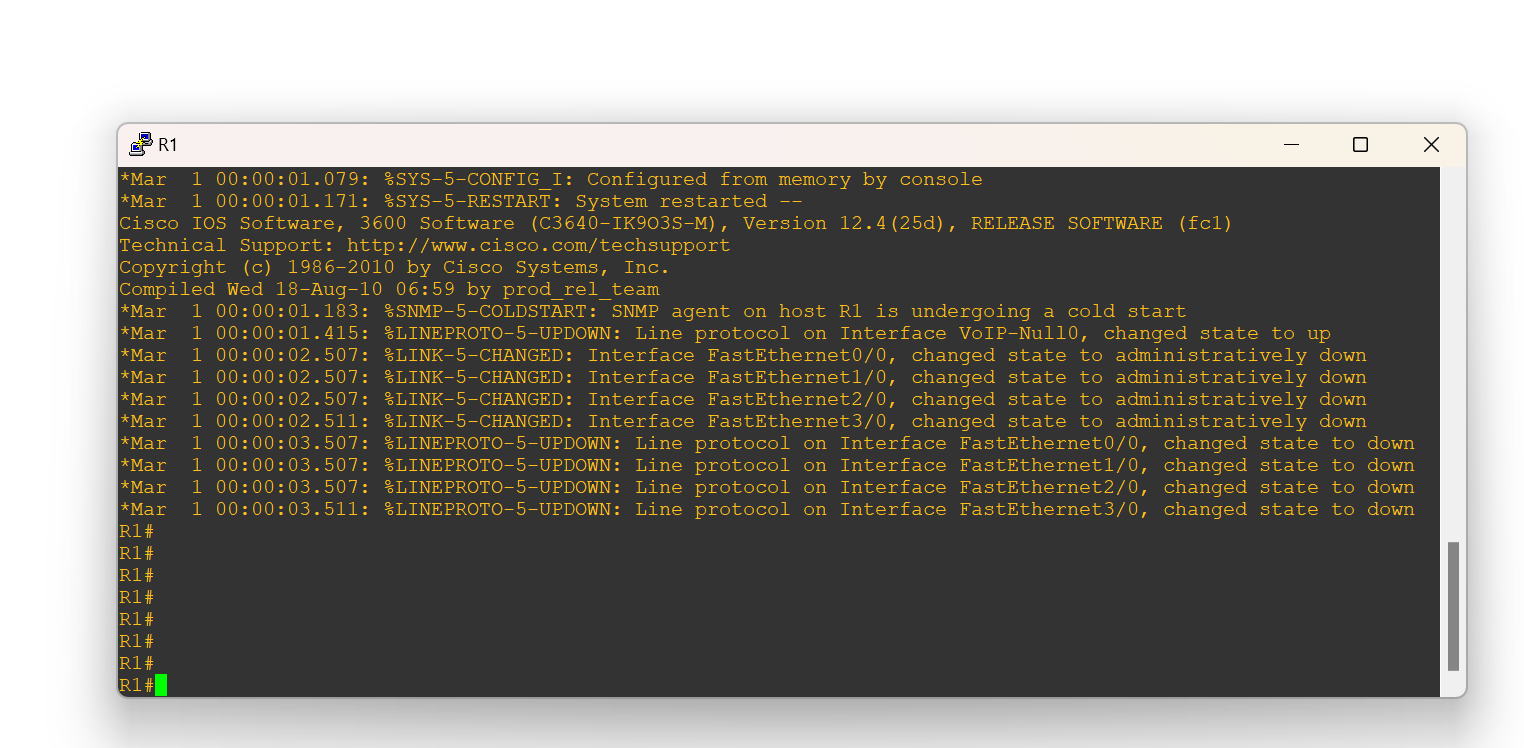
点击C3600后点击打开,再右键点击console,等待开机并回车确认
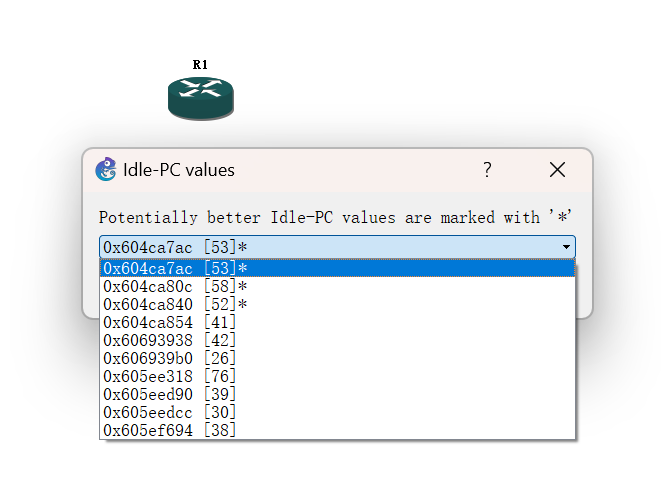
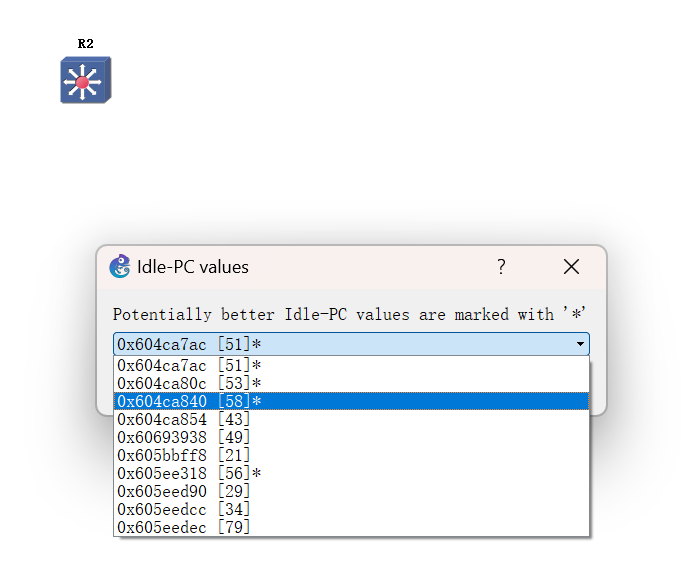
再点击idle-PC
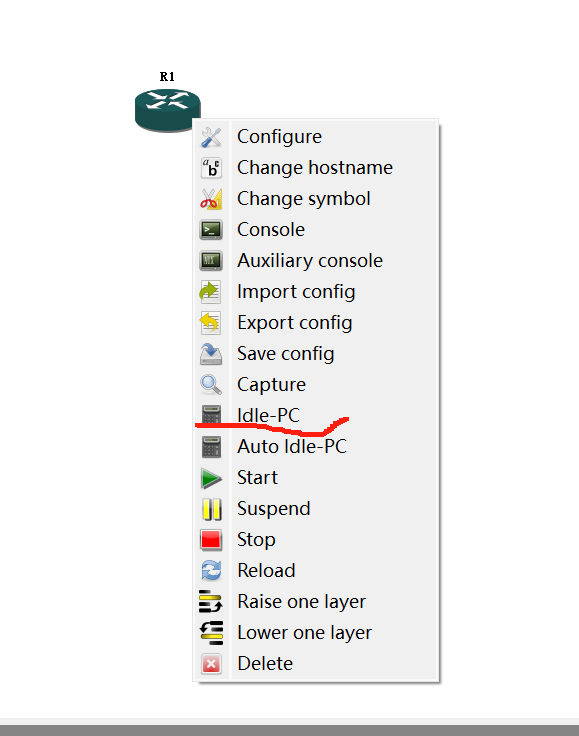
一定选择带星号的,并且最大的,图下则选择58*
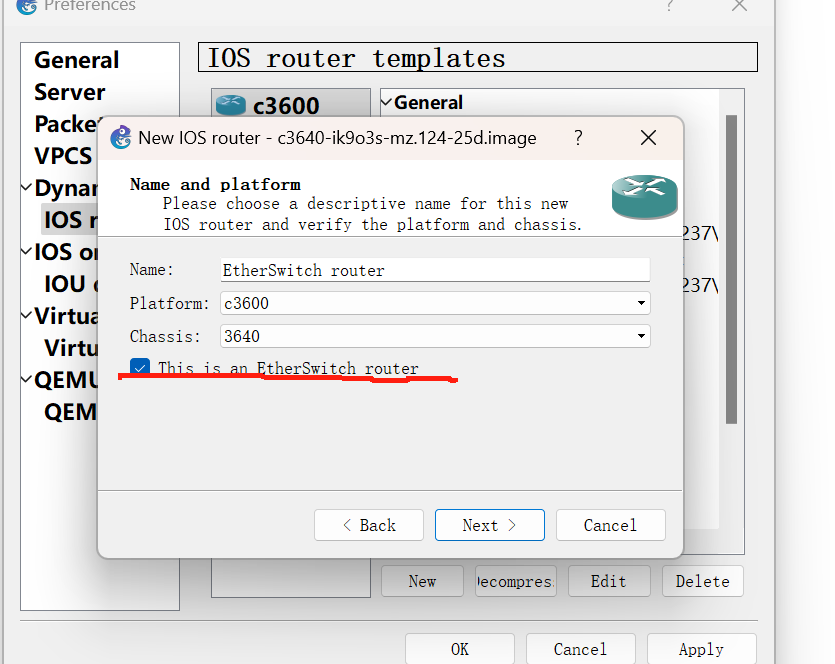
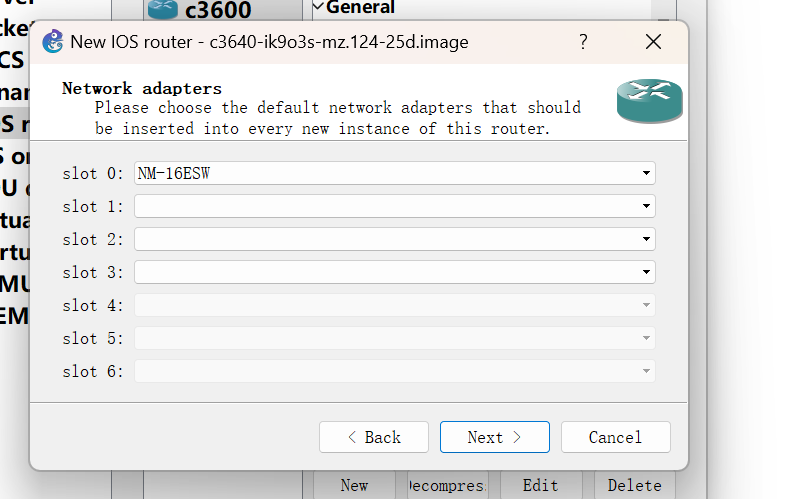
创建交换机
再添加一个交换机,步骤与路由相同,唯二不同则是在以下界面打勾,和接口
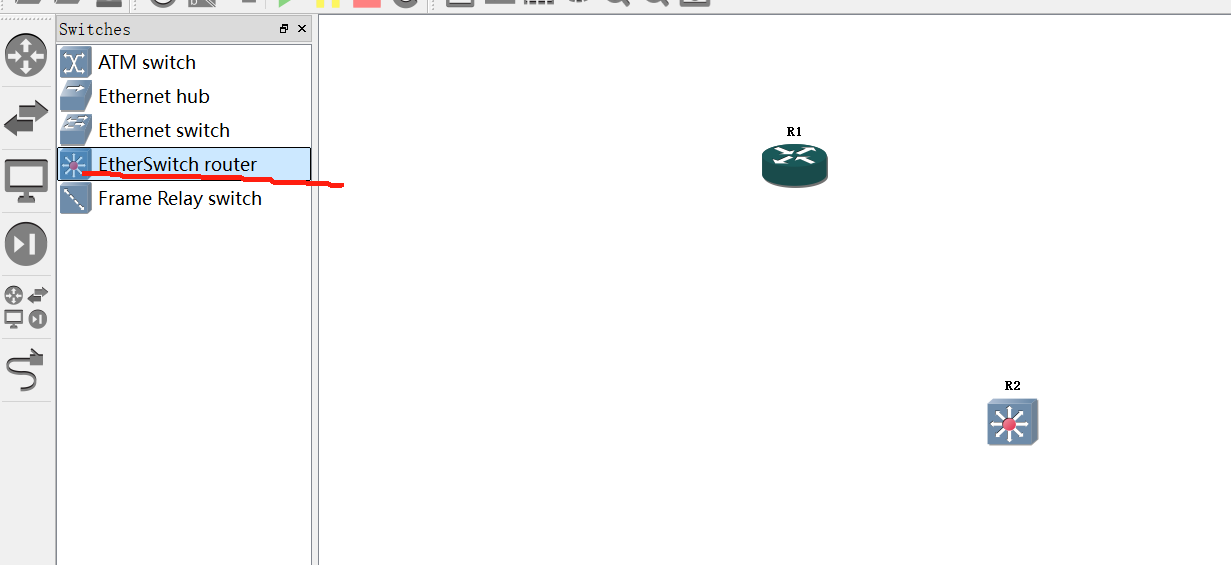
创建完成后发现已经有了交换机,步骤相同,先开机,再点console,回车,
2.构建网络
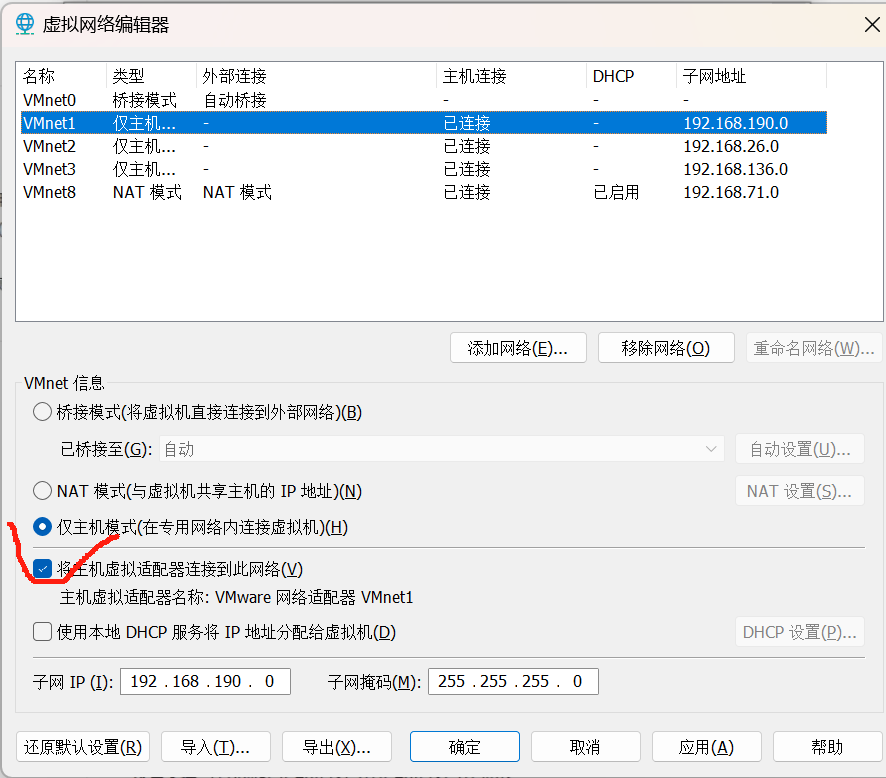
分别选择vm1和vm2网络进行连接
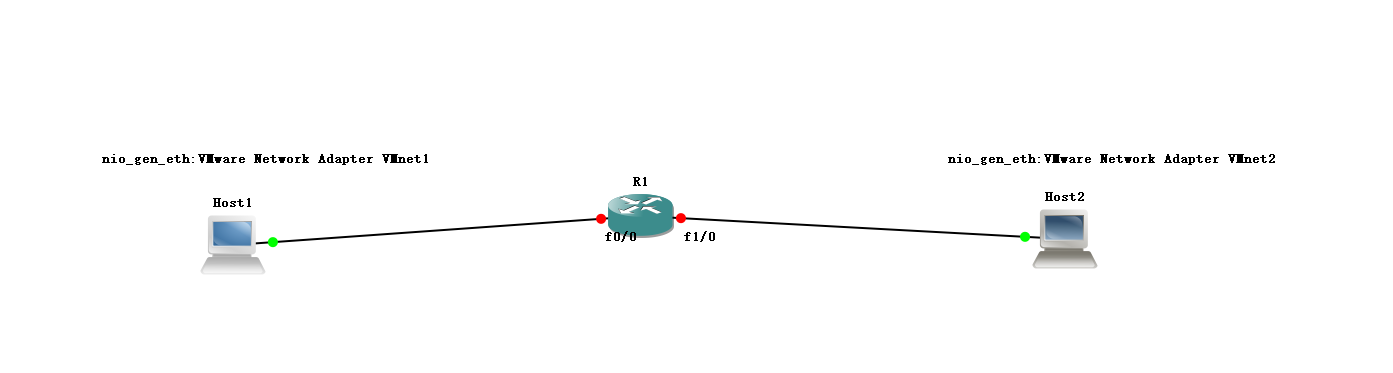
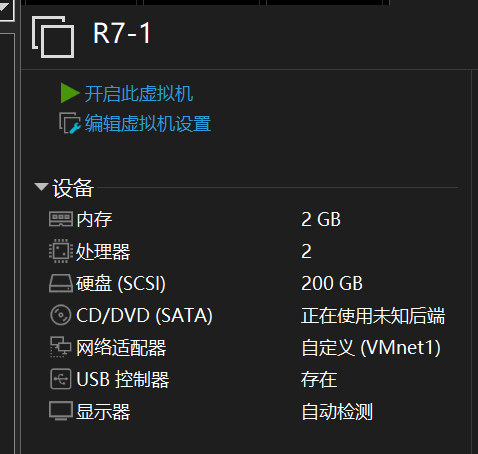
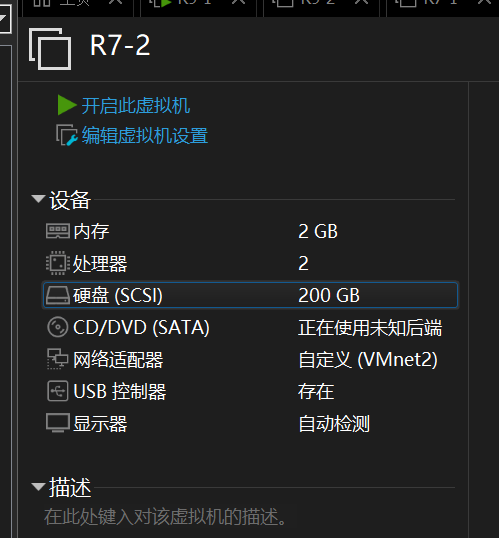
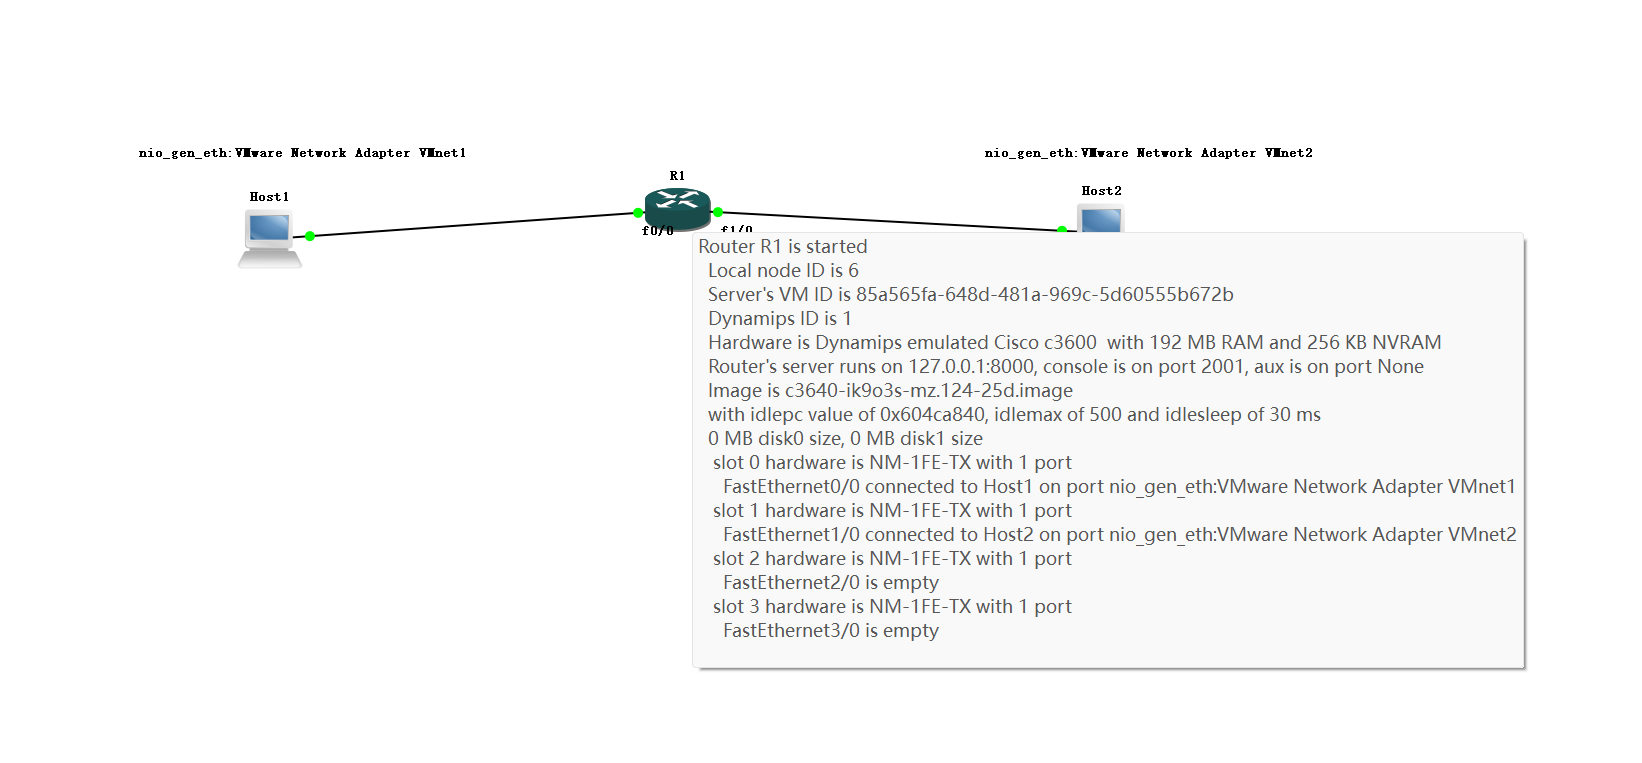
创建两台虚拟机,并分别连入VM1和VM2,确定网络编辑器
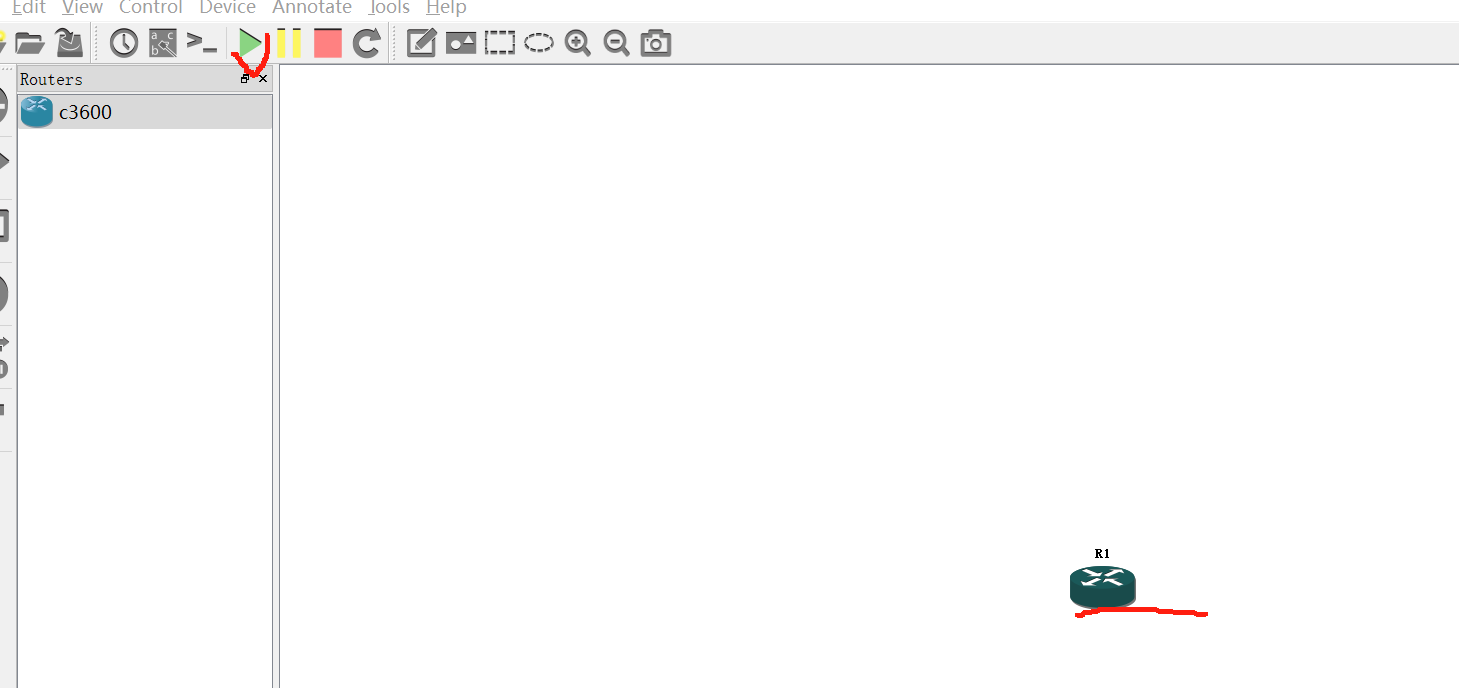
开机之后打开路由(start)
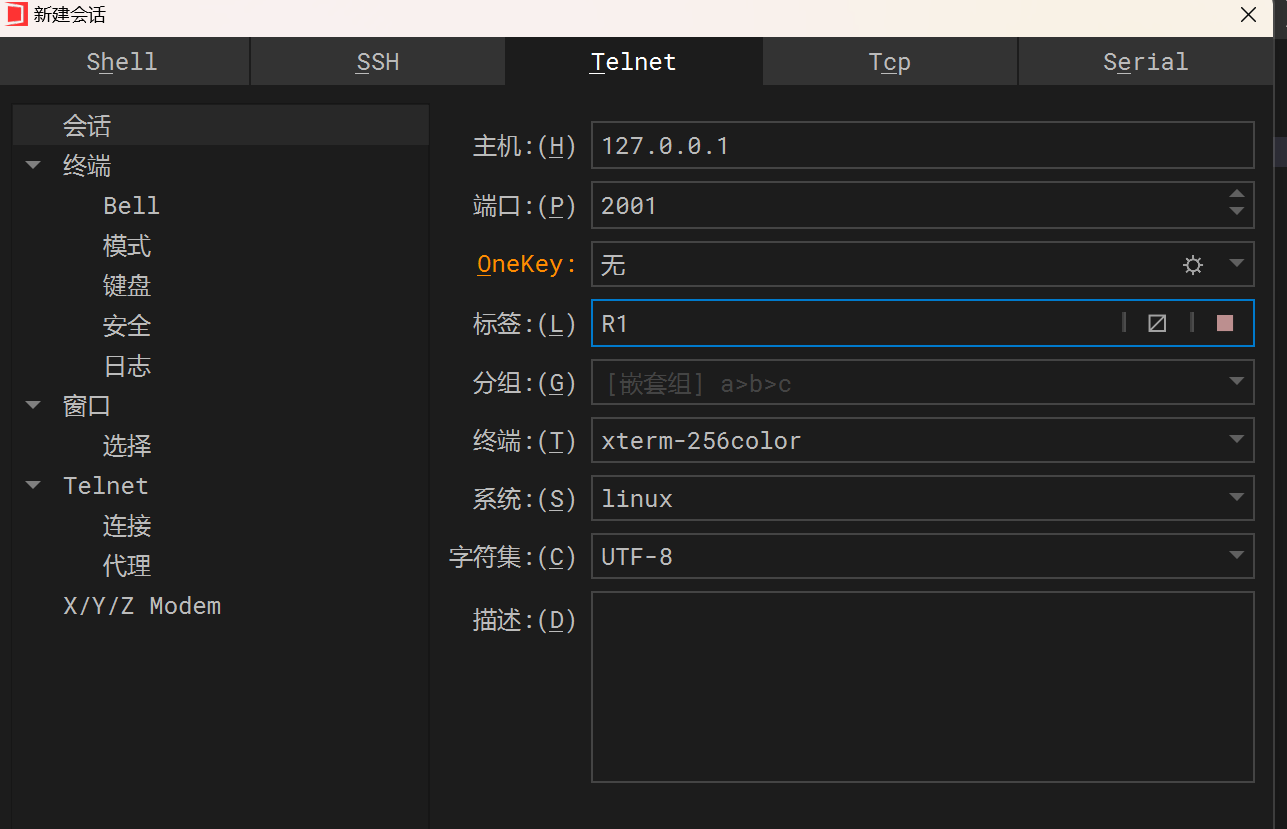
(选择使用)可以连接WindTerm
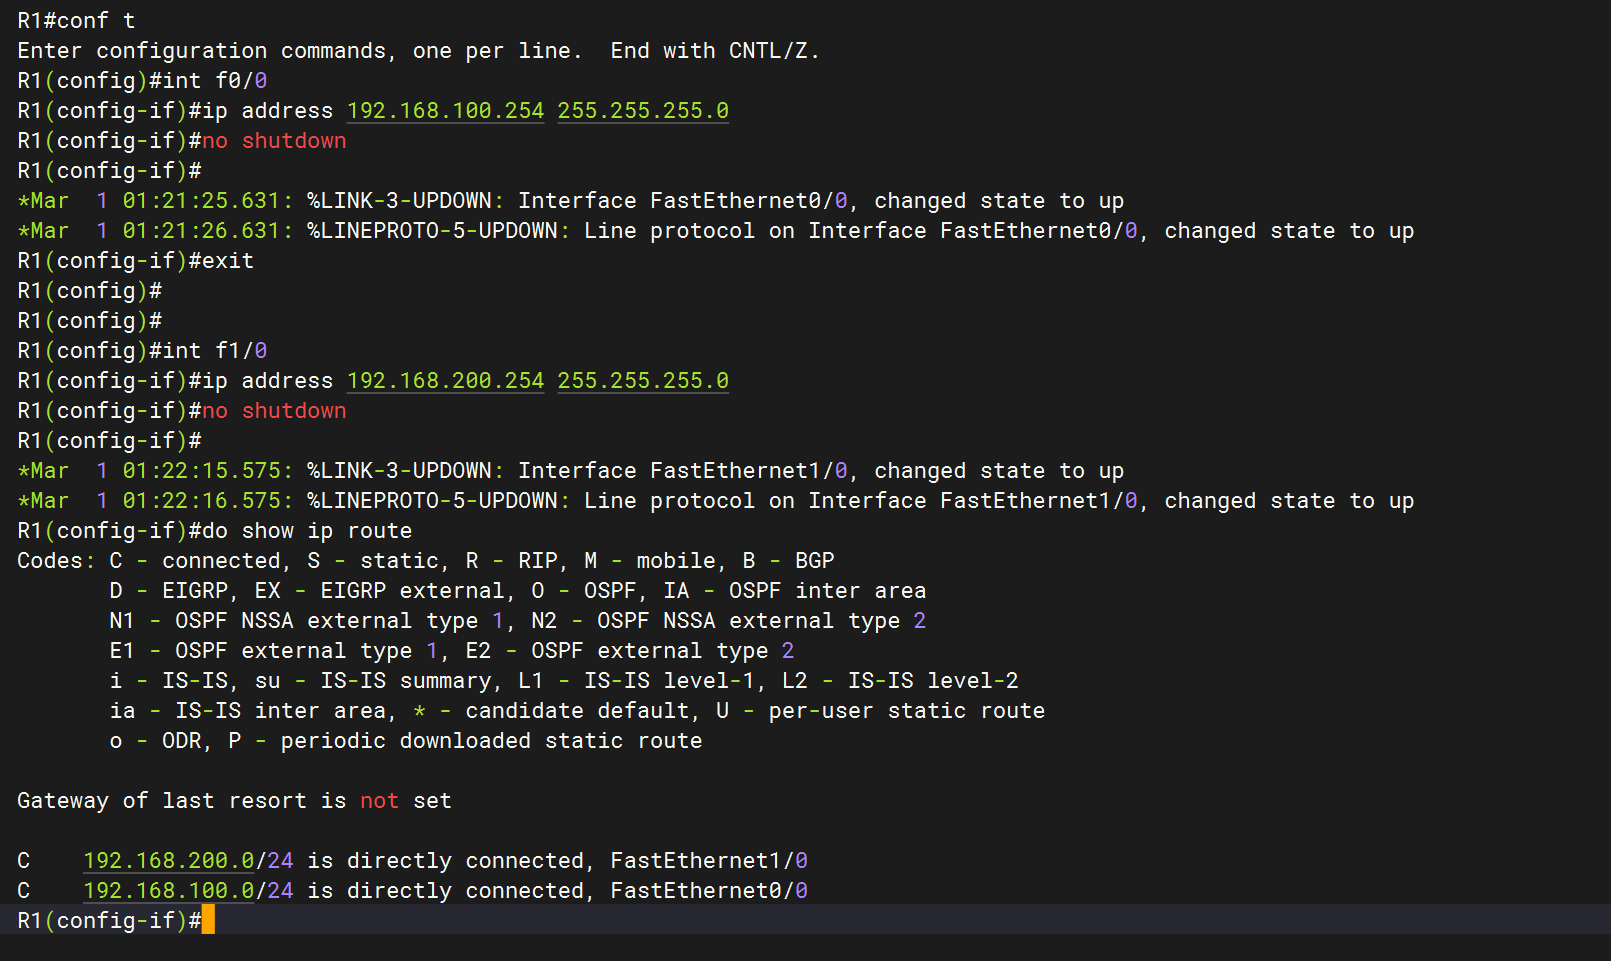
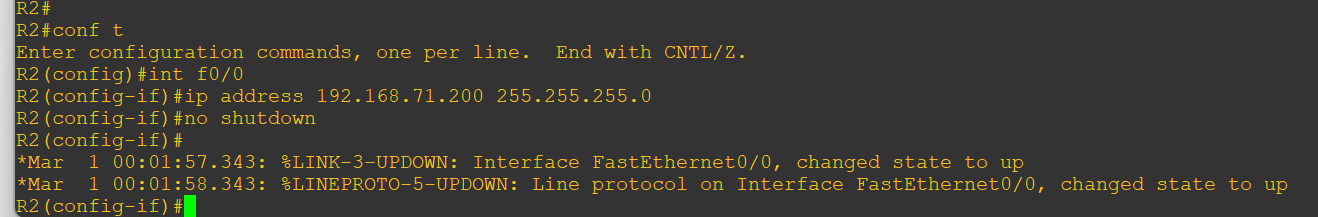
对路由进行配置
为虚拟机添加虚拟地址
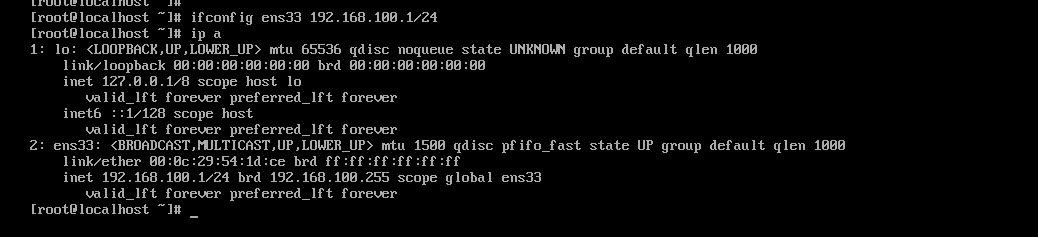
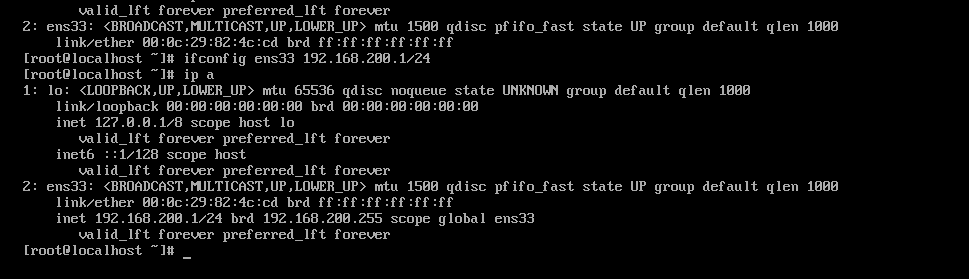
配置网关(net后加0/0是任意网关,可以单独指向地址段,也可以任意)
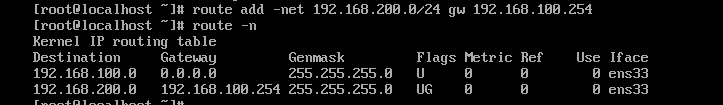
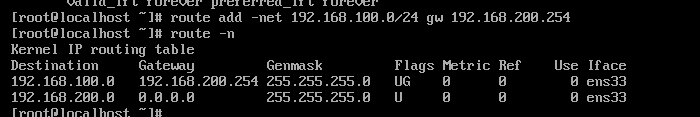
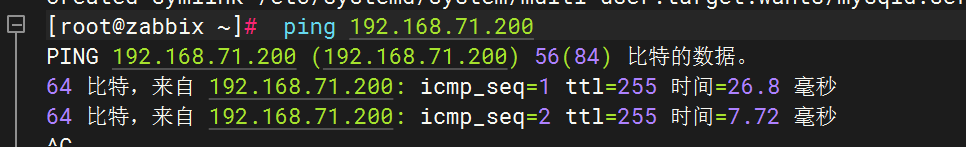
测试连通性


再次加入一组路由和主机,将zabbix主机连到路由上
使用zabbix主机测试连通性
3.添加Cisco路由器的监控
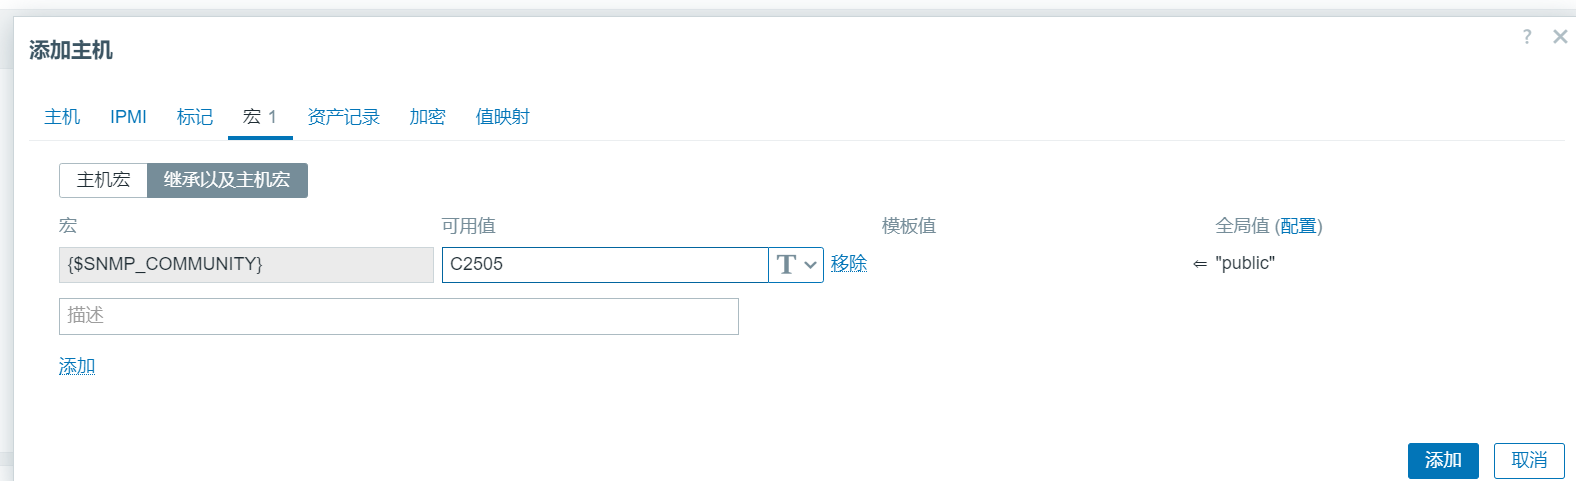
增加共同体

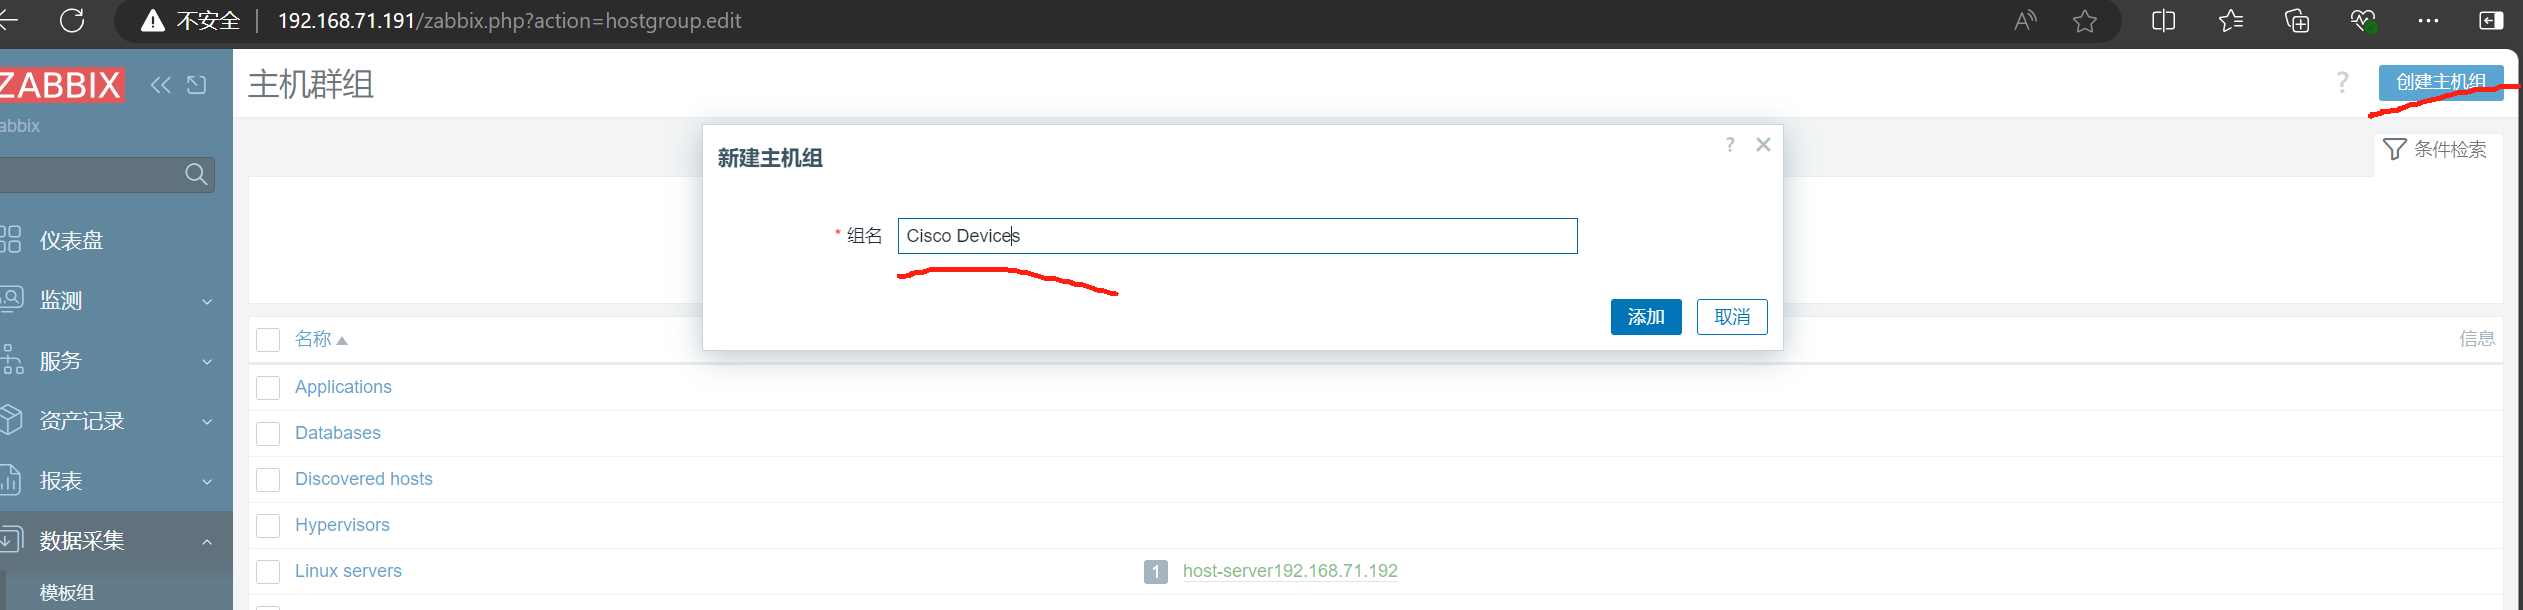
创建主机组
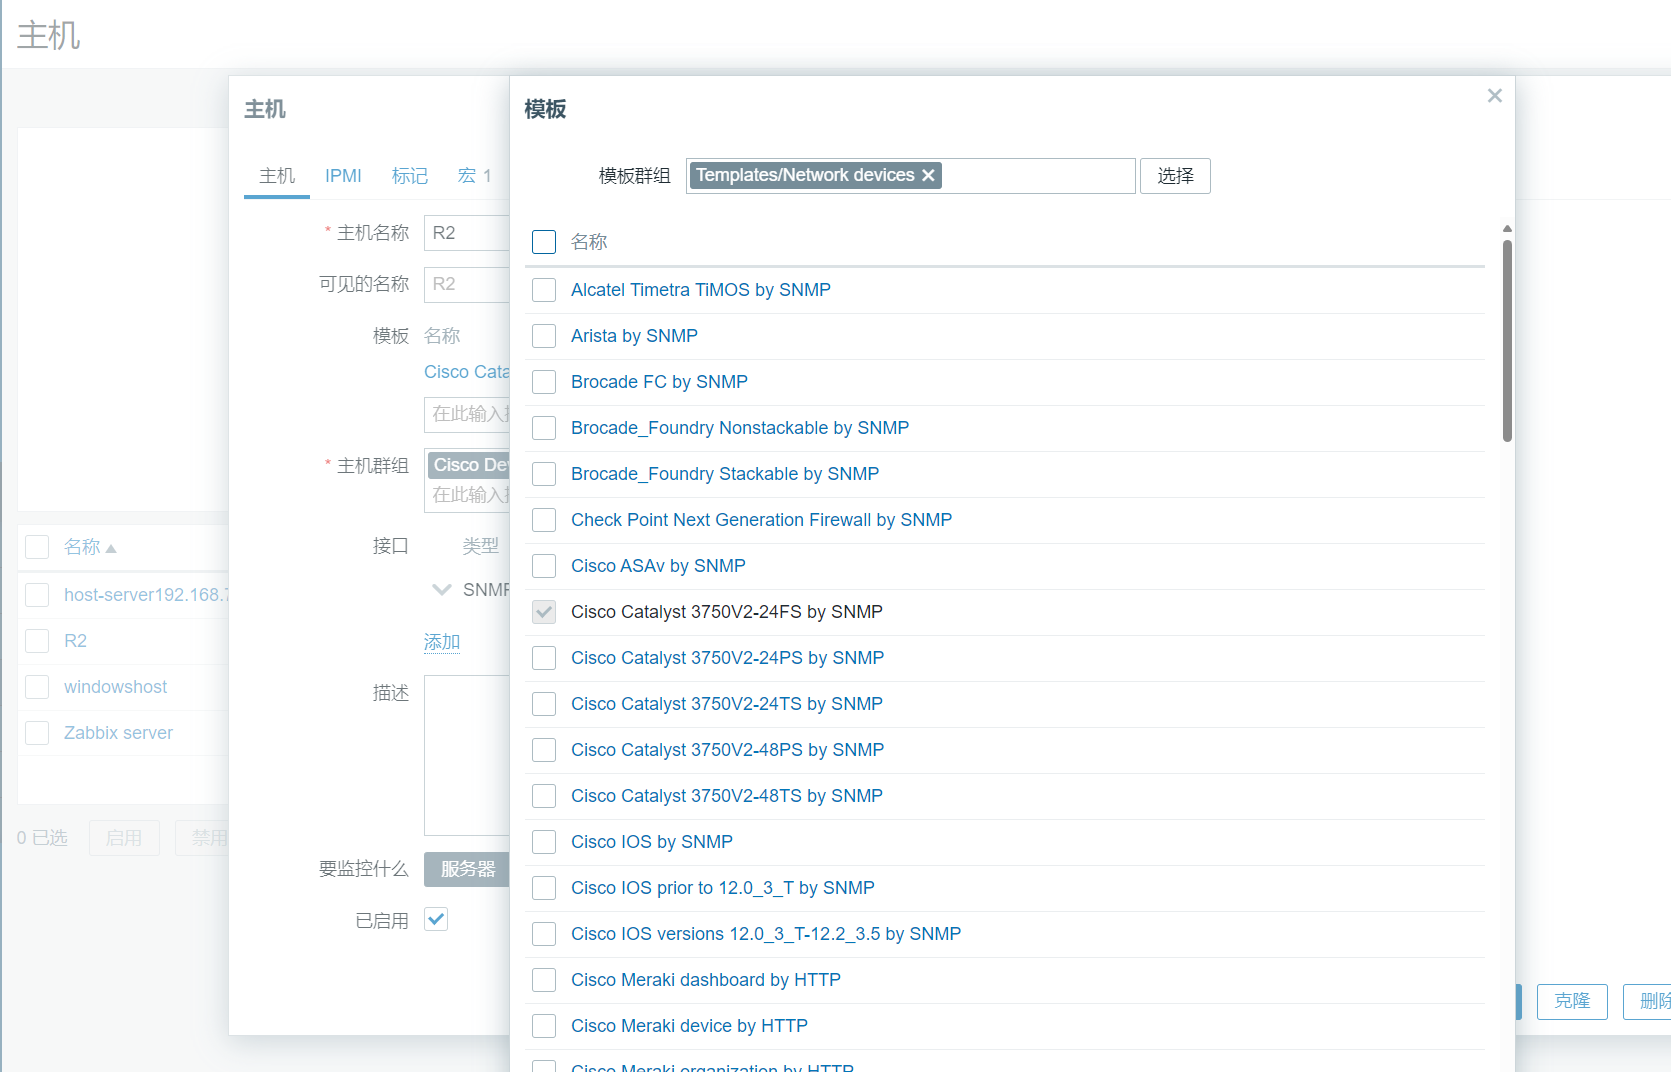
添加主机
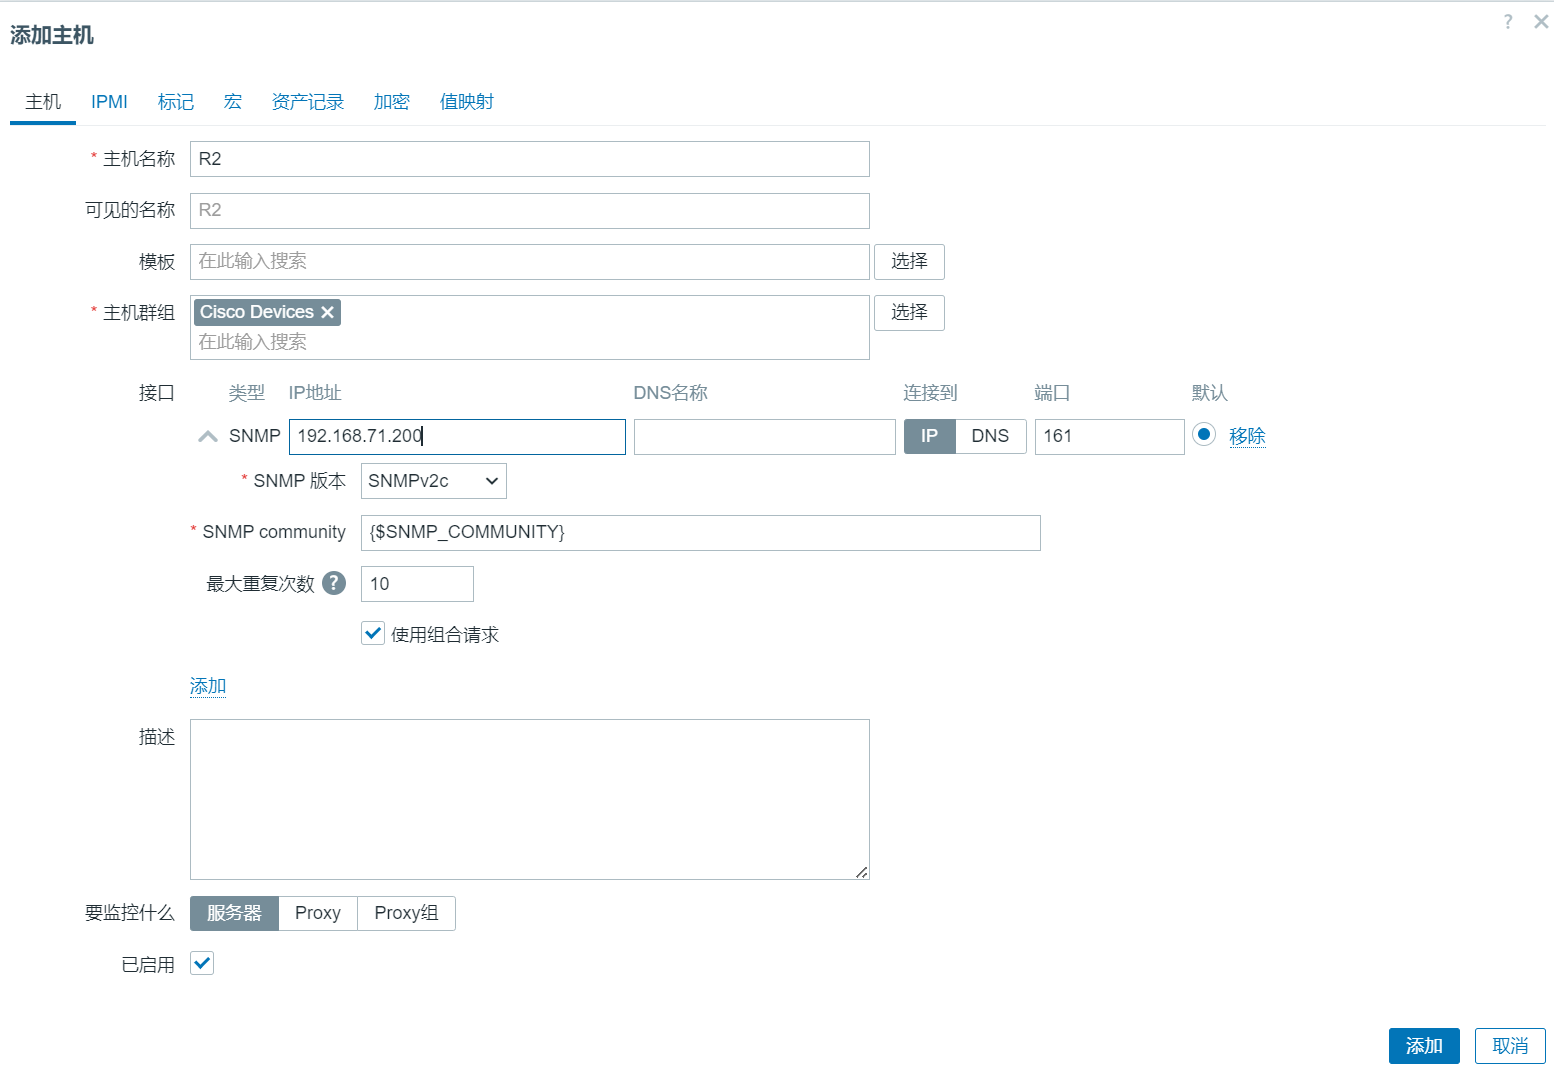
修改宏后点击添加
添加Cisco的模板
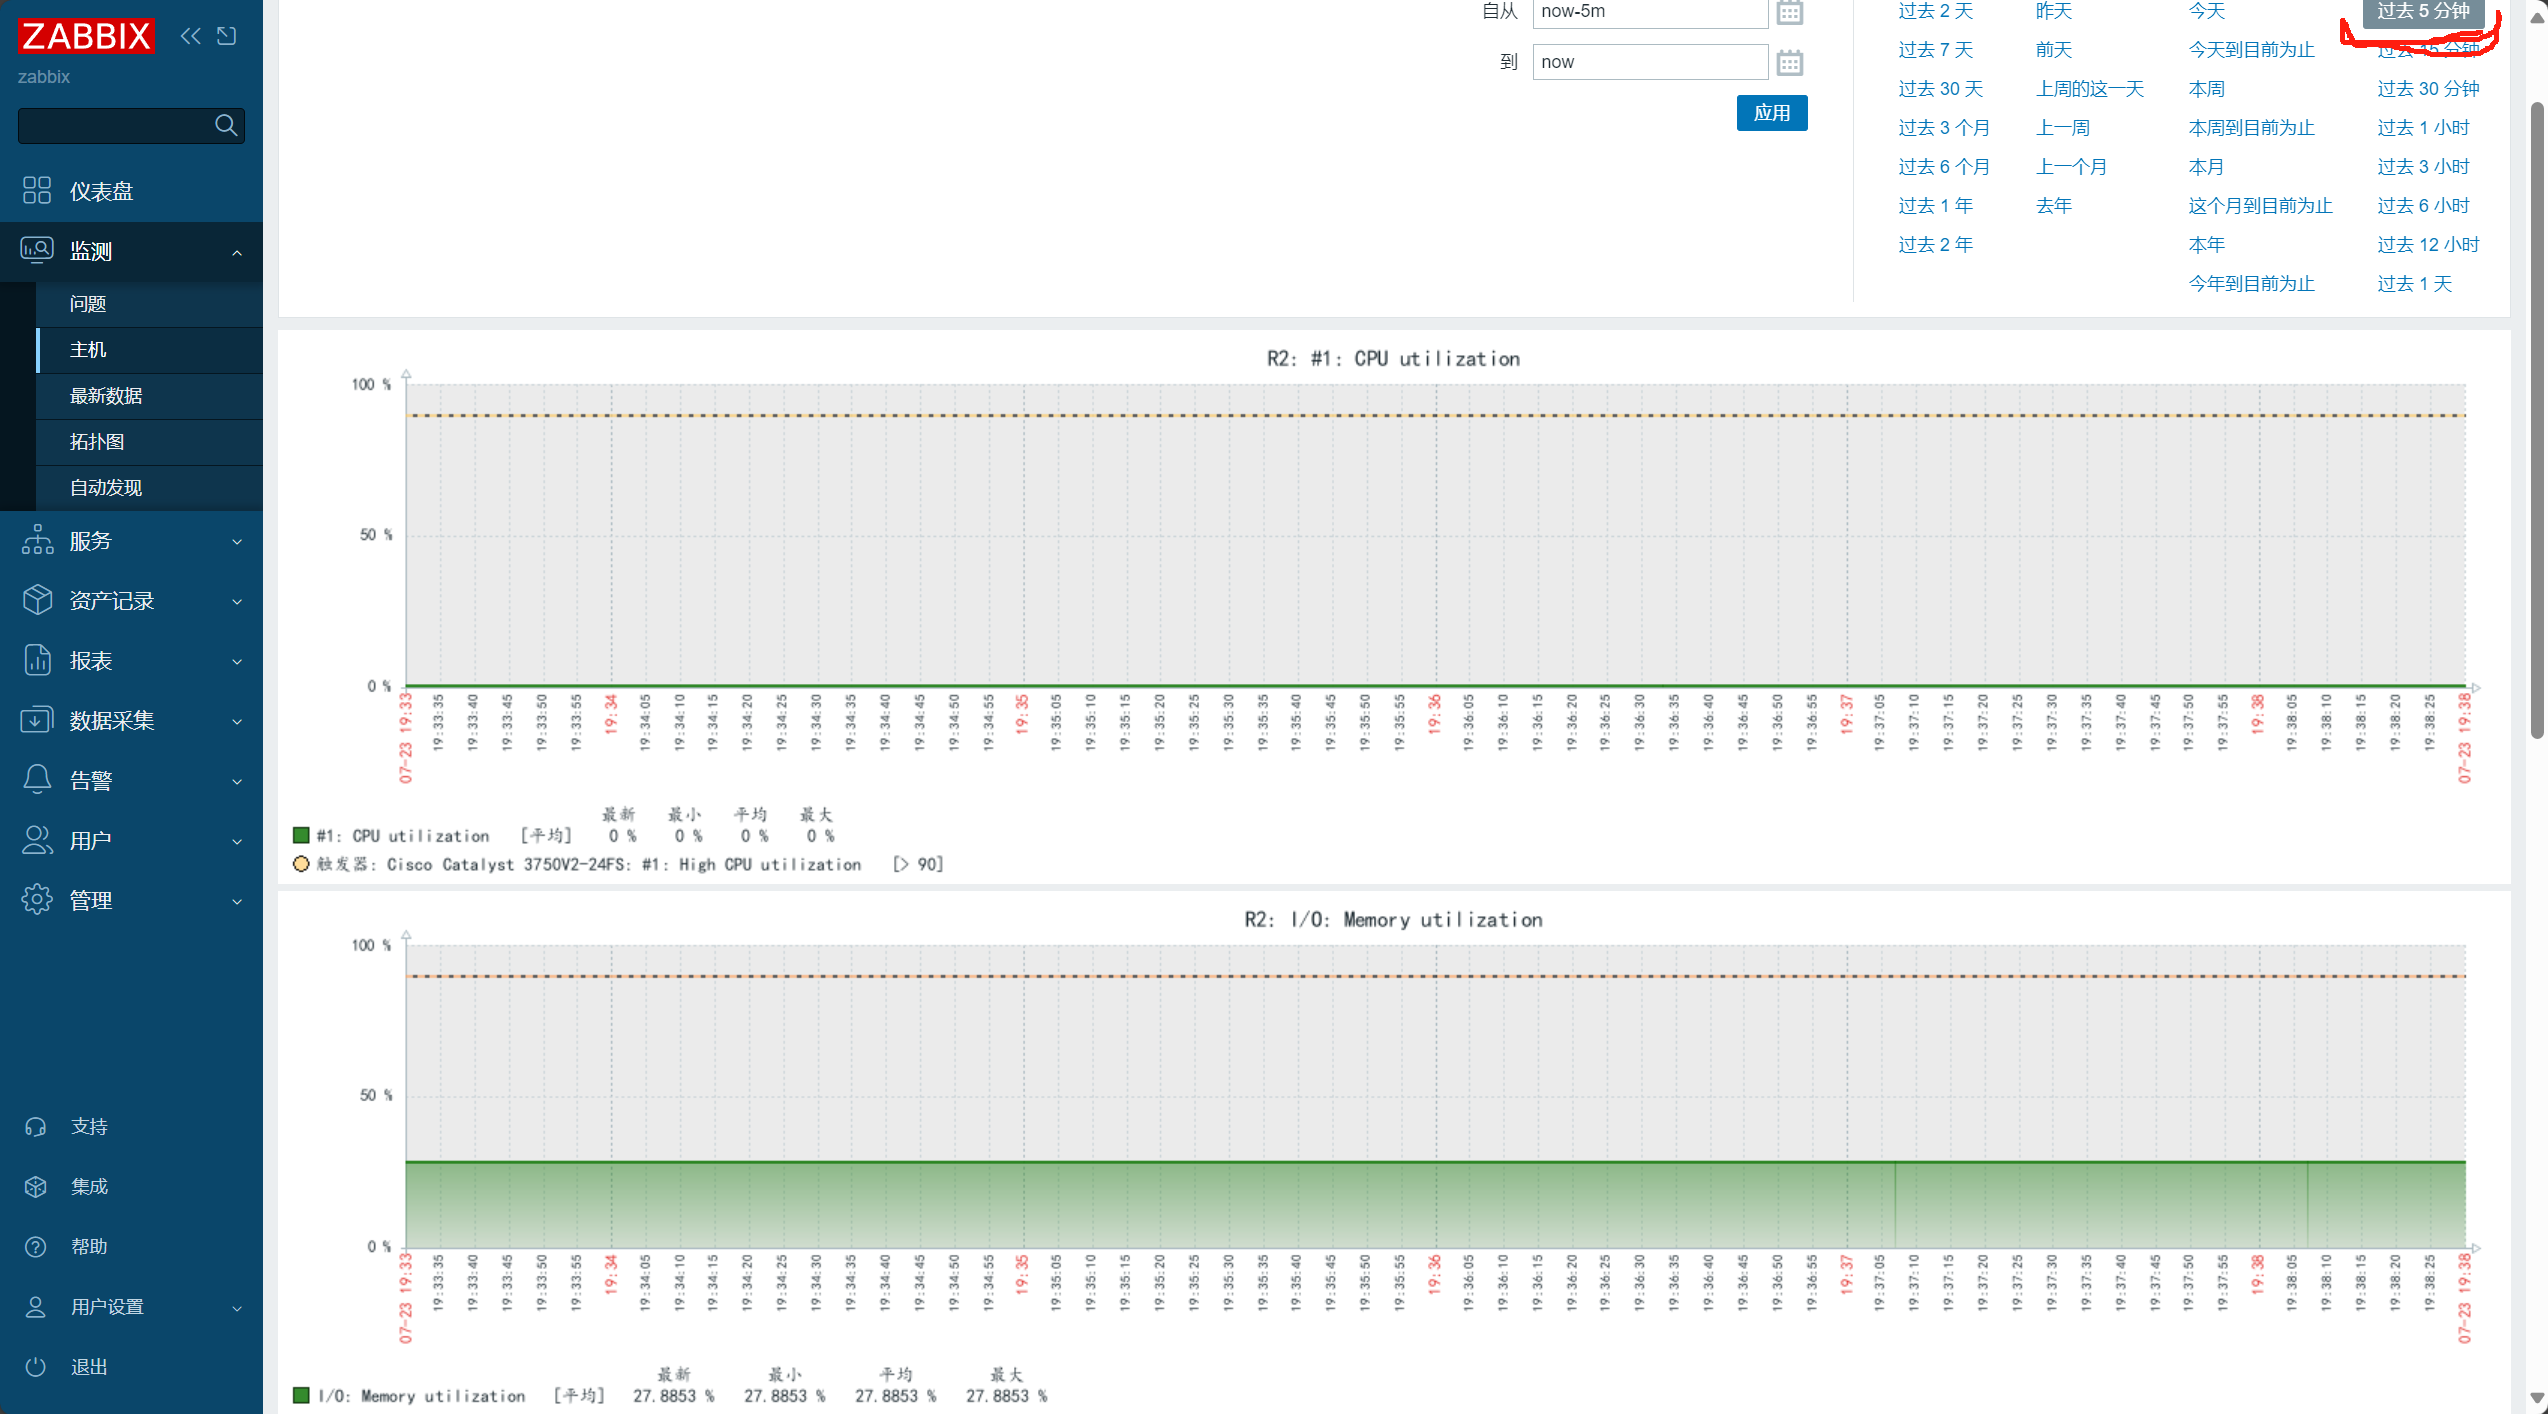
等待可用后,选择图形查看

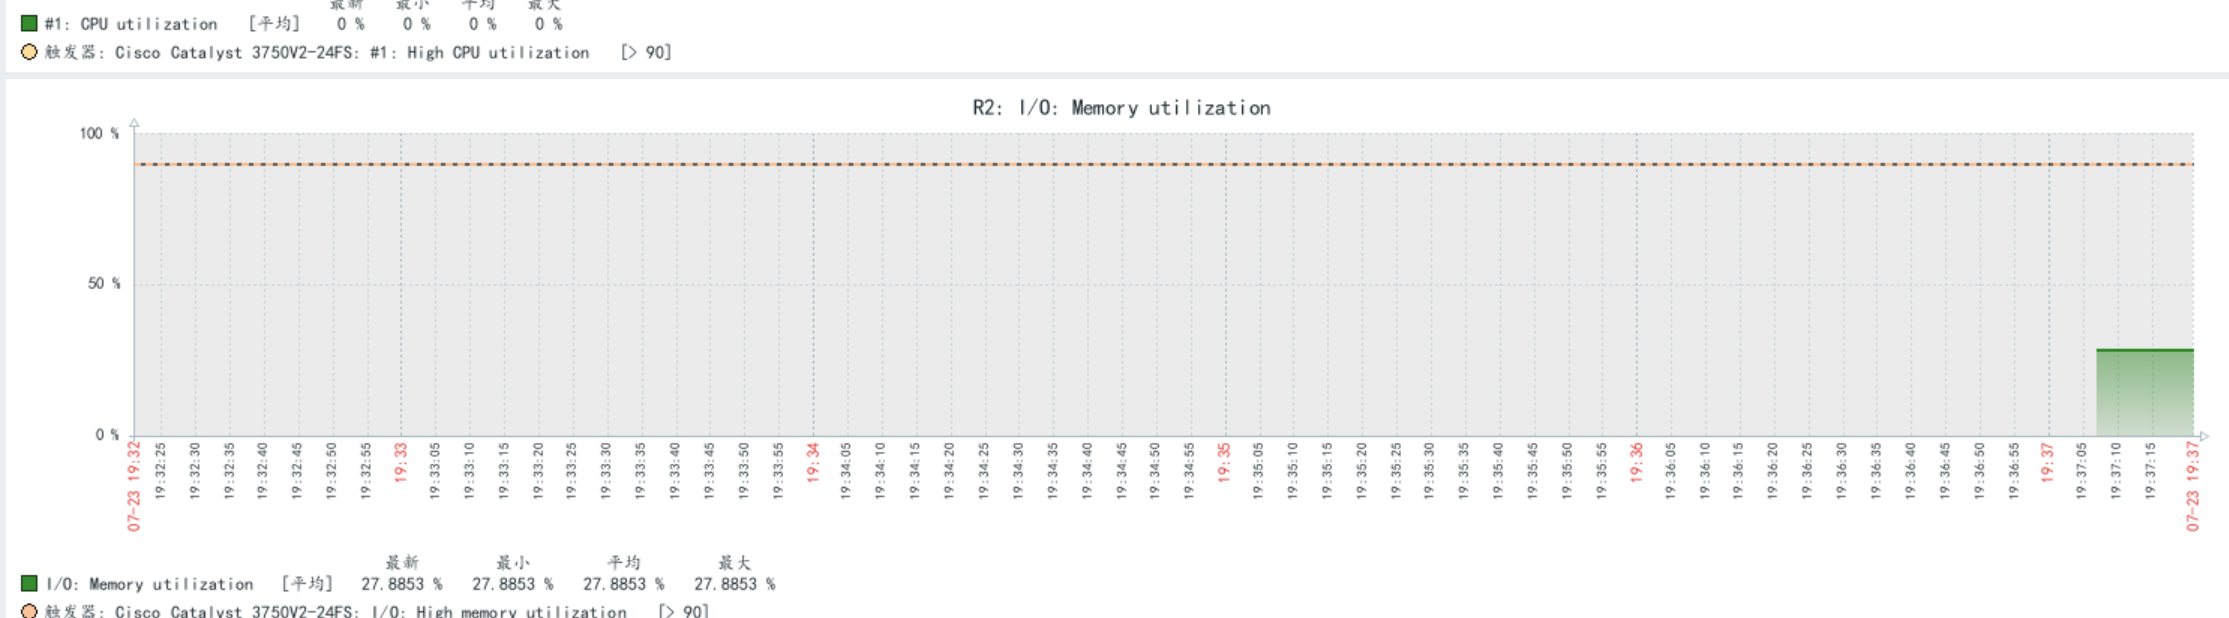
如果没有数据,可以选择缩短时间来看
二.中间件监控
1、MySQL数据库监控
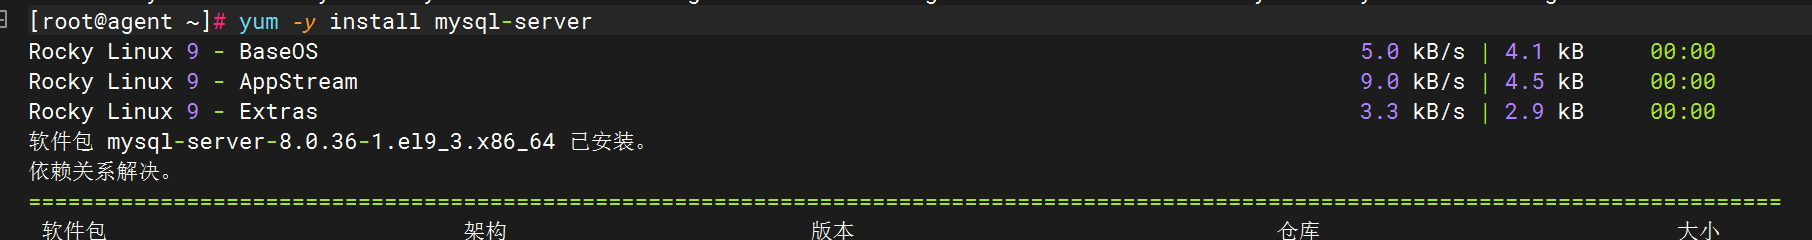
在被监控机下载mysql
1.1、拷贝自定义的监控脚本到指定目录
将配置文件直接复制到zabbix目录下
cp /usr/share/doc/zabbix-agent/userparameter_mysql.conf /etc/zabbix/zabbix_agentd.d/![]()
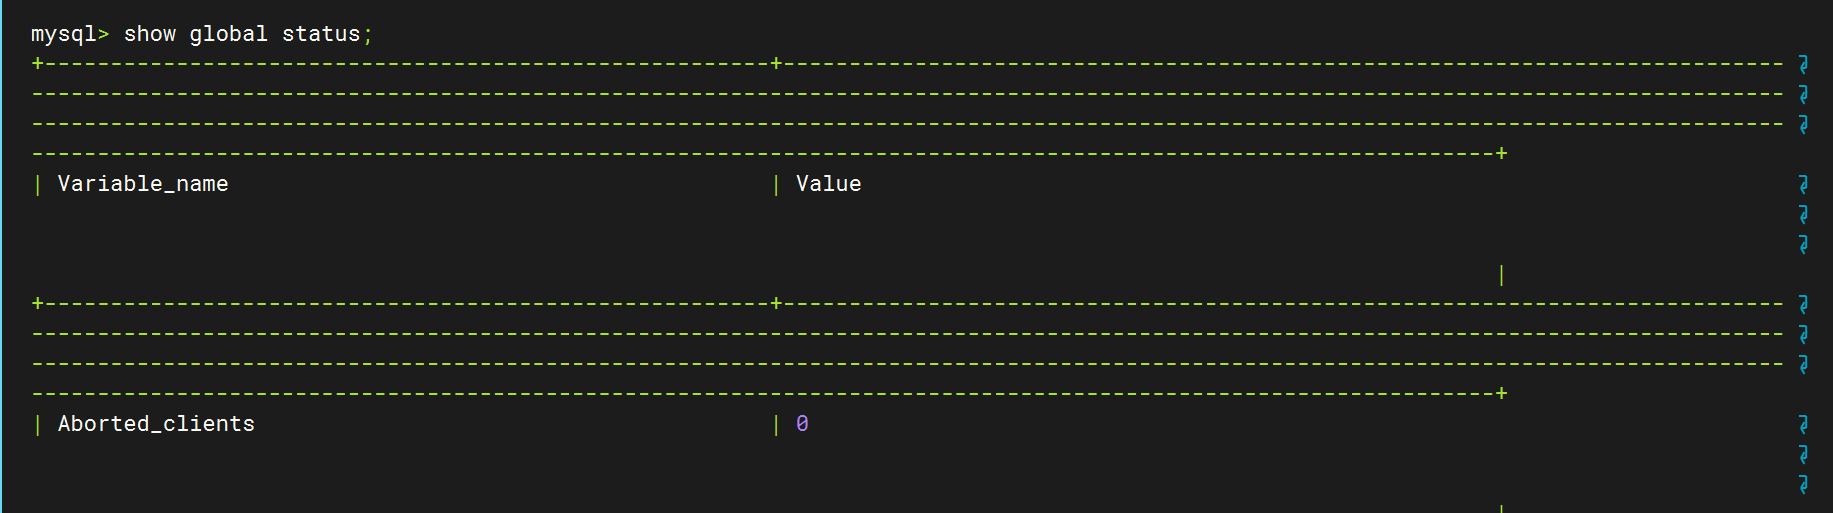
进入配置文件,测试命令可行性
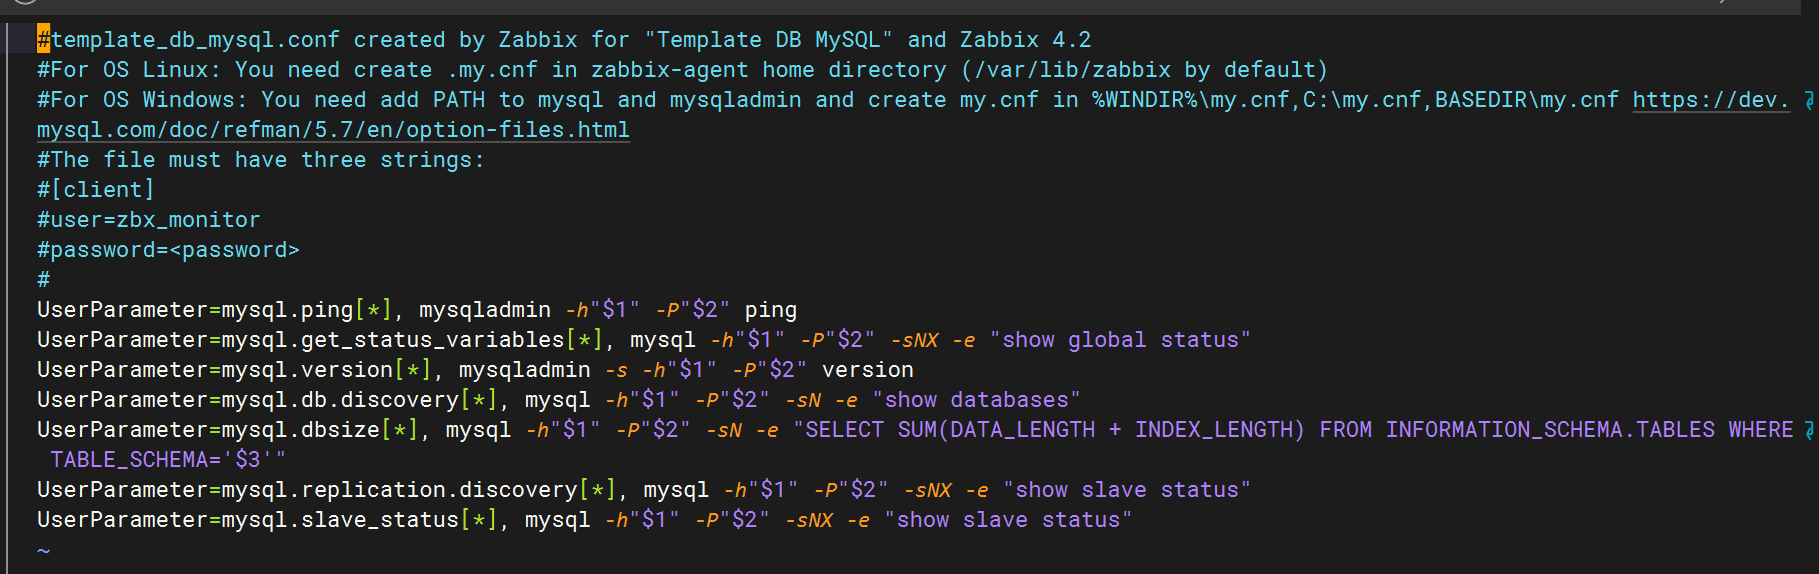
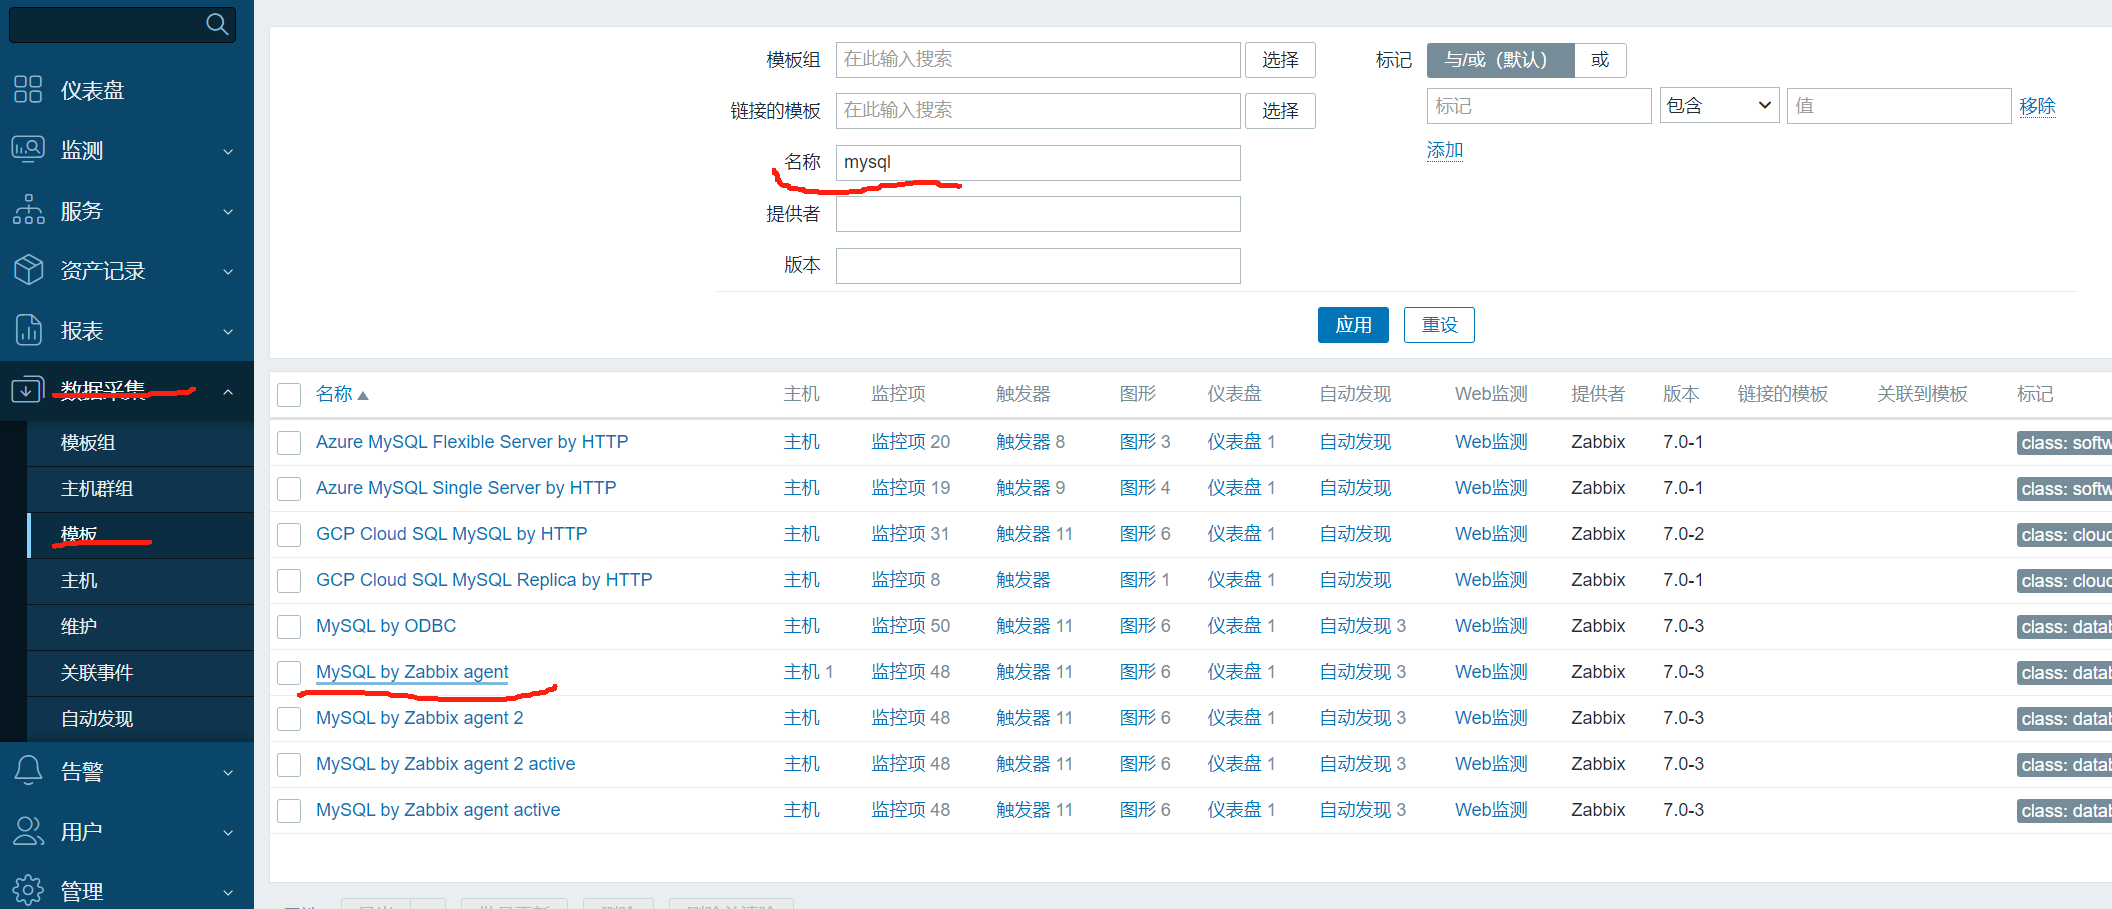
确认都可行之后,重启zabbix_agent服务,在模板里,将之前的取消,选择新的模板
然后去模板处查看使用说明
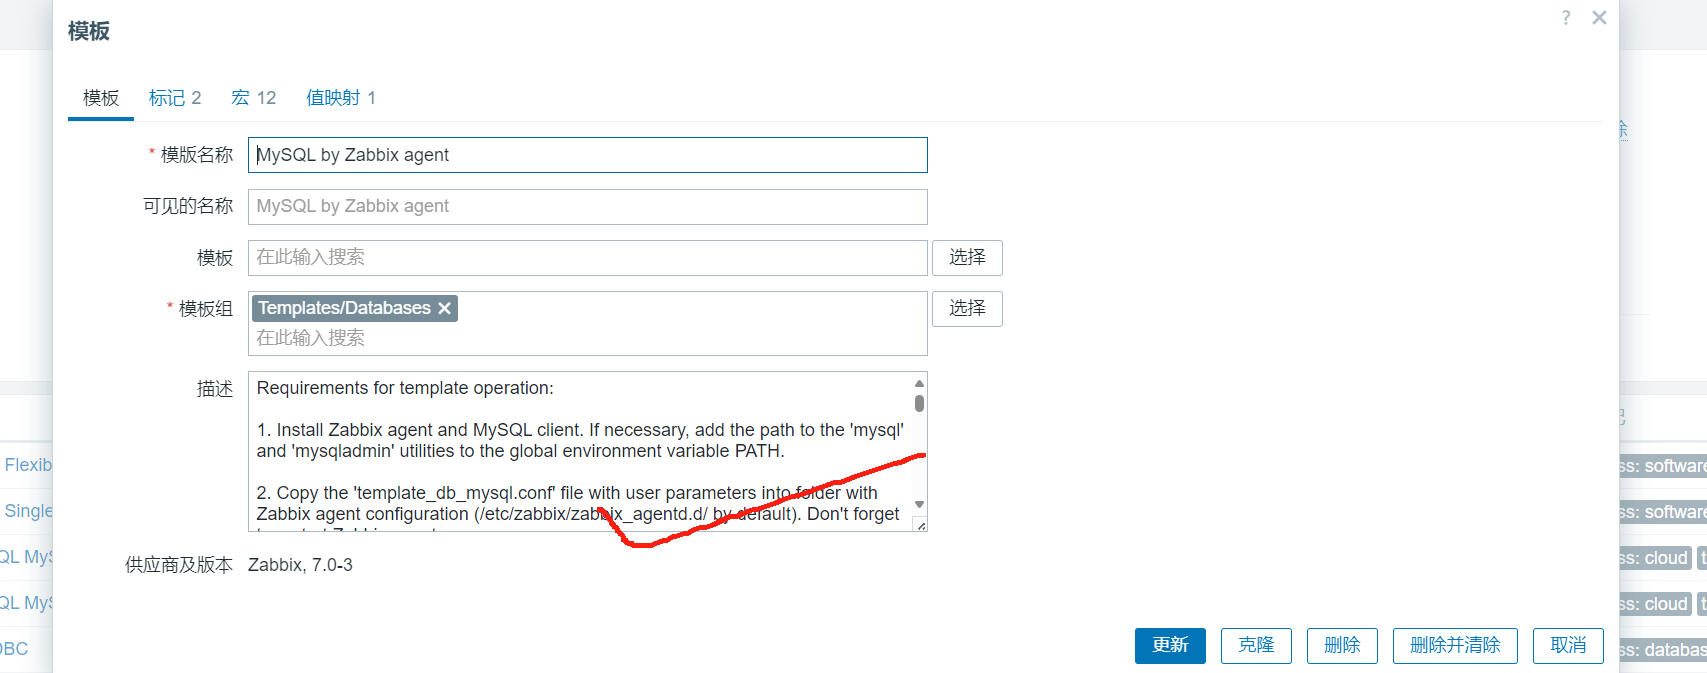
Requirements for template operation:
1. Install Zabbix agent and MySQL client. If necessary, add the path to the 'mysql' and 'mysqladmin' utilities to the global environment variable PATH.
2. Copy the 'template_db_mysql.conf' file with user parameters into folder with Zabbix agent configuration (/etc/zabbix/zabbix_agentd.d/ by default). Don't forget to restart Zabbix agent.
3. Create the MySQL user that will be used for monitoring ('<password>' at your discretion). For example:
CREATE USER 'zbx_monitor'@'%' IDENTIFIED BY '<password>';
GRANT REPLICATION CLIENT,PROCESS,SHOW DATABASES,SHOW VIEW ON *.* TO 'zbx_monitor'@'%';For more information, please see MySQL documentation (https://dev.mysql.com/doc/refman/8.0/en/grant.html).
NOTE: In order to collect replication metrics, MariaDB Enterprise Server 10.5.8-5 and above and MariaDB Community Server 10.5.9 and above require the SLAVE MONITOR privilege to be set for the monitoring user:
GRANT REPLICATION CLIENT,PROCESS,SHOW DATABASES,SHOW VIEW,SLAVE MONITOR ON *.* TO 'zbx_monitor'@'%';
For more information, please read the MariaDB documentation (https://mariadb.com/docs/server/ref/mdb/privileges/SLAVE_MONITOR/).
4. Create '.my.cnf' configuration file in the home directory of Zabbix agent for Linux distributions (/var/lib/zabbix by default) or 'my.cnf' in c:\ for Windows. For example:
[client]
protocol=tcp
user='zbx_monitor'
password='<password>'For more information, please see MySQL documentation (https://dev.mysql.com/doc/refman/8.0/en/option-files.html).
NOTE: Linux distributions that use SELinux may require additional steps for access configuration.
You can discuss this template or leave feedback on our forum https://www.zabbix.com/forum/zabbix-suggestions-and-feedback/384189-discussion-thread-for-official-zabbix-template-db-mysql
Generated by official Zabbix template tool "Templator"
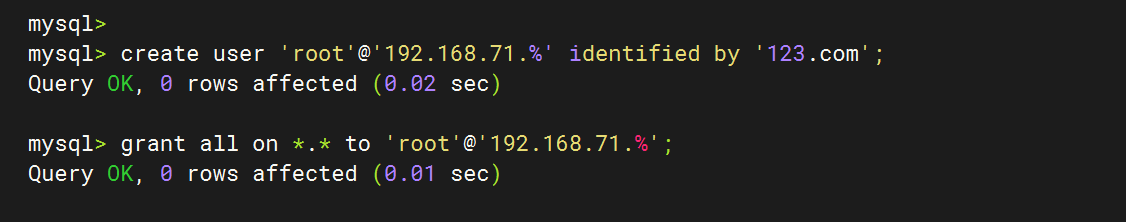
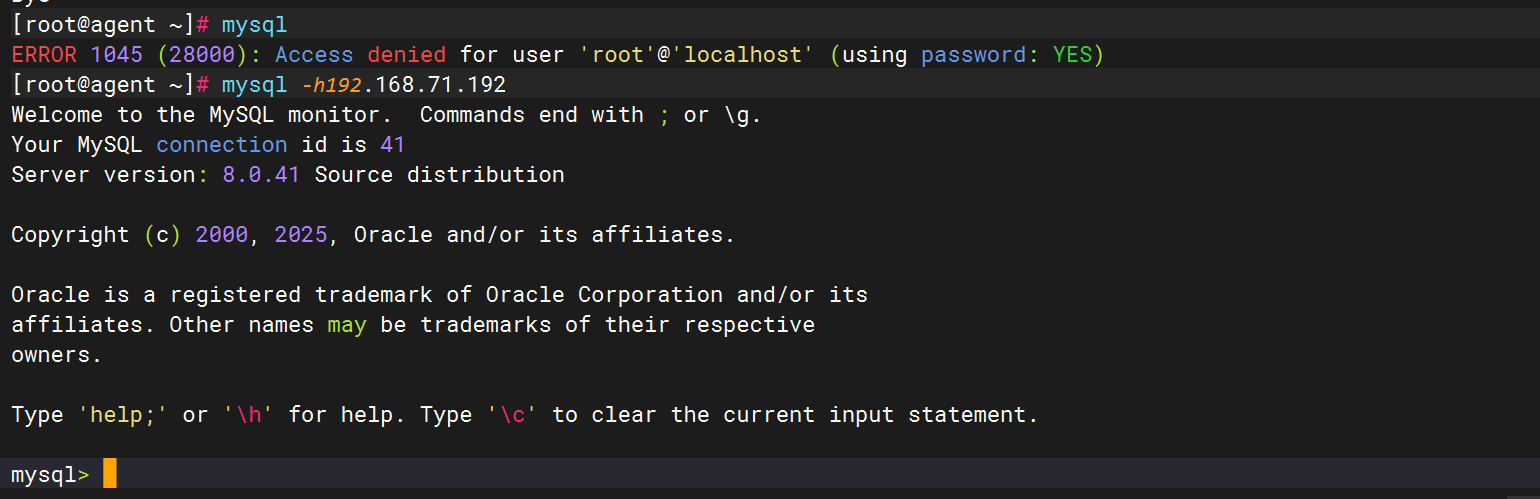
1.2、添加监控用户
mysql
create user root@'192.168.115.%' identified by '123.com';
grant all on *.* to root@'192.168.115.%';
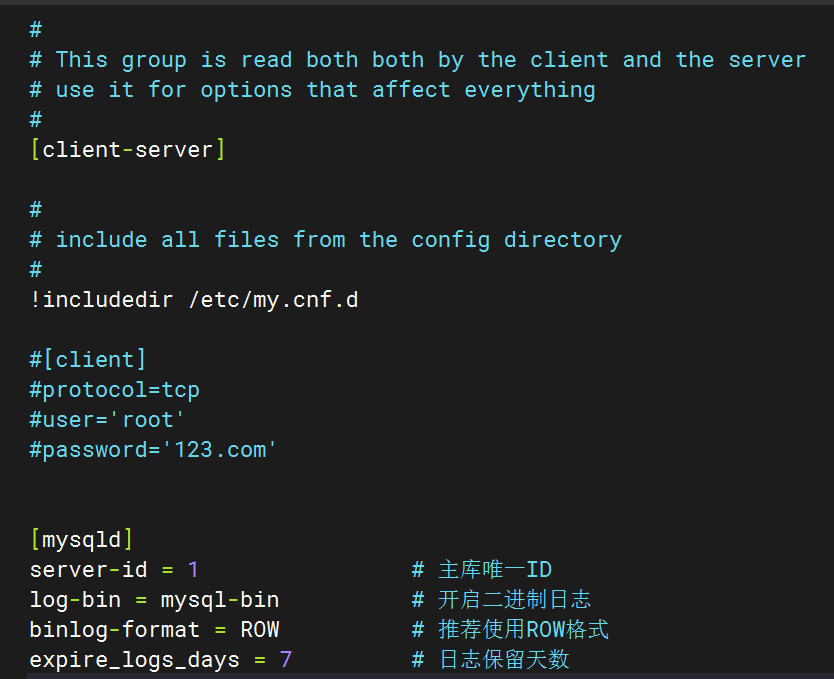
vim /etc/my.cnf
[client]
protocol=tcp
user='root'
password='123.com'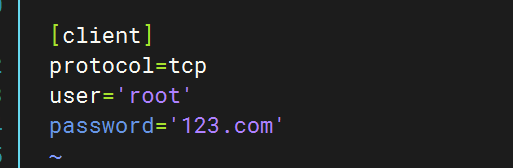
此时登录mysql,可以免密登录
1.3、重启zabbix-agent服务
systemctl restart zabbix-agent1.4、在zabbix-server服务端测试数据
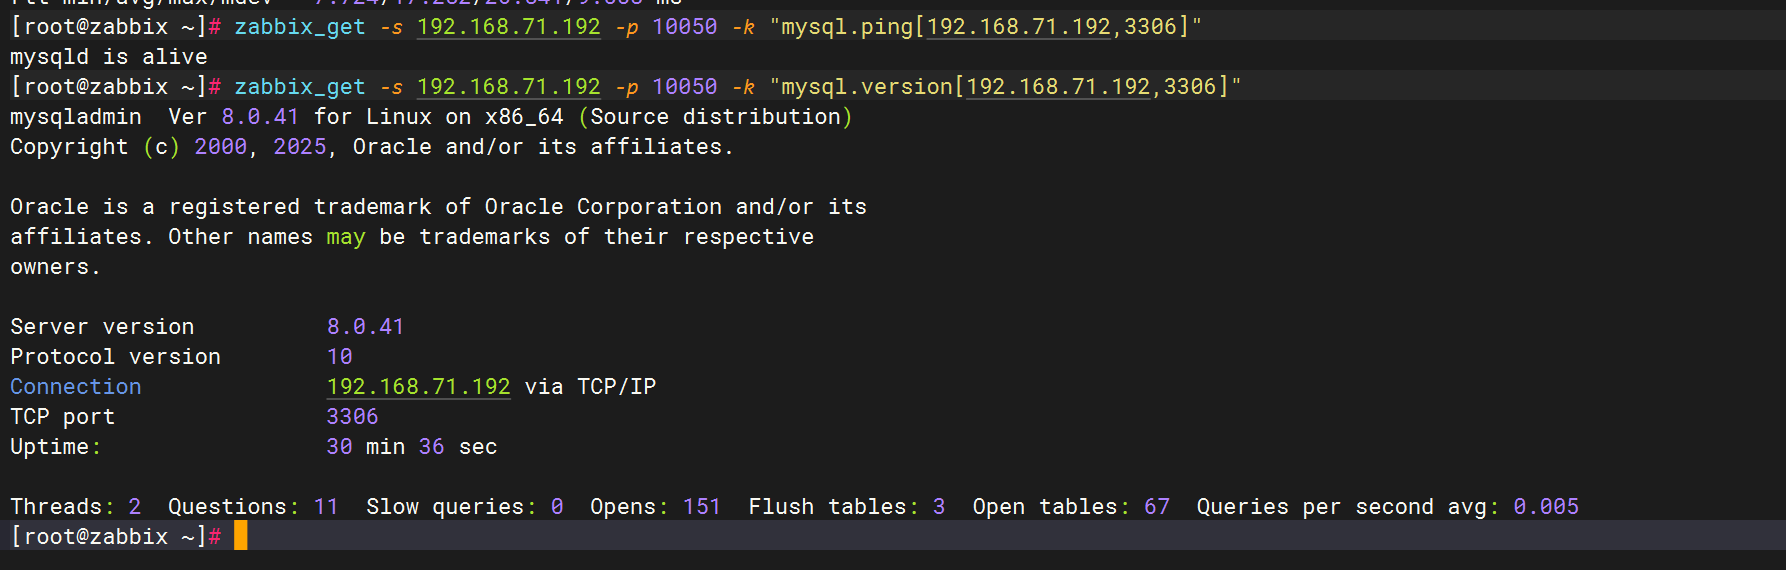
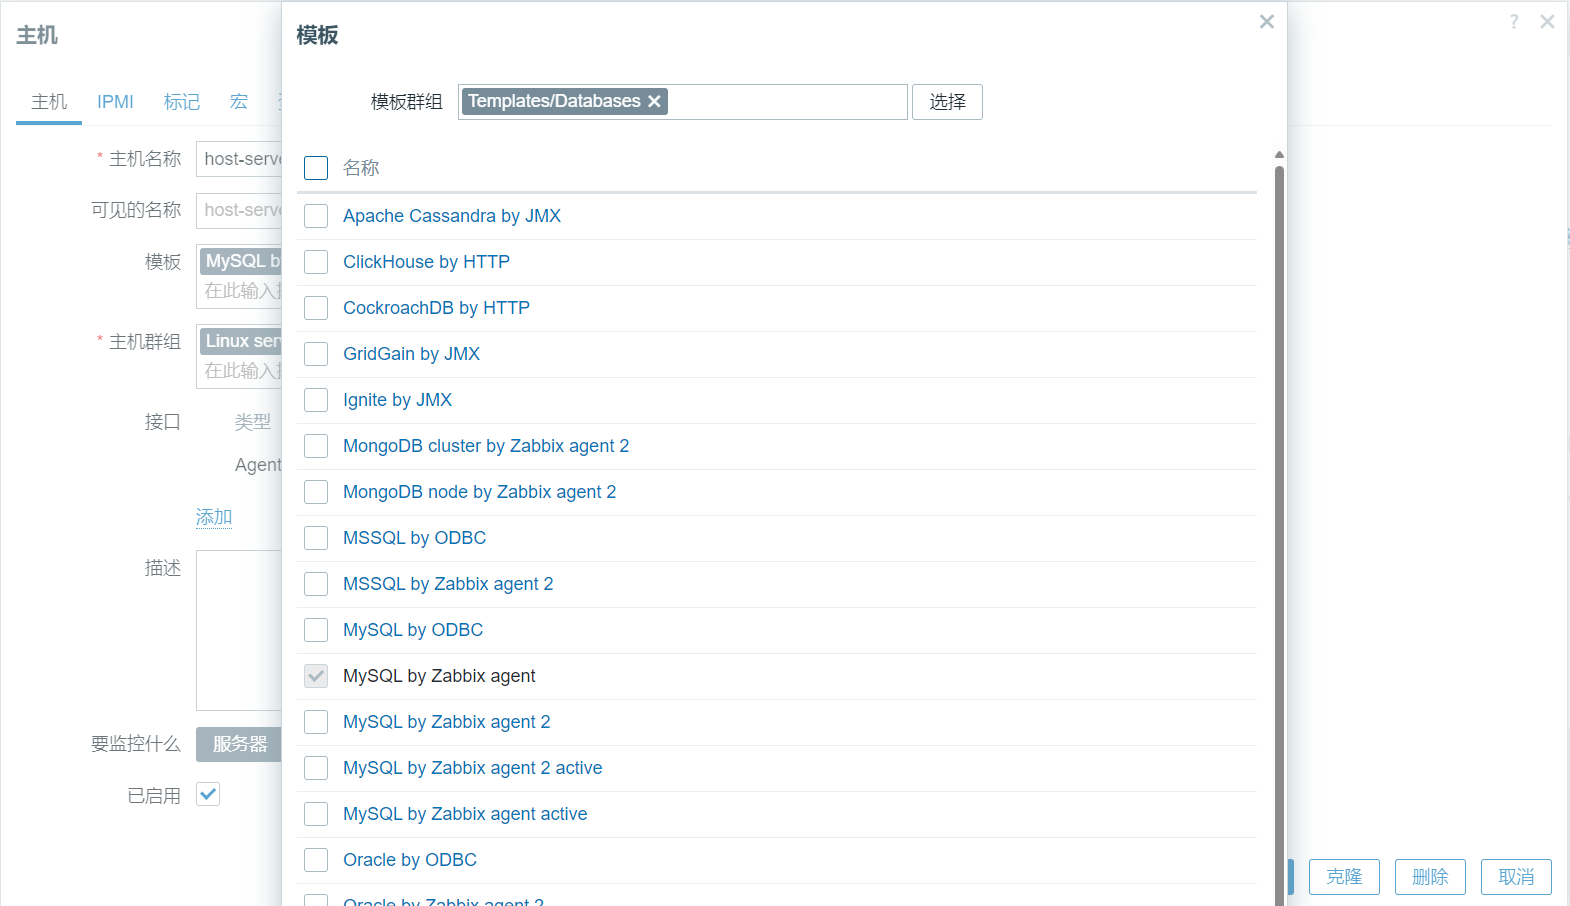
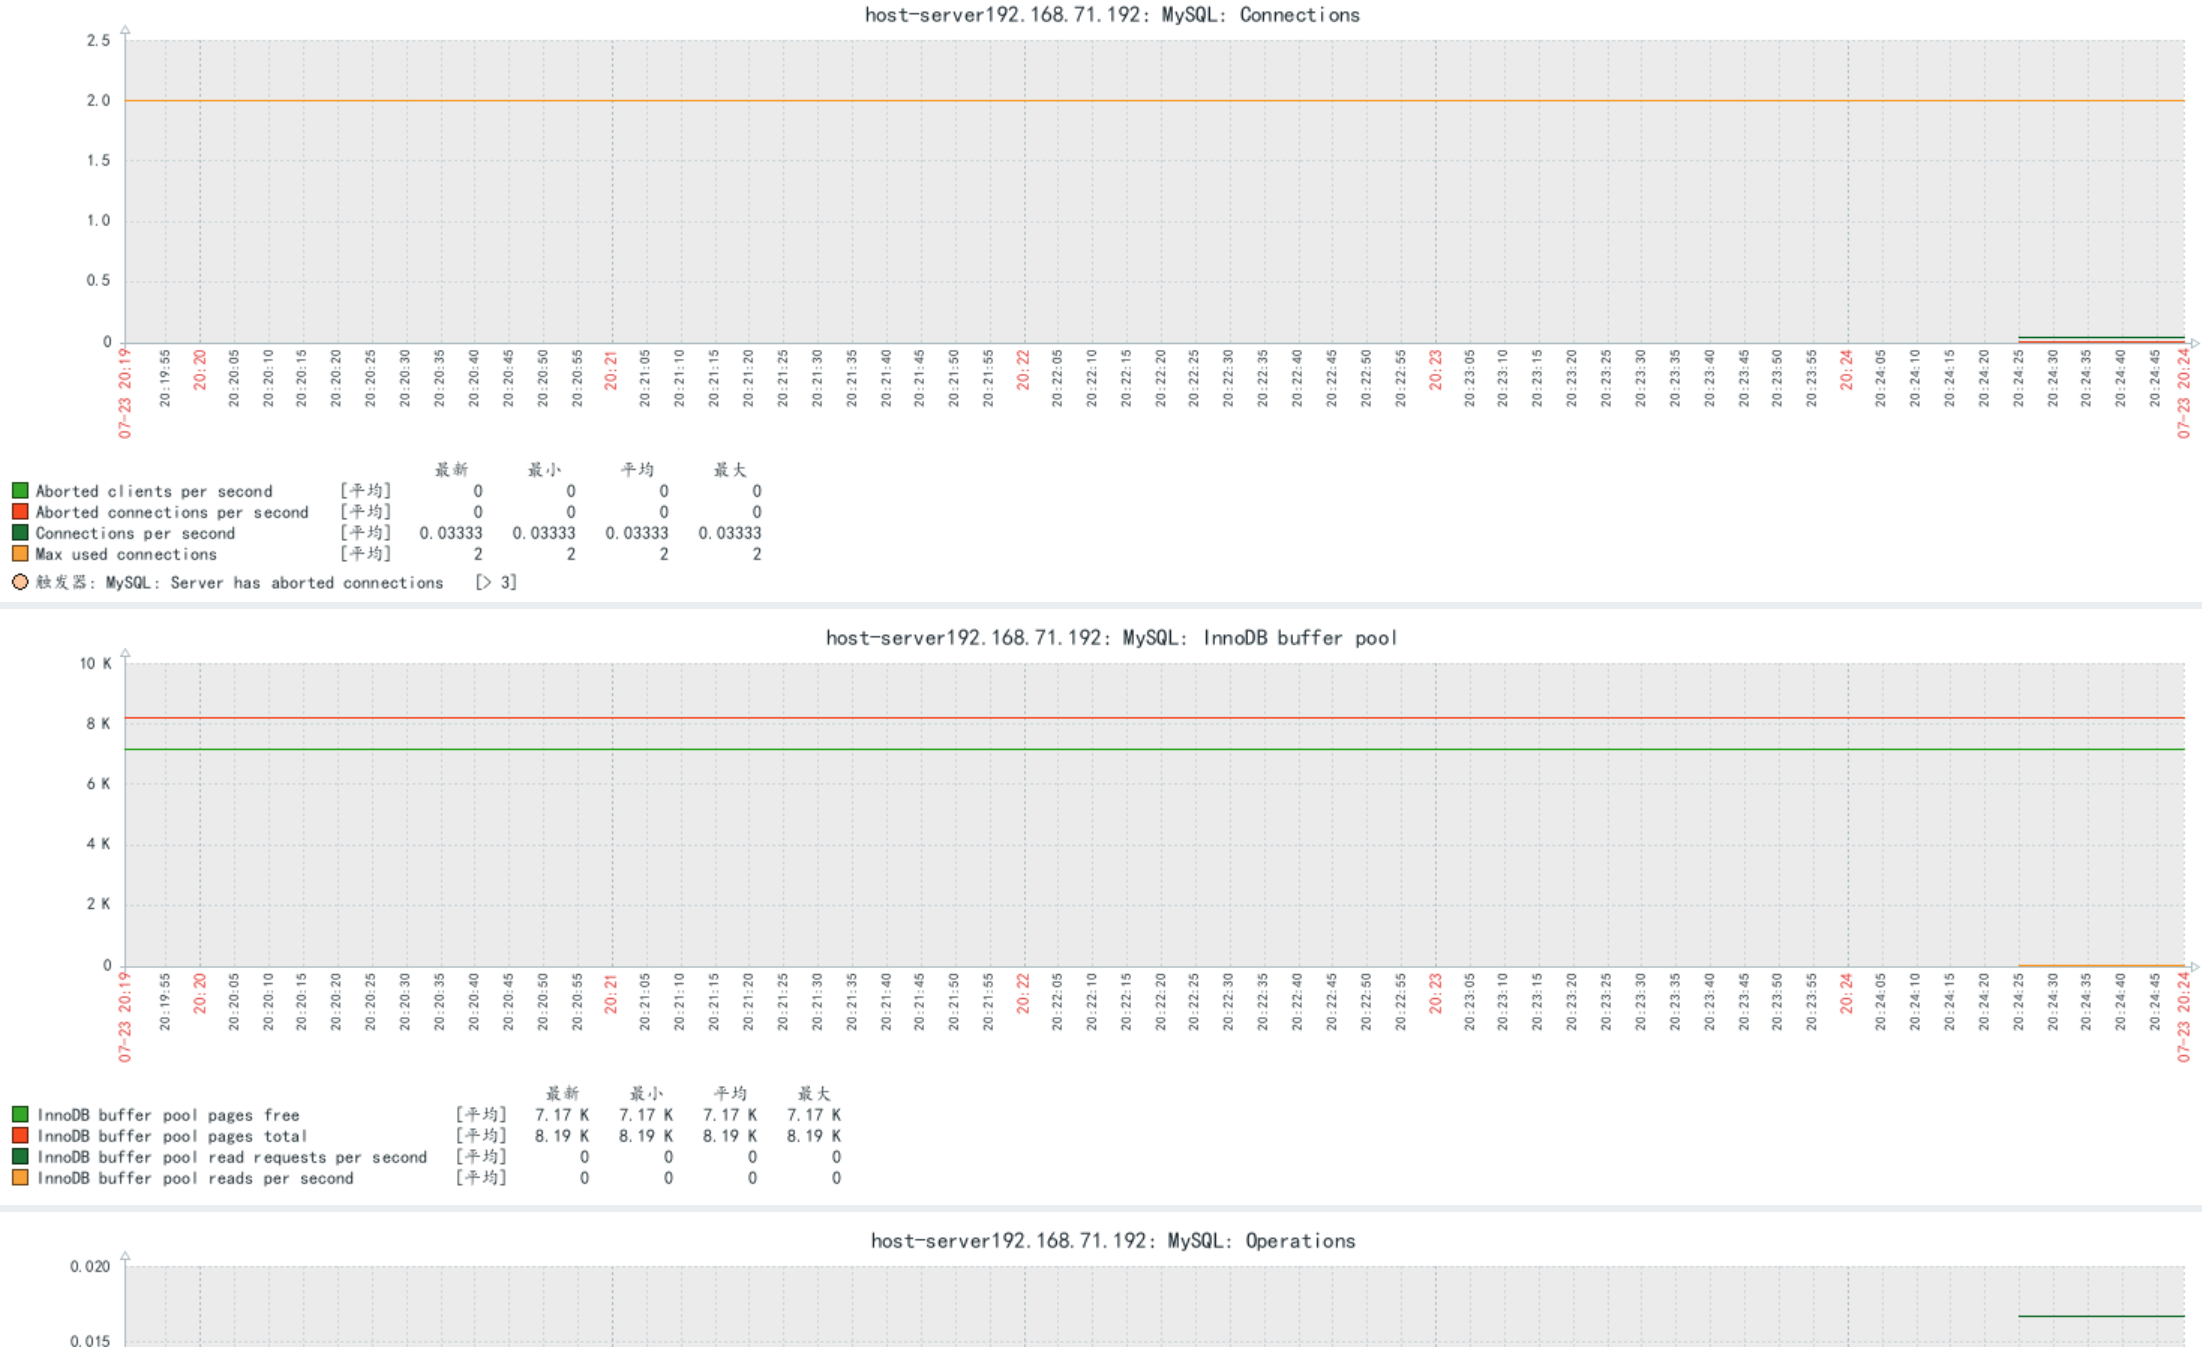
1.5、在UI界面添加监控模版
在宏界面加上mysql主机ip
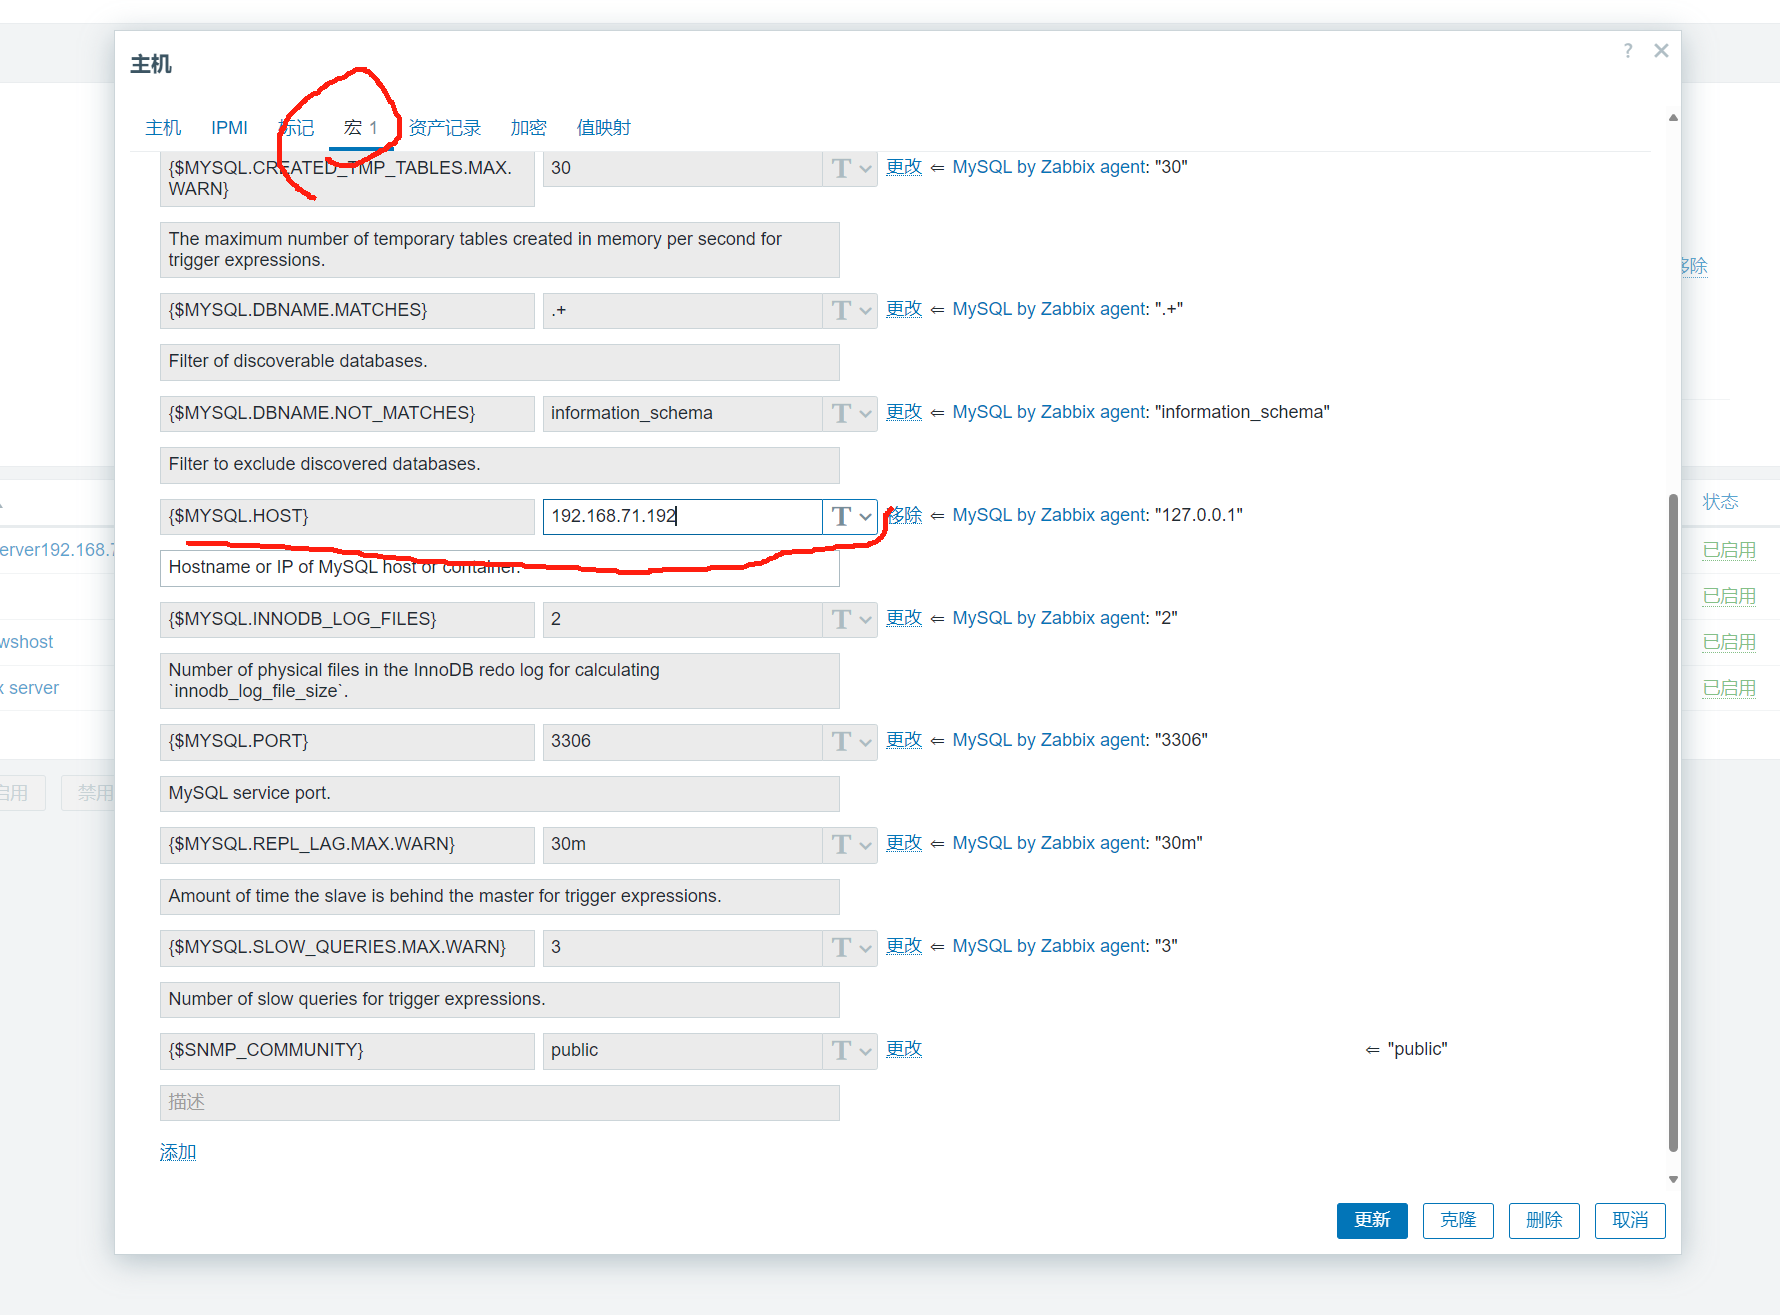
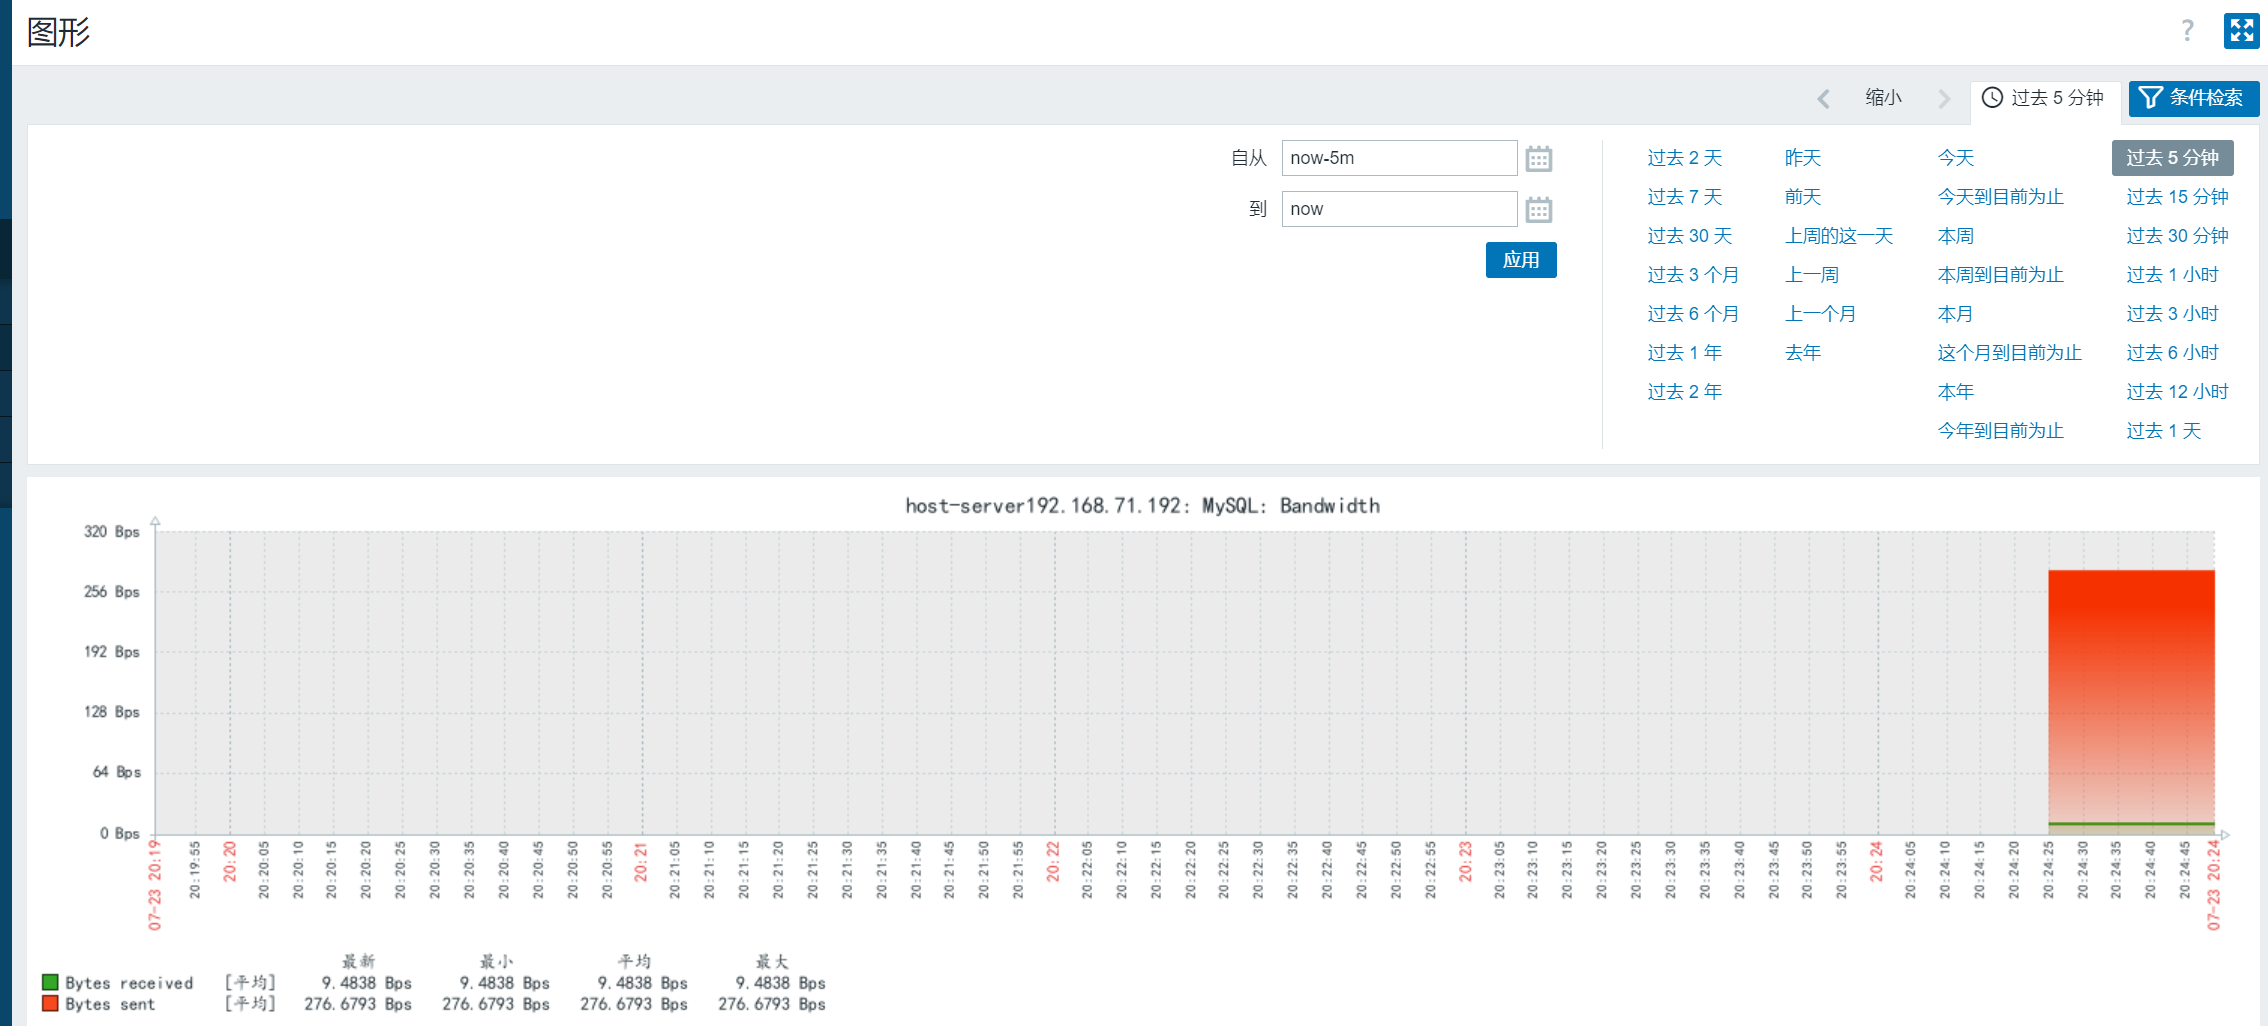
完成后去查看监控的图形(等数据输出过来)
2、Redis数据库监控
下载agent2
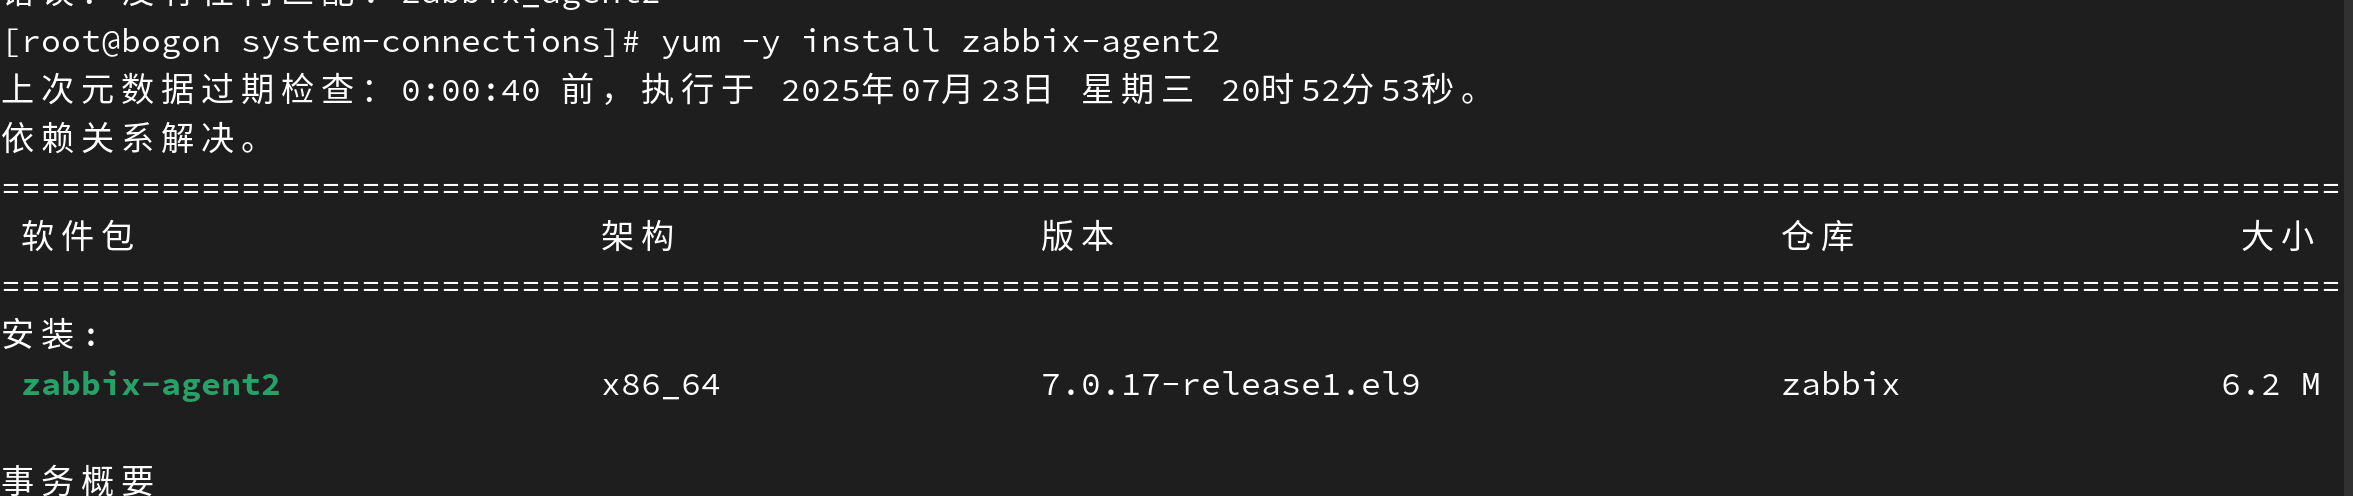
另外开一台机子,下载源(不可以既安装1又安装2)
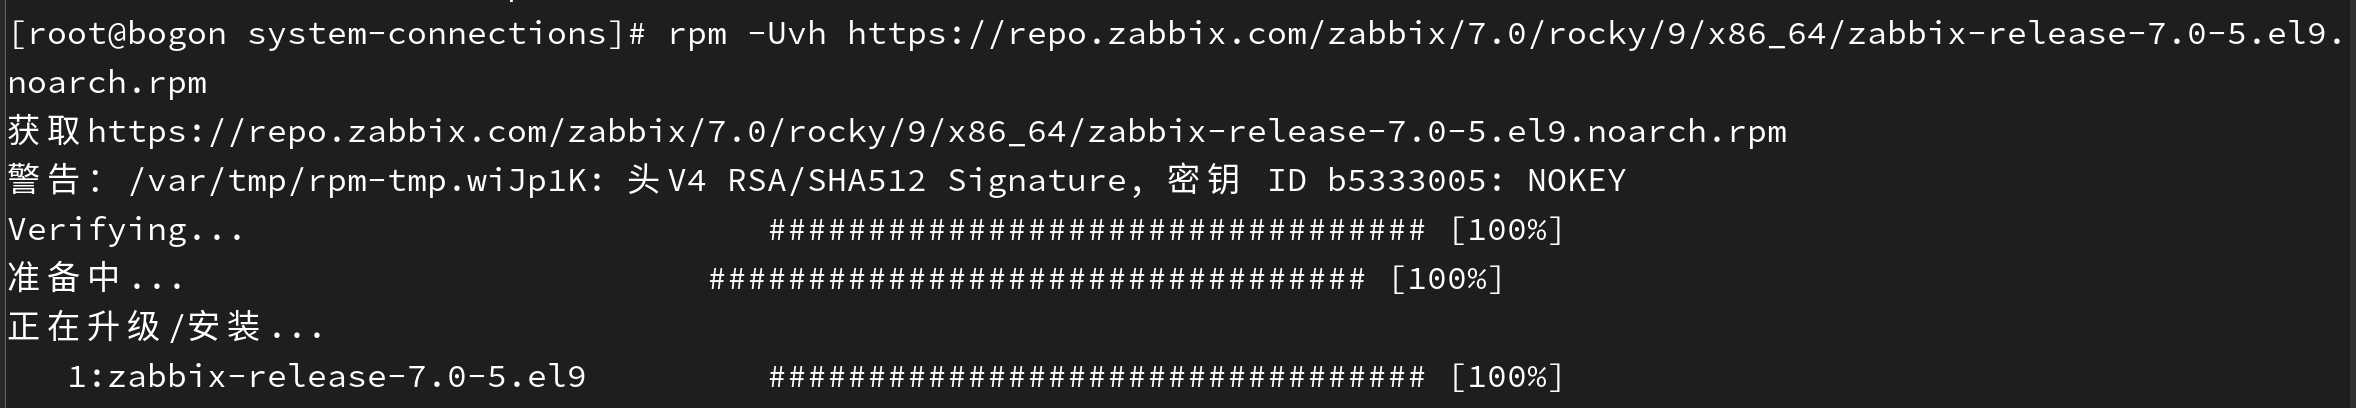
下载zabbix_agent2
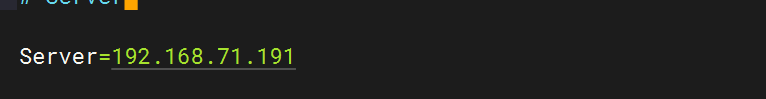
修改配置
进入配置文件/etc/zabbix/zabbix_agent2.conf修改配置

关闭防火墙等,重启服务,然后添加主机
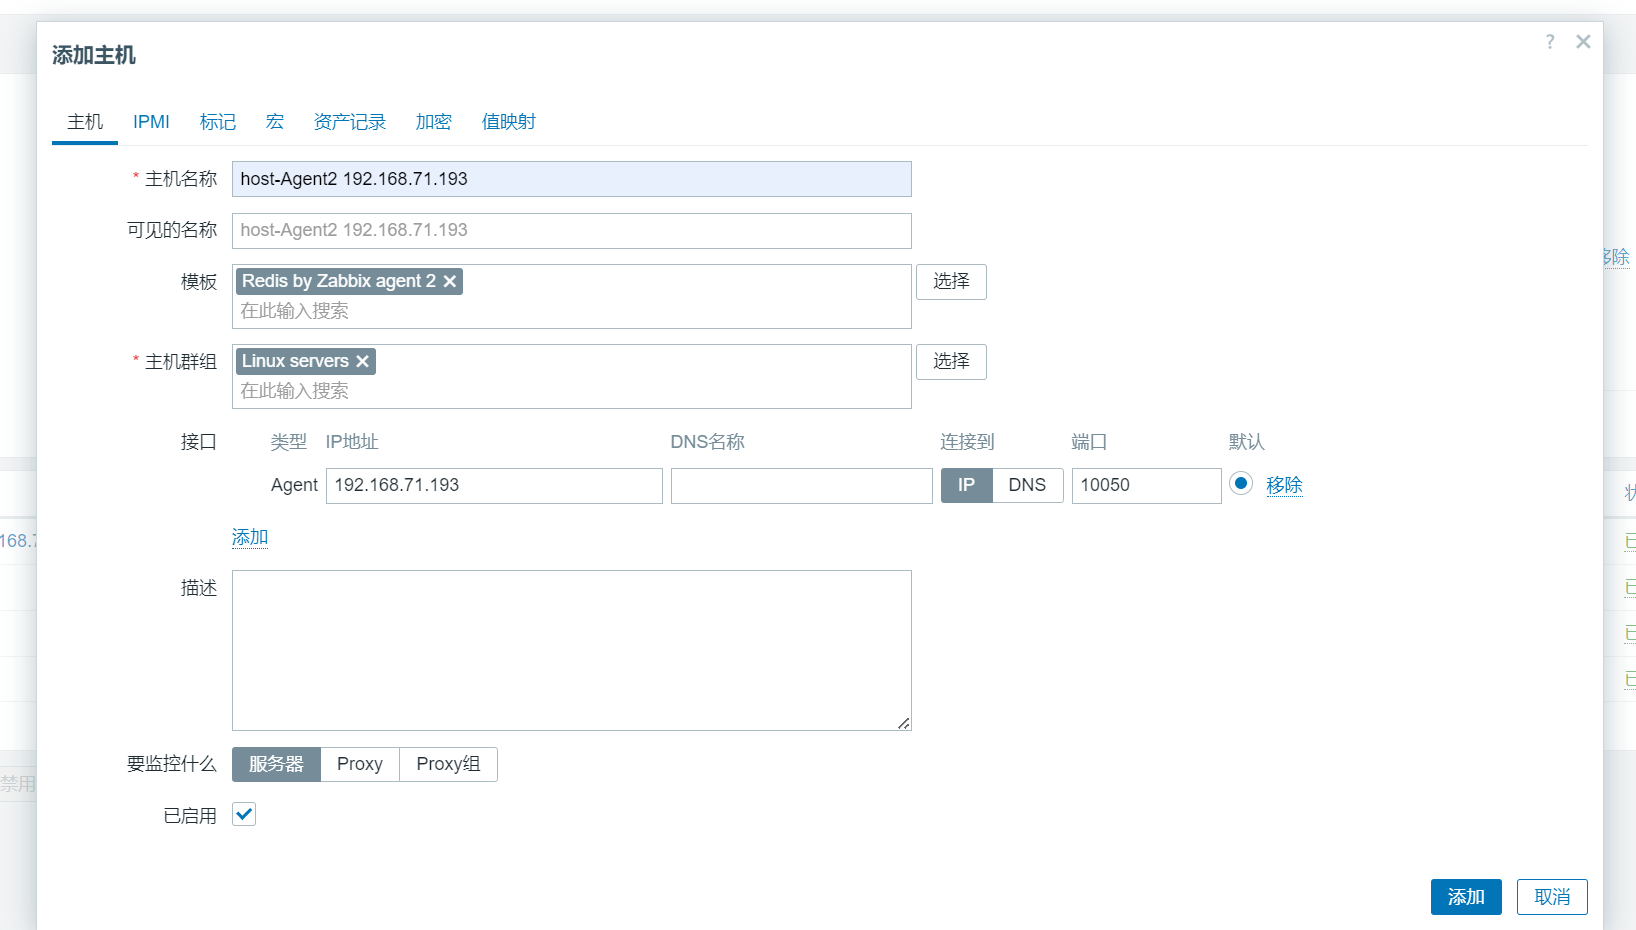
然后查看redis模板的说明
Get Redis metrics from plugin for the New Zabbix Agent (zabbix-agent2).
You can discuss this template or leave feedback on our forum https://www.zabbix.com/forum/zabbix-suggestions-and-feedback/389050-discussion-thread-for-official-zabbix-template-redis
Generated by official Zabbix template tool "Templator"
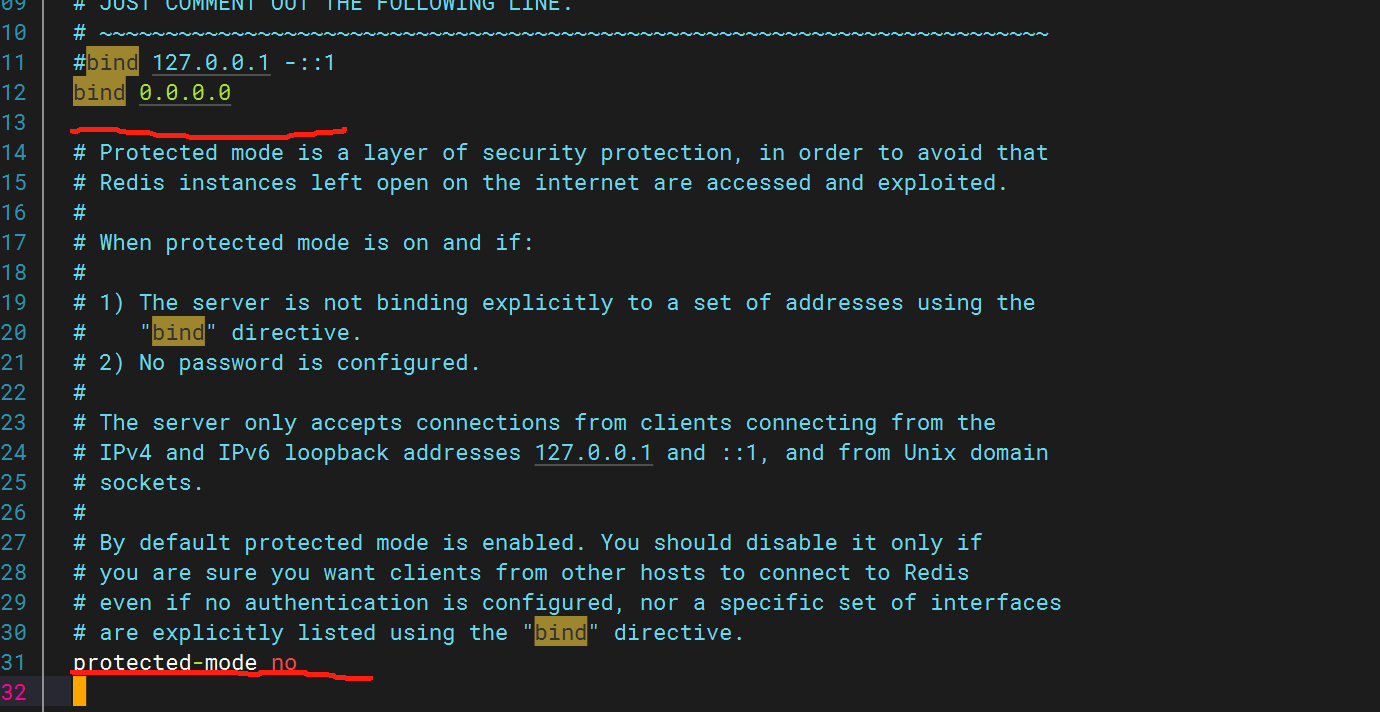
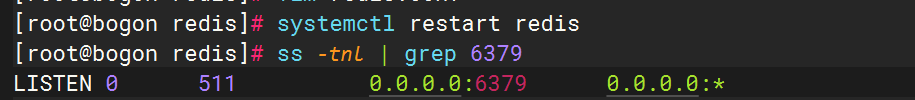
下载redis,并且修改文件配置,后开启redis
再在/etc/zabbix/zabbix_agent2.conf中加入
Plugins.Redis.Sessions.Redis1.Uri=tcp://192.168.71.193:6379Plugins.Redis.Sessions.Redis1.Password=your_password # 若Redis设置了密码,没密码不写重启zabbix-agent2服务

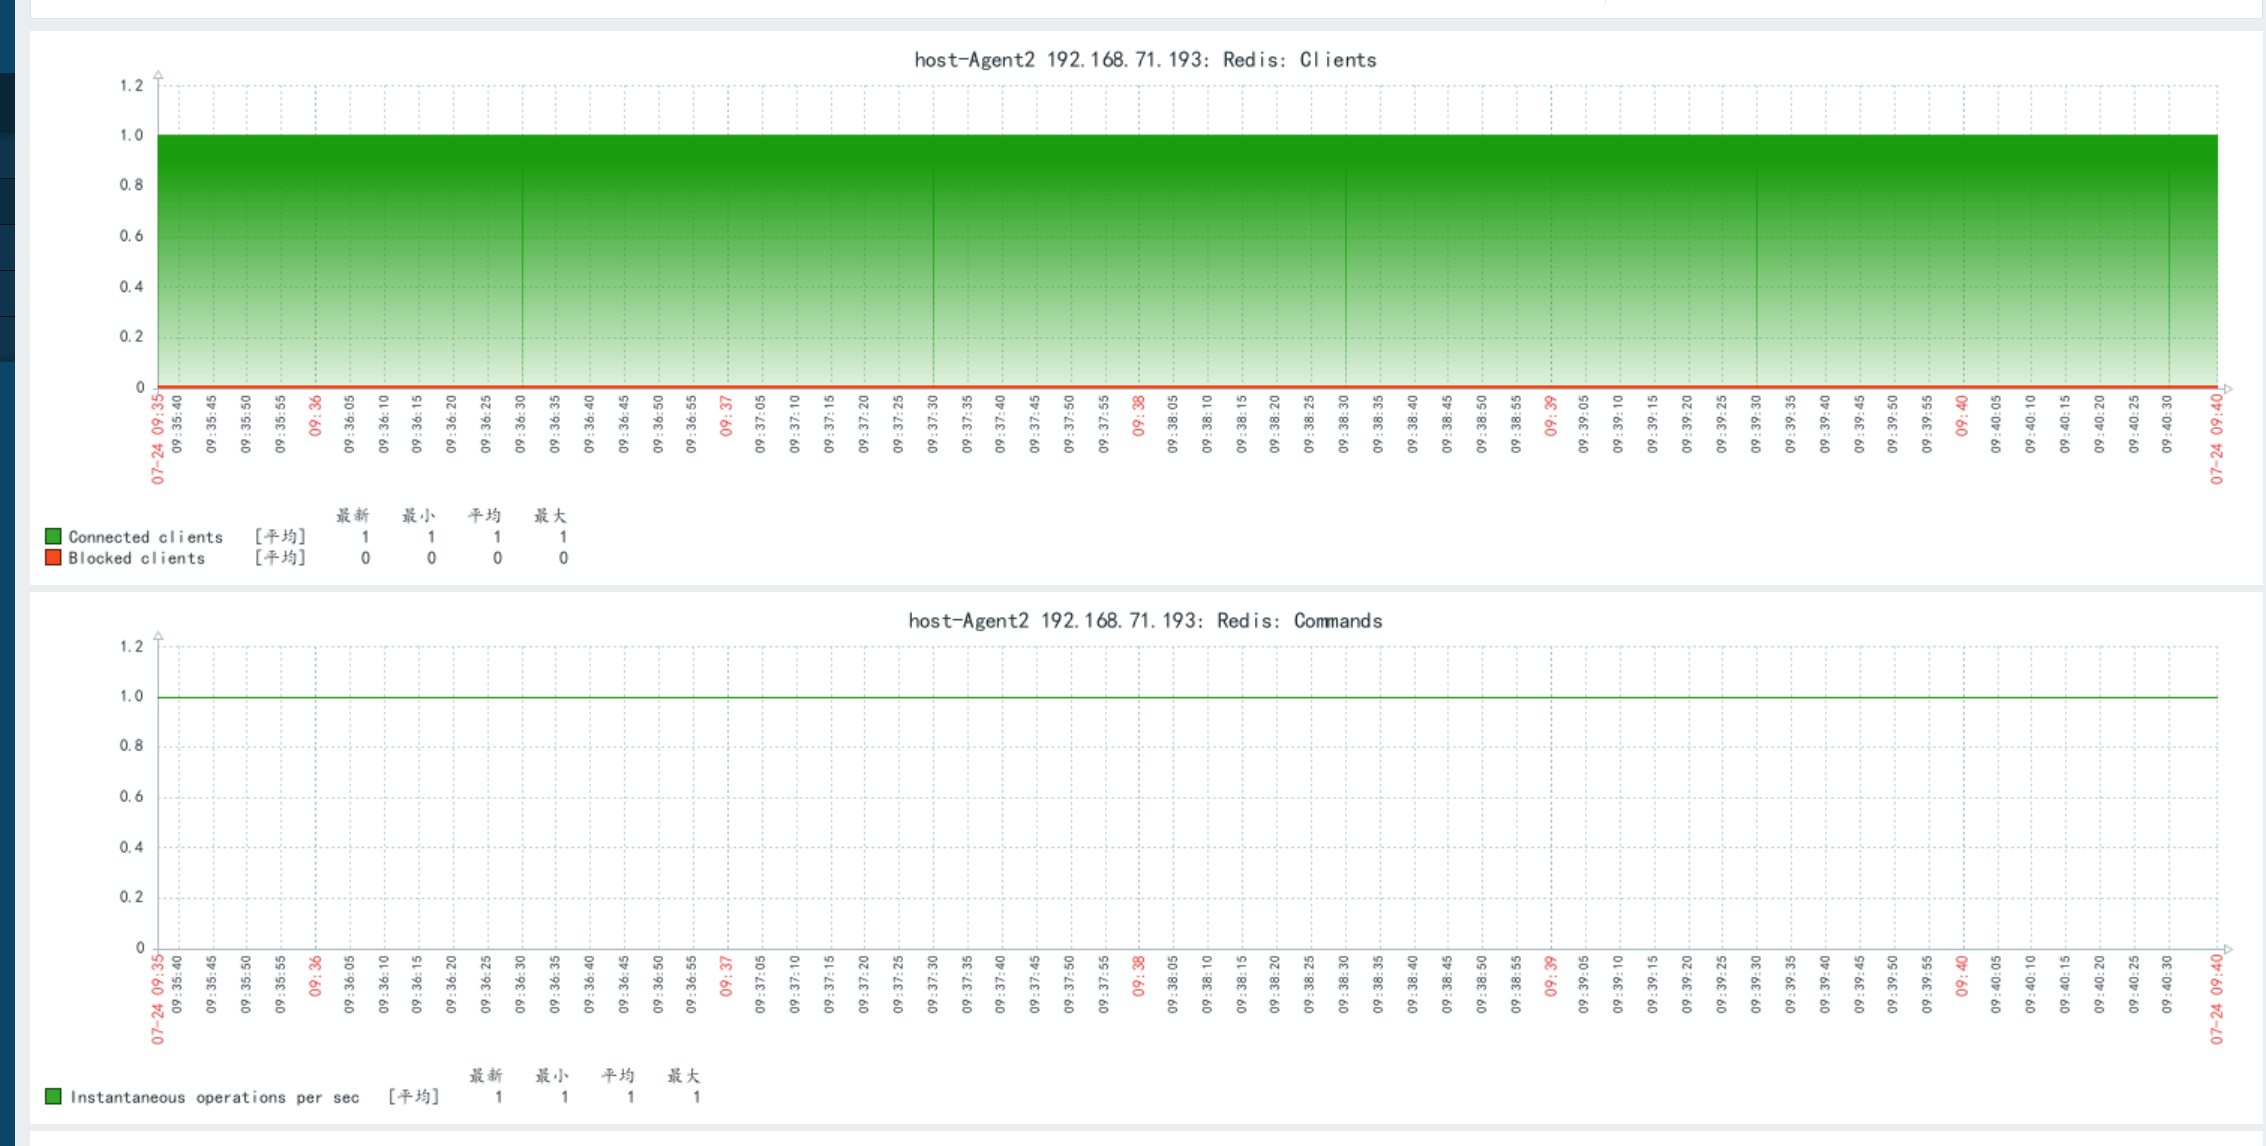
回到zabbix页面,将模板的宏ip修改为redis主机的ip
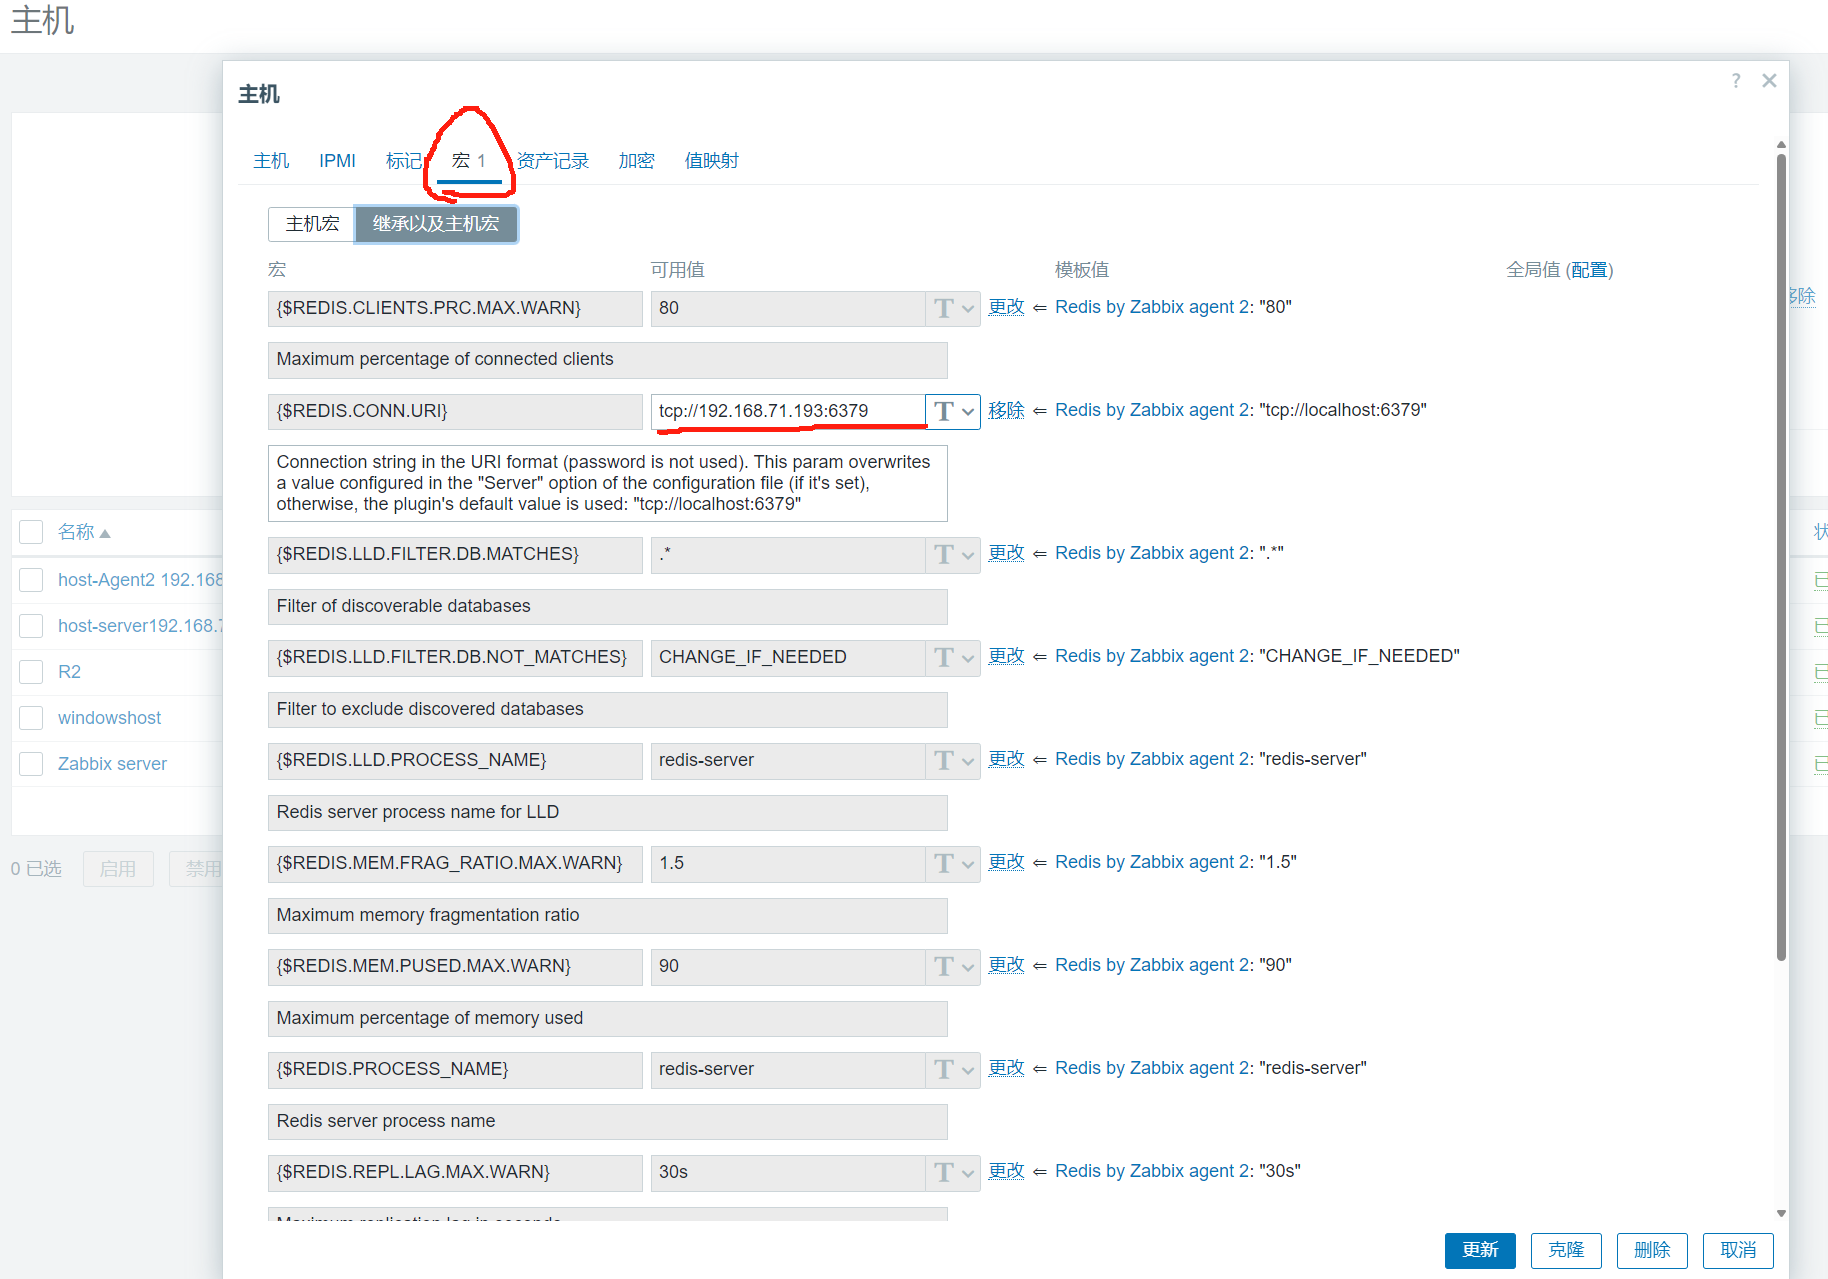
更新后,刷新数据,即可查看
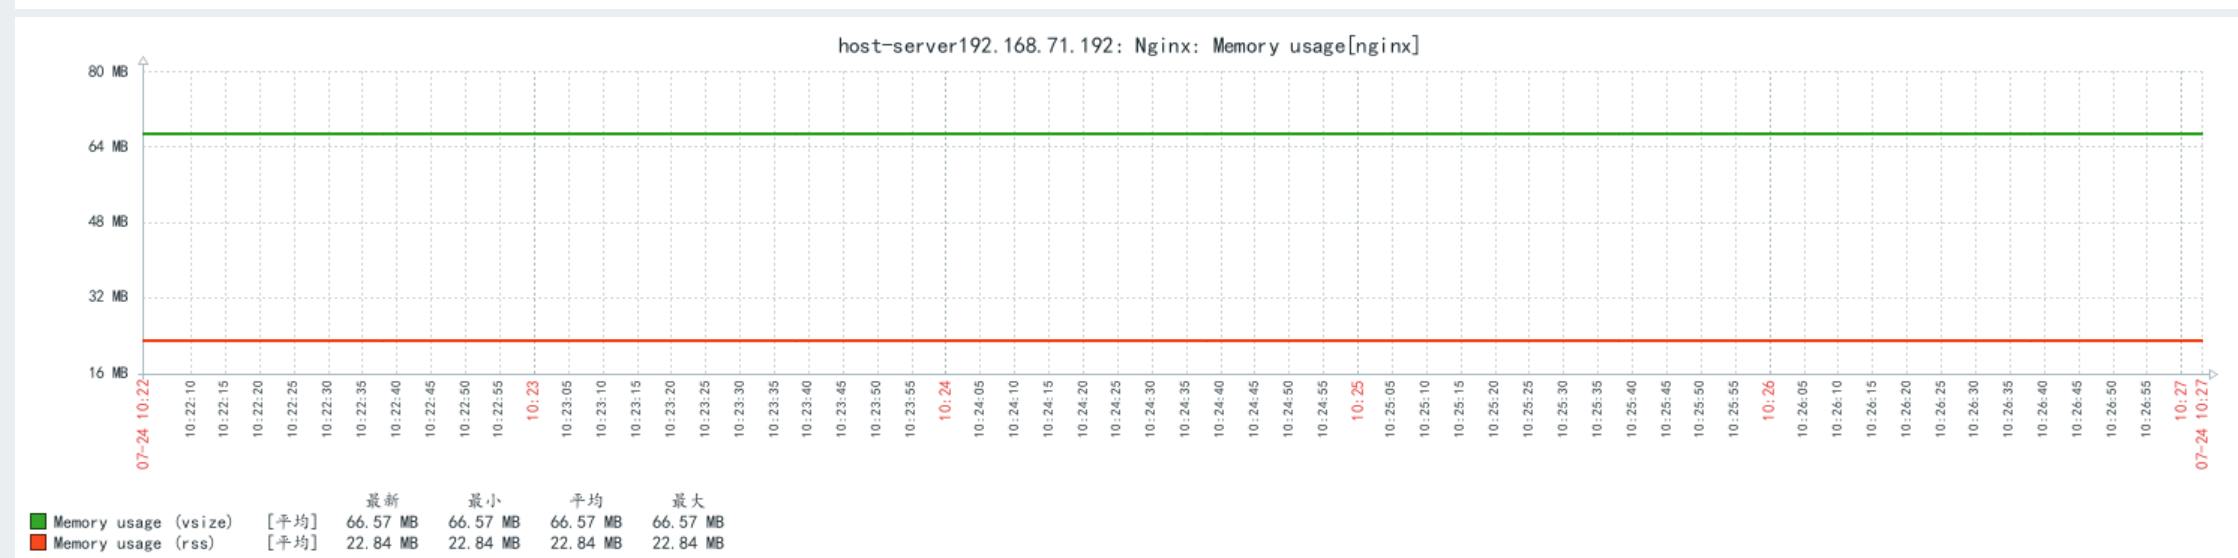
3、Nginx服务监控
修改Nginx配置文件
下载nginx,并修改配置文件/etc/nginx/conf.d/status.conf (没有就创建)
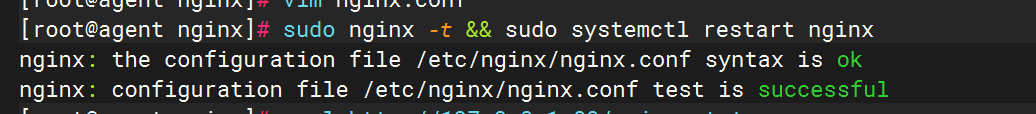
server {listen 80;server_name localhost;location /nginx_status {  # 路径可自定义(如/basic_status)stub_status on;       # 启用状态模块access_log off;       # 关闭日志allow 127.0.0.1;      # 允许本地访问(Zabbix Agent需访问)deny all;             # 禁止其他IP}
}
重启Nginx生效配置
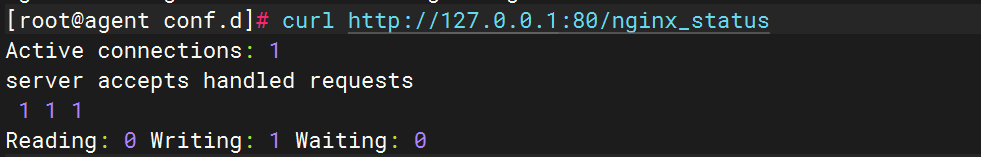
验证状态页是否正常
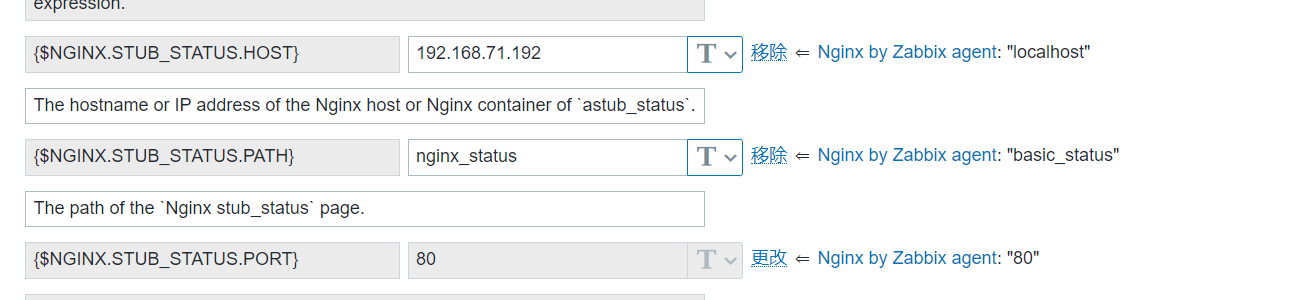
配置Zabbix Agent
在配置文件最下方加入
UserParameter=nginx.status[*],curl -s http://127.0.0.1:80/nginx_status然后添加模板并且增加宏

然后查看数据
4、MySQL主从监控
配置主从配置
主库配置(192.168.71.192)
重启服务后,创建一个复制账户
-- 创建复制账号(从库使用)
CREATE USER 'repl'@'192.168.71.193' IDENTIFIED BY 'YourPassword';
GRANT REPLICATION SLAVE ON *.* TO 'repl'@'192.168.71.193';
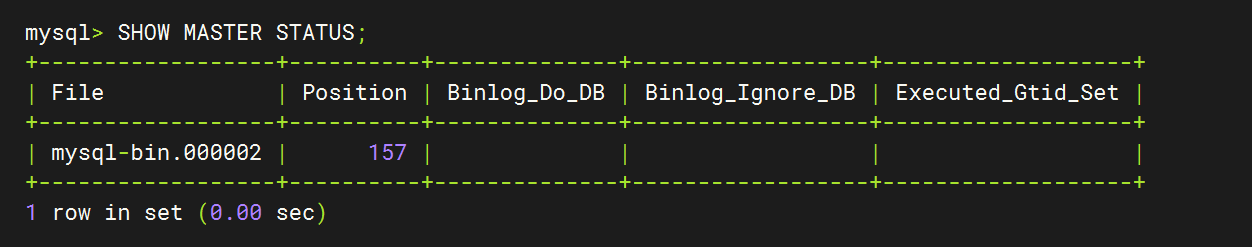
FLUSH PRIVILEGES;-- 查看主库状态(记录File和Position)
SHOW MASTER STATUS;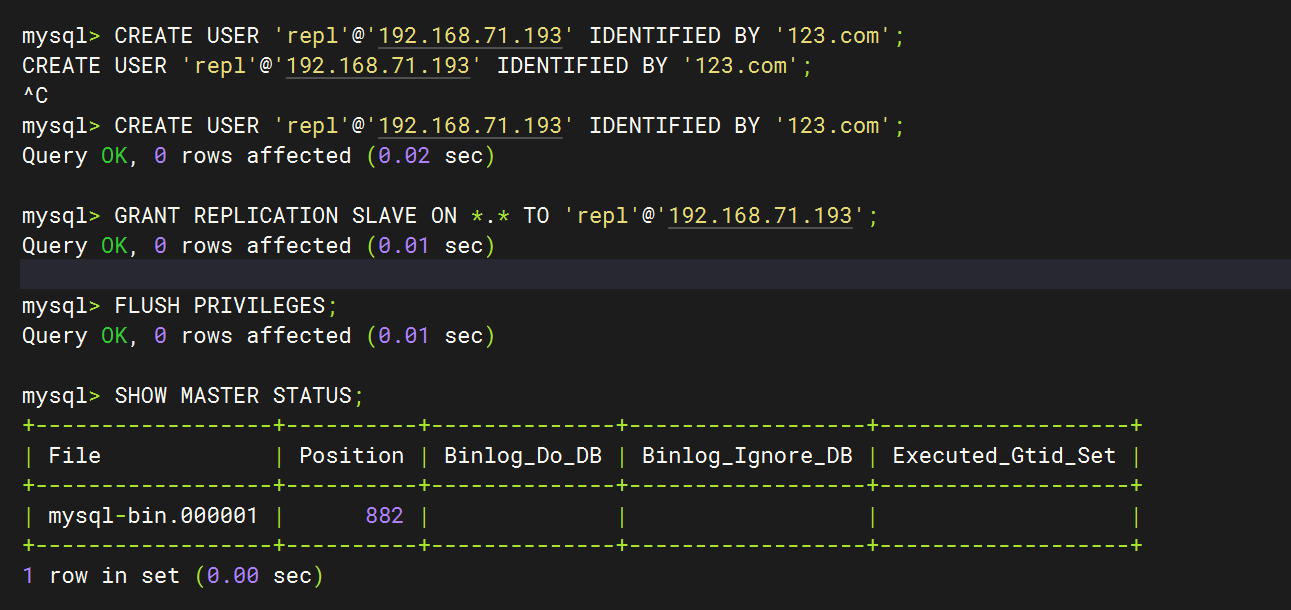
从库配置(192.168.71.193)
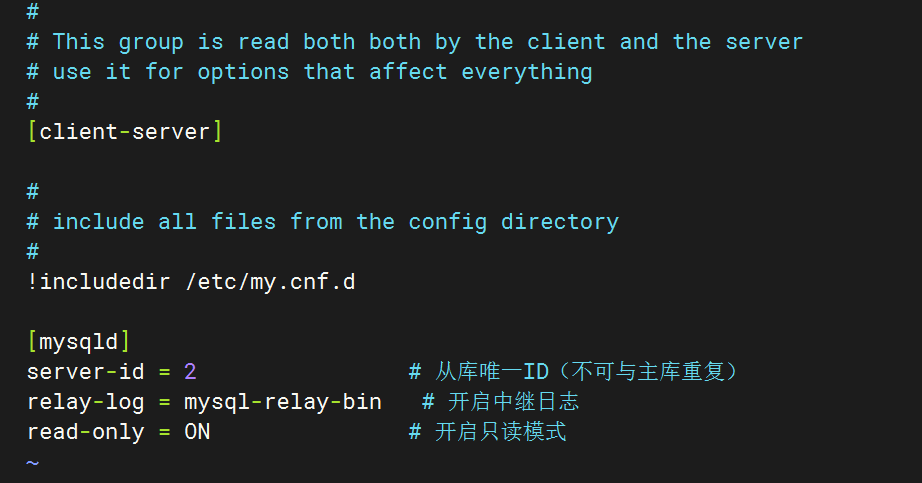
增加主库信息
-- 配置主库连接信息
CHANGE MASTER TOMASTER_HOST = '192.168.71.192',MASTER_USER = 'repl',MASTER_PASSWORD = 'YourPassword',MASTER_LOG_FILE = 'mysql-bin.000001', -- 替换为主库记录的FileMASTER_LOG_POS = 154; -- 替换为主库记录的Position-- 启动复制
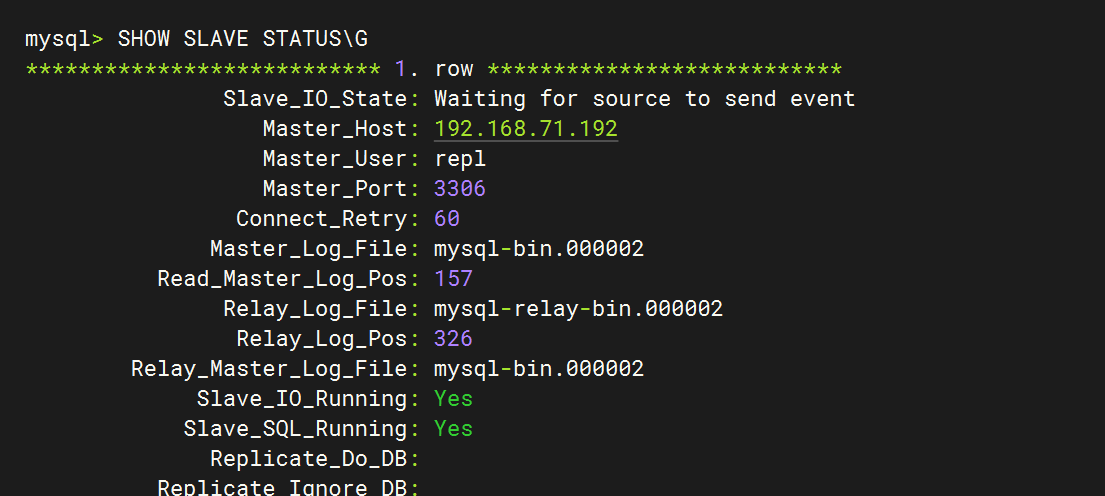
START SLAVE;-- 检查复制状态
SHOW SLAVE STATUS\G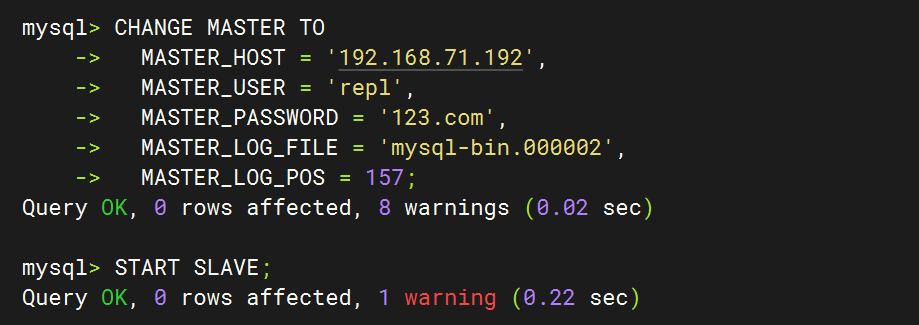
在被监控端创建监控脚本
#!/bin/bash
# 获取主从状态并返回"Yes"的数量(正常值为2)
mysql  -e "SHOW SLAVE STATUS\G" 2>/dev/null \| grep -E "Slave_IO_Running|Slave_SQL_Running" \| grep -c "Yes"
# 赋予执行权限
sudo chmod +x /etc/zabbix/zabbix_agent2.d/mysql_slave_status.sh配置Zabbix Agent2
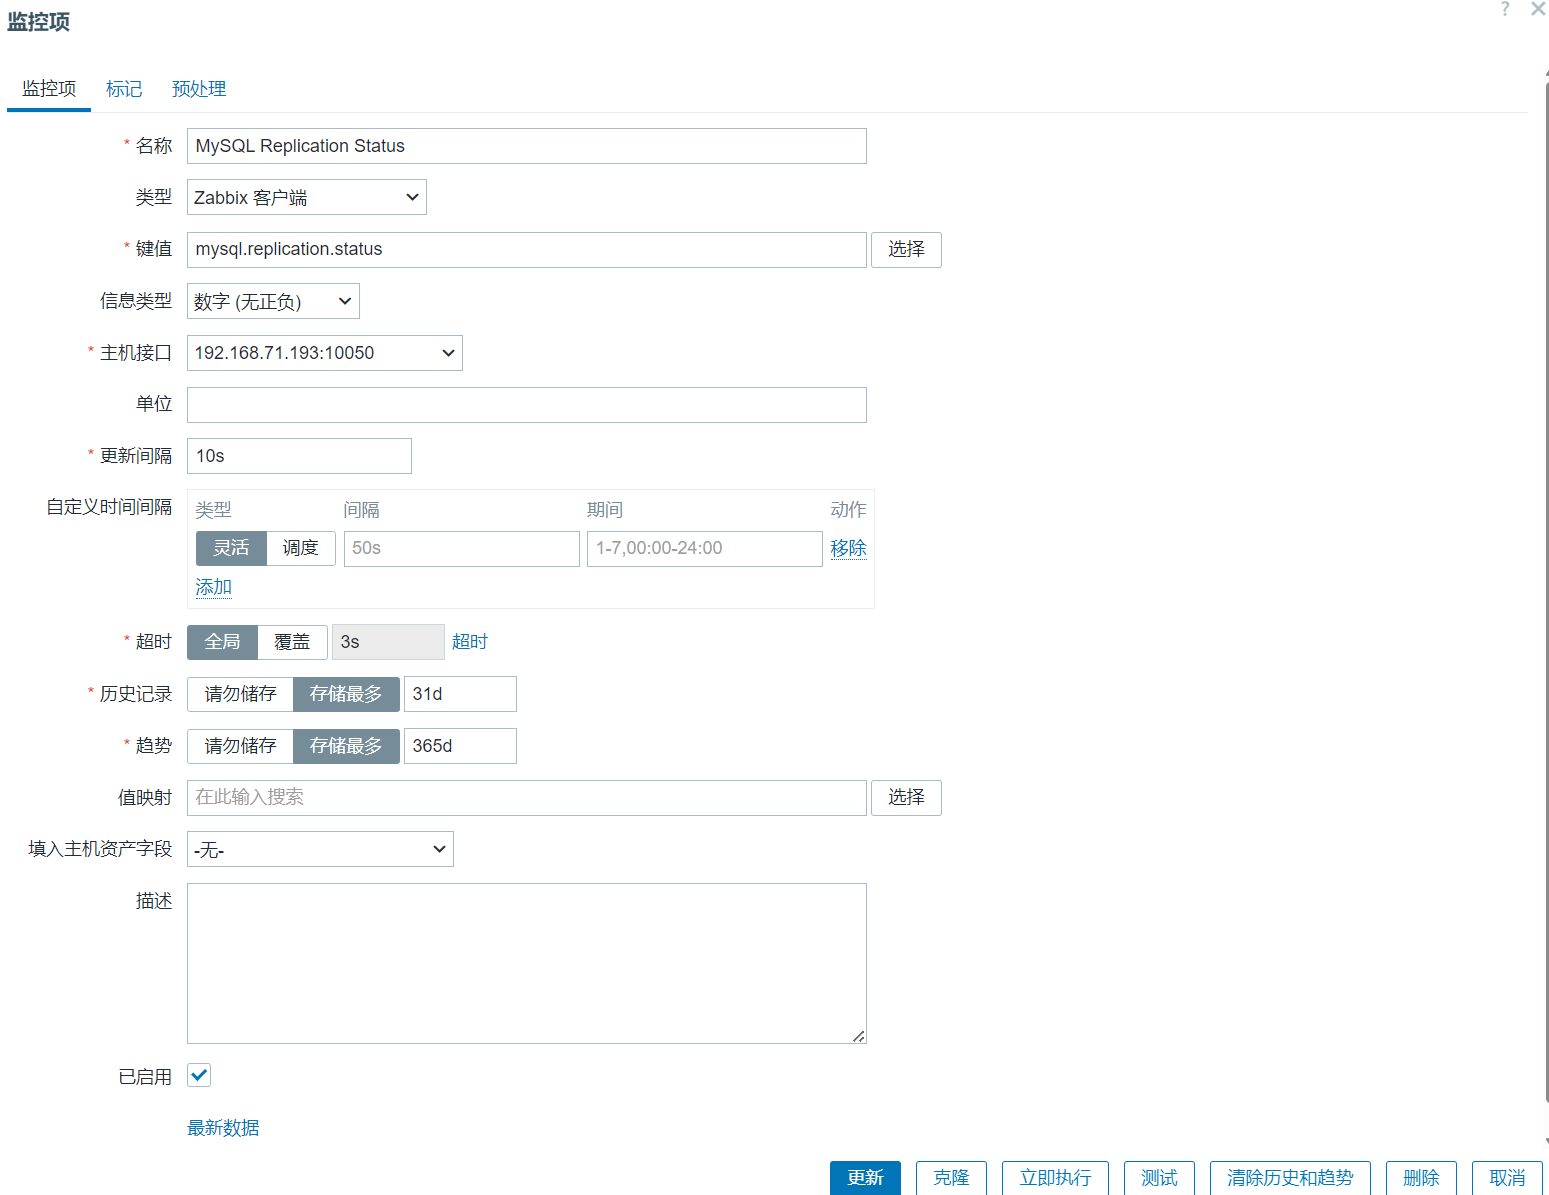
sudo vi /etc/zabbix/zabbix_agent2.conf# 启用自定义Key
UserParameter=mysql.replication.status, /etc/zabbix/zabbix_agent2.d/mysql_slave_status.sh# 重启Agent
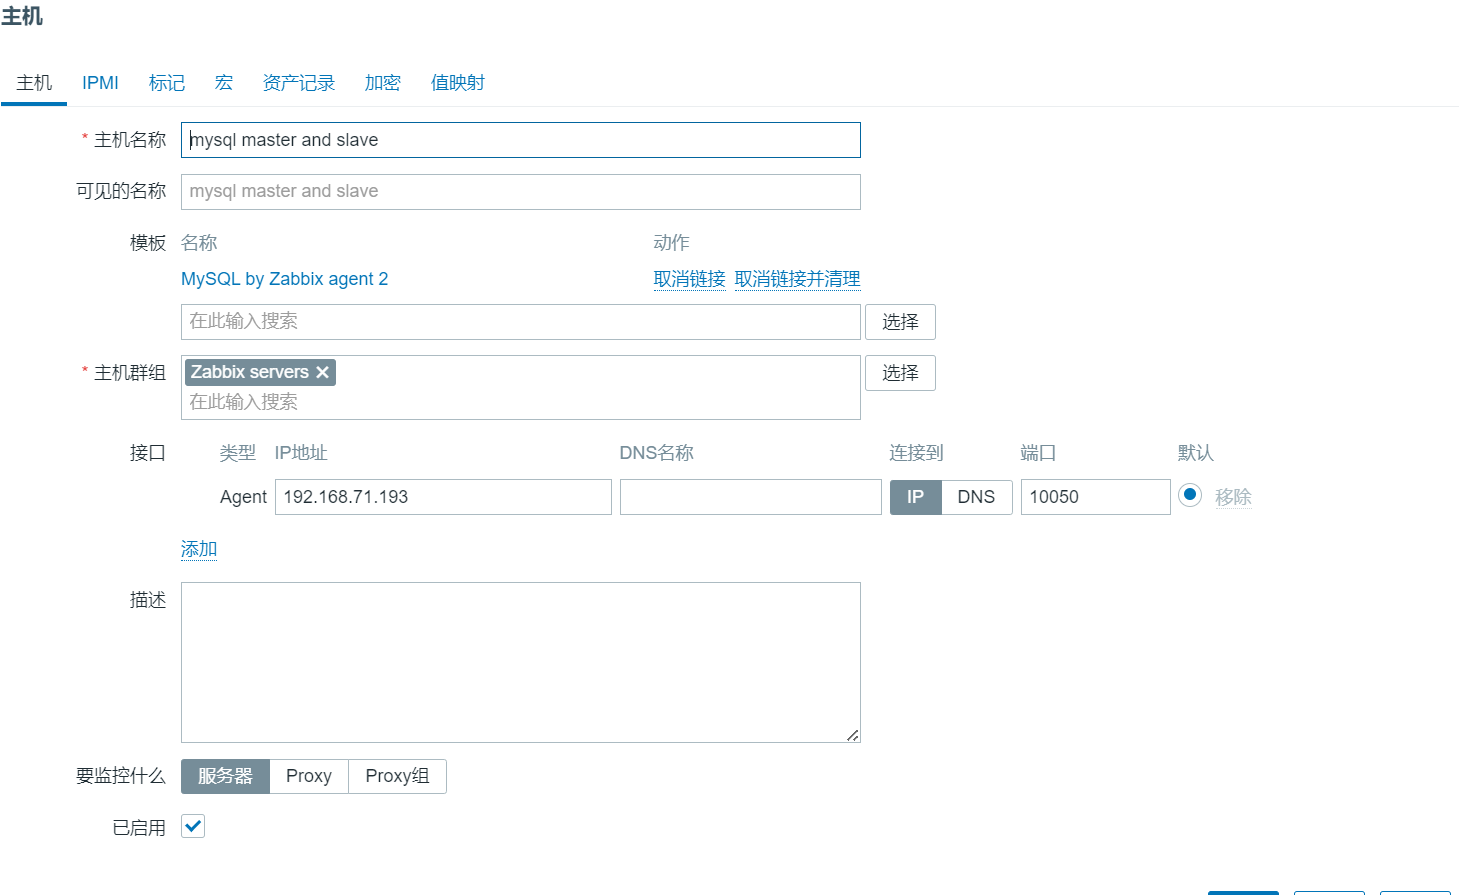
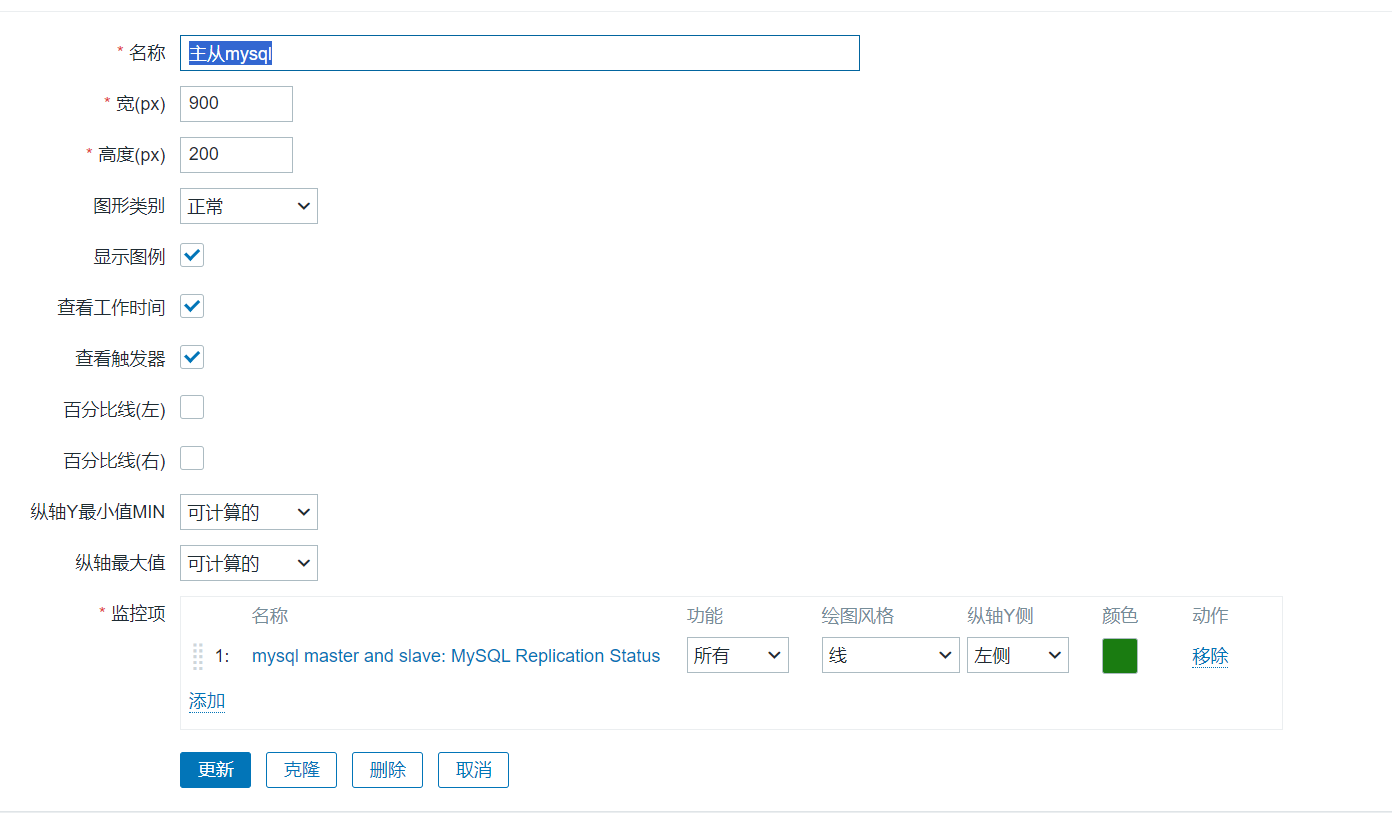
sudo systemctl restart zabbix-agent2选择模板,并创建监控项,添加图形
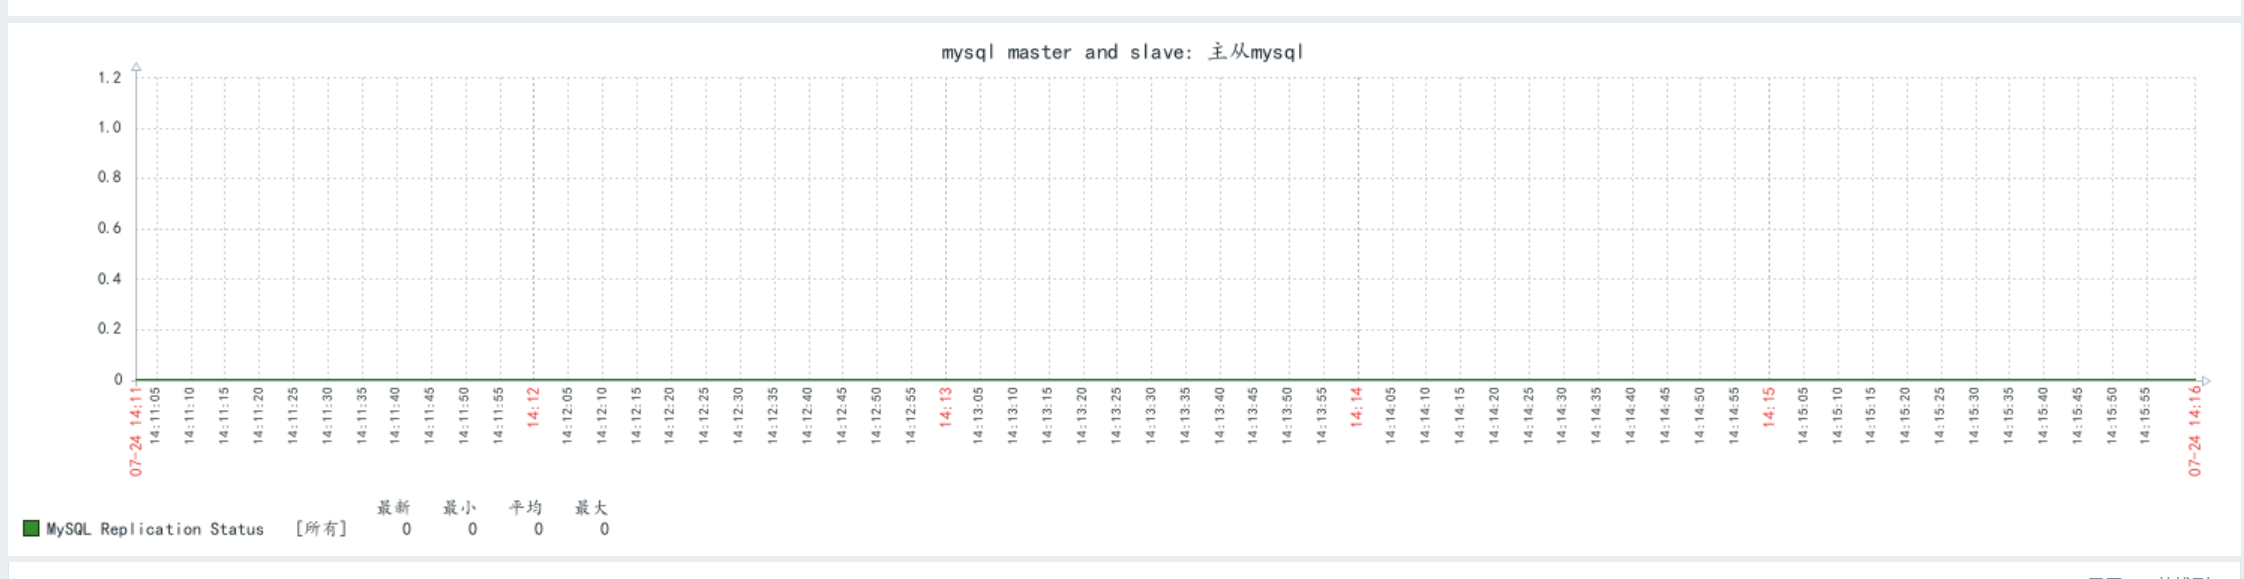
运行脚本测试

得到图像结果应为2,但是却是0,正常来说是2就对了
5、Redis集群监控
交给大家去研究


)


:信号量sem)


)

)

)


