Title
题目
DeepSPV: A deep learning pipeline for 3D spleen volume estimation from 2Dultrasound images
DeepSPV:一种从2D超声图像中估算3D脾脏体积的深度学习流程
01
文献速递介绍
1.1 临床背景 脾肿大指脾脏增大,是多种潜在疾病的重要临床指标,例如镰状细胞病(SCD)(Inusa等人,2016)。在患有镰状细胞病的儿科患者中,脾肿大可能伴随急性脾隔离症——过多的血细胞被困在脾脏中,导致循环血容量和血红蛋白显著下降(Brousse等人,2014)。若不及时干预,这种情况可能危及生命。其他临床疾病,如癌症(McCormick和Murphy,2000)、血液疾病(Pozo等人,2009)和感染(Mahmoud和Woodruff,1972)也可能导致脾肿大。因此,在镰状细胞病及其他相关疾病中,脾脏大小的测量常作为确定患者治疗方案的辅助依据。这就需要准确测量脾脏大小并识别脾肿大的方法。 ### 1.2 挑战 在临床环境中,检测脾肿大的常见初步方法是手动触诊。如果能在左肋下缘触及脾脏,则怀疑其肿大。虽然手动触诊结果曾被视为脾肿大的证据(Schloesser,1963),但后续研究表明,高达16%的可触及脾脏经放射学评估后显示大小正常(Arkles等人,1986)。此外,手动触诊较为粗略、无法量化,仅能作为是否需要进一步影像学检查的初步判断。 超声(US)是检测脾肿大最常用的成像方式,通常在临床检查中紧随手动触诊之后进行。它在大多数临床环境中普及性高,且具有无创、便携的特点。脾脏长度可通过2D冠状位超声图像测量,因其与脾脏体积相关性较好(Lamb等人,2002),常被用作表征脾脏整体大小的指标(Pozo等人,2009)。然而,尽管存在这种相关性,脾脏长度仍只是一种替代测量方式,而脾脏体积仍是评估脾脏大小的金标准。此外,除了判断脾肿大外,脾脏体积在确定相关疾病的严重程度和指导治疗方案方面也是更优的指标(Kotlyar等人,2014;Koga等人,2016;Khoshpouri等人,2018)。 计算机断层扫描(CT)和磁共振成像(MRI)等3D成像模态被认为是脾脏体积测量的金标准方法(Yetter等人,2003;Holmström等人,2022;Paul等人,2017)。基于CT或MRI检查,可通过手动分割脾脏计算体积,但这种方法极其耗时。更常用的方式是根据手动测量的脾脏尺寸,使用Prassopoulos等人(1997)提出的线性回归公式估算体积。基于深度学习的框架也已被用于从3D CT和MRI中分割脾脏(Ahn等人,2020;Moon等人,2019;Humpire-Mamani等人,2020;Altini等人,2022;Meddeb等人,2021;Huo等人,2018),这也为脾脏体积测量提供了便利。尽管如此,CT涉及电离辐射,因此在世界许多地区可能不会用于脾脏大小估算;而MRI图像则常因运动伪影问题难以获得可靠结果。此外,由于3D成像设备成本高昂且安装维护复杂,在镰状细胞病相关脾肿大高发地区(如全球南部),其可及性较低(Piel等人,2013;Grosse等人,2011)。 3D超声成像是一种潜在的替代方案,可直接提供体积测量。然而,尽管3D超声已成功应用于浅表和静态解剖结构(如下肢肌肉)(Al Chanti等人,2021;Huet等人,2024),但获取整个脾脏的高质量3D超声图像仍面临挑战。这主要是由于肋骨的遮挡,以及膈肌或胃/肠道内气体的干扰,导致图像质量下降。此外,由于声学窗口有限,有时无法在单视角下完整成像整个脾脏。在肝脏等大型器官的3D超声成像中也存在类似挑战(Treece等人,2001)。3D超声也可通过扫查2D超声图像或自由手2D超声图像的合成来实现。传统重建方法包括依赖外部跟踪系统的基于传感器的方法(Rohling等人,1999;Daoud等人,2015;Wen等人,2013),以及无传感器方法(如Gee等人,2006)。深度学习的最新进展进一步推动了自由手2D超声重建,实现了端到端的训练和推理(如Luo等人,2023;Yeung等人,2024;Gaits等人,2024)。然而,由于呼吸或整体运动可能导致伪影,且受上述3D超声采集的限制因素影响,获取多个(超过两个)不同角度的2D超声图像进行后续3D重建仍具挑战。这些限制使得收集一系列质量一致的2D超声图像以进行可靠3D重建变得不切实际。 鉴于这些限制,2D超声成像仍是当前脾脏评估临床工作流程中的标准模态(Lamb等人,2002)。尽管3D超声和基于2D超声的3D重建尚不实用,但可基于冠状位和横断位2D超声的测量结果,使用线性回归公式(包括标准椭球体公式(De Odorico等人,1999;Chow等人,2016)或其修改版本(Yetter等人,2003))估算脾脏体积。这些方法已应用于临床实践,但其准确性和稳健性在很大程度上依赖于观察者的经验。此外,在镰状细胞病高发的低收入和中等收入国家,这类专业知识往往匮乏。因此,从2D超声图像中测量脾脏长度仍是最广泛采用的脾脏大小评估方法,而脾脏体积作为生物标志物的临床价值仍有待深入研究。 ### 1.3 研究动机与贡献 鉴于CT、MRI和3D超声存在的挑战,我们的总体目标是开发一种可直接从标准临床视角的2D超声图像中估算脾脏体积的流程,以契合当前脾脏大小检查的临床工作流程。这里的“标准临床视角”指超声检查中通常采集的冠状位和横断位视图。 我们提出了DeepSPV,这是一种基于深度学习的新型流程,用于从单视角(冠状位)或双视角(冠状位和横断位)2D超声图像中精确估算脾脏体积。该流程包括两部分:首先,从2D超声图像中自动分割脾脏;其次,根据分割结果估算体积。我们使用由超声语义扩散模型(USDM)从CT图像(带有真实脾脏体积)生成的高真实感合成超声图像数据集,在单视角条件下成功评估了整个流程。据我们所知,这是首个使用深度学习从2D超声图像中估算脾脏体积的研究。本研究的主要贡献可总结为: 1. 提出了一种基于变分自编码器(VAE)的新型框架,可从单张或两张2D脾脏分割结果中自动估算3D脾脏体积。 2. 在该框架内提出并评估了三种不同的体积估算方法。 3. 除体积估算外,我们的框架还能估算置信区间,并提供一定程度的可解释性,以支持实际临床场景中的决策。 4. 生成并公开了一个带有真实脾脏体积的高真实感合成超声图像数据库。 5. 利用该数据库,在单视角条件下成功评估了整个流程,其体积估算精度超过了使用相同数据的人类专家。
Abatract
摘要
Splenomegaly, the enlargement of the spleen, is an important clinical indicator for various associated medicalconditions, such as sickle cell disease (SCD). Spleen length measured from 2D ultrasound is the most widelyused metric for characterising spleen size. However, it is still considered a surrogate measure, and spleenvolume remains the gold standard for assessing spleen size. Accurate spleen volume measurement typicallyrequires 3D imaging modalities, such as computed tomography or magnetic resonance imaging, but these arenot widely available, especially in the Global South which has a high prevalence of SCD. In this work, weintroduce a deep learning pipeline, DeepSPV, for precise spleen volume estimation from single or dual 2Dultrasound images. The pipeline involves a segmentation network and a variational autoencoder for learninglow-dimensional representations from the estimated segmentations. We investigate three approaches for spleenvolume estimation and our best model achieves 86.62%/92.5% mean relative volume accuracy (MRVA) undersingle-view/dual-view settings, surpassing the performance of human experts. In addition, the pipeline canprovide confidence intervals for the volume estimates as well as offering benefits in terms of interpretability,which further support clinicians in decision-making when identifying splenomegaly. We evaluate the fullpipeline using a highly realistic synthetic dataset generated by a diffusion model, achieving an overall MRVAof 83.0% from a single 2D ultrasound image. Our proposed DeepSPV is the first work to use deep learning toestimate 3D spleen volume from 2D ultrasound images and can be seamlessly integrated into the current clinicalworkflow for spleen assessment. We also make our synthetic spleen ultrasound dataset publicly available.
脾肿大(脾脏增大)是多种相关疾病的重要临床指标,例如镰状细胞病(SCD)。通过2D超声测量的脾脏长度是表征脾脏大小最常用的指标。然而,这仍被视为一种替代测量方式,而脾脏体积仍是评估脾脏大小的金标准。准确的脾脏体积测量通常需要3D成像模态,如计算机断层扫描(CT)或磁共振成像(MRI),但这些设备并非广泛可得,尤其在镰状细胞病高发的全球南部地区。 在本研究中,我们提出了一种深度学习流程——DeepSPV,用于从单张或两张2D超声图像中精确估算3D脾脏体积。该流程包含一个分割网络和一个变分自编码器,变分自编码器用于从估算的分割结果中学习低维表征。我们研究了三种脾脏体积估算方法,其中性能最佳的模型在单视角/双视角设置下,平均相对体积精度(MRVA)分别达到86.62%/92.5%,超过了人类专家的表现。此外,该流程还能为体积估算结果提供置信区间,并具有可解释性优势,这有助于临床医生在诊断脾肿大时做出决策。 我们使用由扩散模型生成的高真实感合成数据集对整个流程进行评估,从单张2D超声图像中获得了83.0%的整体平均相对体积精度。我们提出的DeepSPV是首个利用深度学习从2D超声图像中估算3D脾脏体积的研究,能够无缝整合到当前的脾脏评估临床工作流程中。我们还公开了合成的脾脏超声数据集。
Method
方法
In this section, we present the details of our DeepSPV for automatedestimation of volume from 2D single- or dual-view spleen US images.Fig. 1 provides an overview of the DeepSPV pipeline (see blue dottedframe) and the generation of synthetic US data for pipeline evaluation.The pipeline consists of a deep learning-based spleen segmentationmodel followed by a VAE-based volume estimation model. Note thatdue to the lack of paired 2D US images and corresponding groundtruth volumes, we utilised 3D manual spleen segmentations from a CTdataset to develop and evaluate our proposed methods. Details of thisdataset are provided in Section 4.1.1.We start by providing a brief description of the 2D US imagesegmentation model in Section 3.1. Then, we describe the VAE-basedmodel for automated estimation of volume from single- or dual-view2D spleen segmentations, in which we propose three different methodsfor volume estimation. Finally, Section 3.3 details our USDM, which isused to generate a synthetic US dataset for developing and evaluatingthe pipeline.frame) and the generation of synthetic US data for pipeline evaluation.The pipeline consists of a deep learning-based spleen segmentationmodel followed by a VAE-based volume estimation model. Note thatdue to the lack of paired 2D US images and corresponding groundtruth volumes, we utilised 3D manual spleen segmentations from a CTdataset to develop and evaluate our proposed methods. Details of thisdataset are provided in Section 4.1.1.We start by providing a brief description of the 2D US imagesegmentation model in Section 3.1. Then, we describe the VAE-basedmodel for automated estimation of volume from single- or dual-view2D spleen segmentations, in which we propose three different methodsfor volume estimation. Finally, Section 3.3 details our USDM, which isused to generate a synthetic US dataset for developing and evaluatingthe pipeline.
在本节中,我们将详细介绍用于从2D单视角或双视角脾脏超声图像中自动估算体积的DeepSPV。图1展示了DeepSPV流程的概述(参见蓝色虚线框)以及用于流程评估的合成超声数据的生成过程。该流程包含一个基于深度学习的脾脏分割模型,以及一个基于变分自编码器(VAE)的体积估算模型。需要注意的是,由于缺乏配对的2D超声图像及相应的真实体积数据,我们利用了一个CT数据集中的3D手动脾脏分割结果来开发和评估我们提出的方法。该数据集的详细信息将在4.1.1节中介绍。 我们首先在3.1节中简要描述2D超声图像分割模型。然后,阐述基于VAE的模型——该模型用于从单视角或双视角2D脾脏分割结果中自动估算体积,其中我们提出了三种不同的体积估算方法。最后,3.3节详细介绍我们的超声语义扩散模型(USDM),该模型用于生成合成超声数据集,以开发和评估上述流程。
Conclusion
结论
In this work, we have proposed DeepSPV, consisting of a 2D USsegmentation model and a volume estimation model, to estimate thespleen volume from 2D spleen US images. To the best of our knowledge,this is the first work employing 2D US for 3D spleen volume estimationand has surpassed human expert level and existing reconstruction-basedand regression-based methods in spleen volume estimation.
在本研究中,我们提出了DeepSPV(深度脾脏体积估算模型),该模型由一个2D超声分割模型和一个体积估算模型组成,用于从2D脾脏超声图像中估算脾脏体积。据我们所知,这是首个利用2D超声实现3D脾脏体积估算的研究,且在脾脏体积估算方面的表现优于人类专家水平以及现有的基于重建和基于回归的方法。
Results
结果
5.1. Evaluation metrics
To evaluate the performance of the segmentation network, weadopted the Dice score. We also computed the Hausdorff distance (HD)between the predicted segmentation contour and the ground truthsegmentation contour.
5.1 评估指标 为评估分割网络的性能,我们采用了Dice系数。同时,我们还计算了预测分割轮廓与真实分割轮廓之间的豪斯多夫距离(HD)。
Figure
图
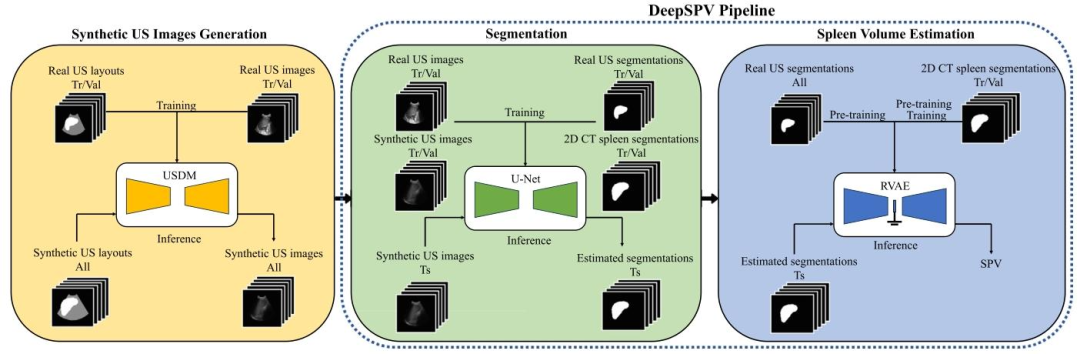
Fig. 1. An overview of this study. It first involves generating synthetic US images with the USDM, which is necessary due to the lack of paired 2D US images and ground truthvolumes. The complete DeepSPV pipeline, proposed to estimate spleen volume from 2D US images, is enclosed within the blue dotted frame and consists of two parts: segmentationand spleen volume estimation. USDM: ultrasound semantic diffusion model. RVAE: end-to-end regression VAE. SPV: spleen volume. Tr/Val/Ts: training/validation/test
图1. 本研究概述。首先涉及使用超声语义扩散模型(USDM)生成合成超声图像,这是由于缺乏配对的2D超声图像和真实体积数据。蓝色虚线框内是用于从2D超声图像估算脾脏体积的完整DeepSPV流程,该流程由两部分组成:分割和脾脏体积估算。USDM:超声语义扩散模型;RVAE:端到端回归变分自编码器;SPV:脾脏体积;Tr/Val/Ts:训练/验证/测试。
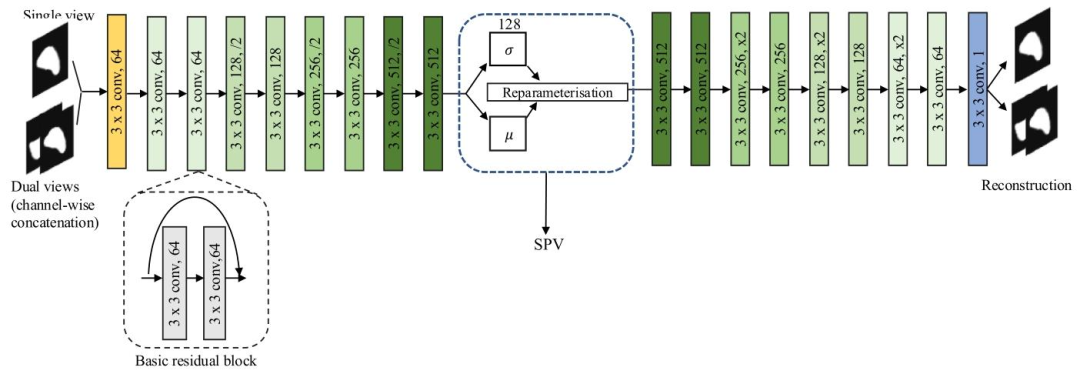
Fig. 2. An illustration of the proposed VAE-based framework. The latent space distribution is parameterised by the mean 𝜇 and standard deviation 𝜎, which is shown in the bluedotted frame. The spleen volume is estimated from this distribution. The basic residual block is shown in the black dotted frame. All our VAE-based models were trained witheither a coronal slice (single view) or a channel-wise concatenation of a coronal slice and a transverse slice (dual views). SPV: spleen volume.
图2. 所提出的基于变分自编码器(VAE)的框架示意图。潜在空间分布由均值𝜇和标准差𝜎参数化(如蓝色虚线框所示)。脾脏体积通过该分布估算得出。黑色虚线框展示了基本残差块。我们所有基于VAE的模型均使用冠状位切片(单视角)或冠状位切片与横断位切片的通道级拼接(双视角)进行训练。SPV:脾脏体积。
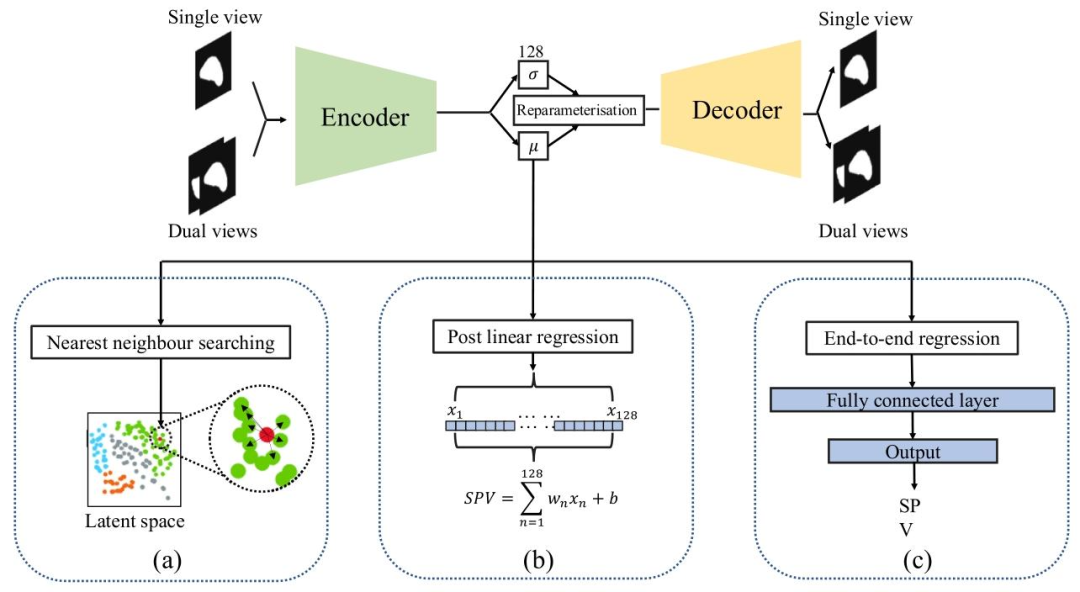
Fig. 3. Illustration of three proposed VAE-based methods: (a) Nearest neighbour searching in the latent space (NN). (b) Post linear regression of latent representations (PLR). (c)End-to-end regression VAE (RVAE)
图3. 三种所提出的基于变分自编码器(VAE)的方法示意图:(a)潜在空间中的最近邻搜索(NN)。(b)潜在表征的后线性回归(PLR)。(c)端到端回归变分自编码器(RVAE)。
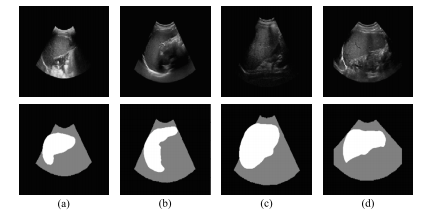
Fig. 4. US images and their corresponding US layouts. The top row displays the originalUS images while the bottom row presents their corresponding US layouts. Each columnrefers to a specific case
图4. 超声图像及其相应的超声布局。上行展示原始超声图像,下行呈现其对应的超声布局。每一列对应一个特定病例。
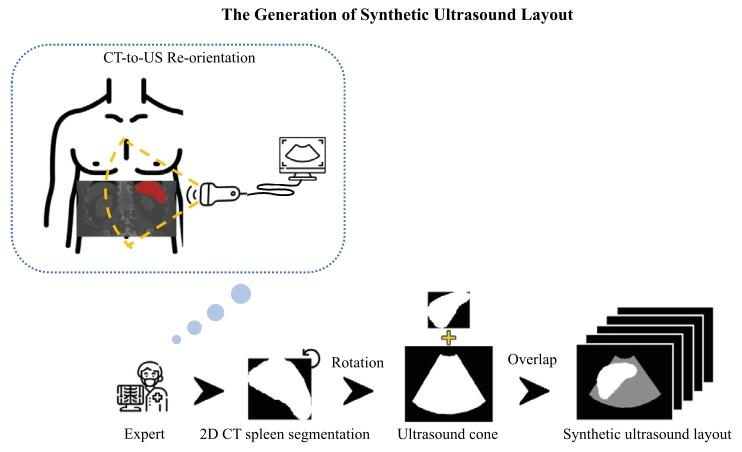
Fig. 5. Illustration of the synthetic US layout creation process. The diagram shows how2D CT spleen segmentations were rotated and aligned with real US cones under expertguidance to emulate realistic clinical acquisition. Specifically, to match the typical leftsided relative location of US probes to the patient in a US examination, the spleensegmentation from CT was rotated 90 degrees anti-clockwise and manually overlaidwith an appropriately sized US cone by a human expert.
图5. 合成超声布局创建过程示意图。该图展示了在专家指导下,如何对2D CT脾脏分割结果进行旋转并与真实超声锥(扫描范围)对齐,以模拟真实的临床采集场景。具体而言,为匹配超声检查中探头相对于患者左侧的典型位置,CT中的脾脏分割结果被逆时针旋转90度,并由专家手动叠加在大小适当的超声锥上。
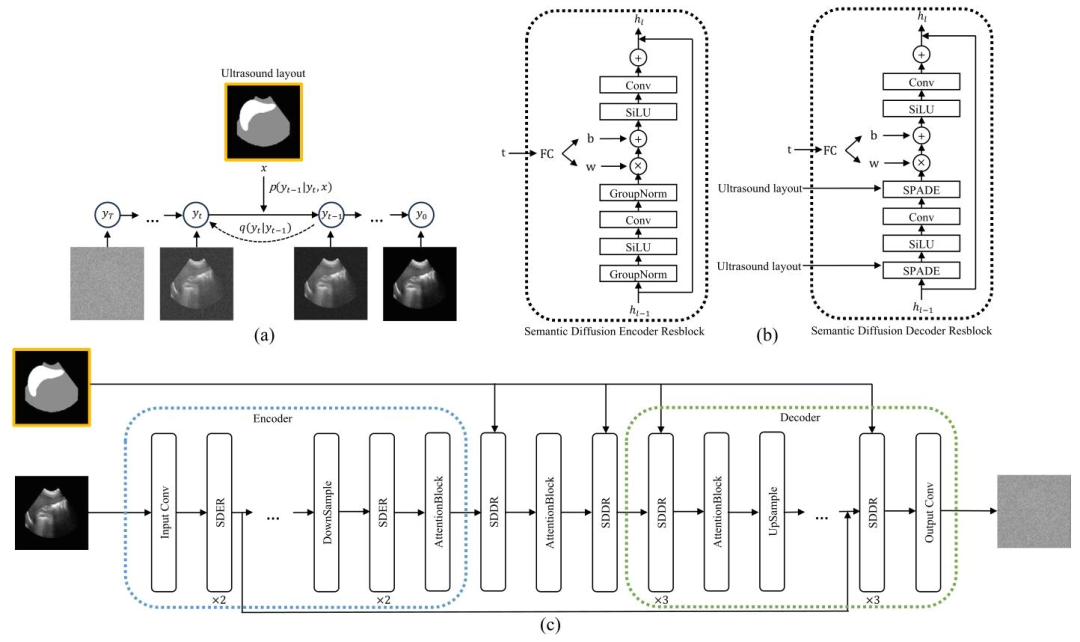
Fig. 6. (a) US Semantic Diffusion Model (USDM). The framework transforms the noise from a standard Gaussian distribution to a realistic image through an iterative denoisingprocess guided by the US layout 𝑥. (b) Semantic Diffusion Encoder Resblock (SDER) and Semantic Diffusion Decoder Resblock (SDDR). (c) The detailed architecture of the USDM.
图6. (a)超声语义扩散模型(USDM)。该框架通过在超声布局𝑥引导下的迭代去噪过程,将标准高斯分布的噪声转化为真实感图像。(b)语义扩散编码器残差块(SDER)和语义扩散解码器残差块(SDDR)。(c)超声语义扩散模型(USDM)的详细架构。
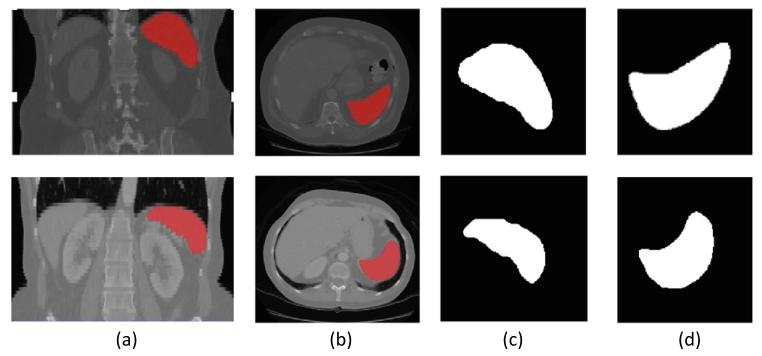
Fig. 7. Two example CT volumes (top and bottom rows) with associated ground truthspleen segmentations and the selected coronal and transverse 2D segmentation slices.(a) Coronal view of CT volume with spleen segmentation in red. (b) Transverse viewof CT volume with spleen segmentation in red. (c) Selected coronal 2D segmentationslice with largest cross-sectional area. (d) Selected transverse 2D segmentation slicewith largest cross-sectional area
图7. 两个示例CT体积数据(上行和下行)及其相关的真实脾脏分割结果,以及所选的冠状位和横断位2D分割切片。(a)CT体积的冠状位视图,其中脾脏分割以红色显示。(b)CT体积的横断位视图,其中脾脏分割以红色显示。(c)具有最大横截面积的所选冠状位2D分割切片。(d)具有最大横截面积的所选横断位2D分割切片。
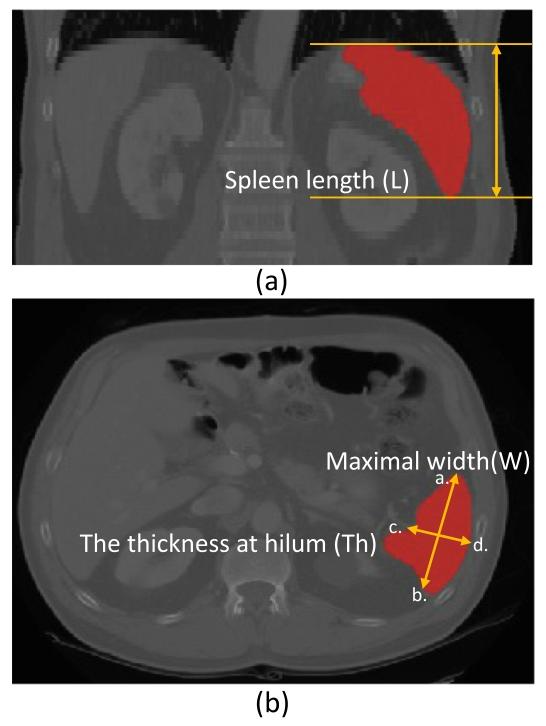
Fig. 8. Illustration of manual measurements from CT images for spleen volumeestimation. (a) Coronal view. The spleen length (L) is obtained by multiplying thespacing of the coronal plane by the number of contiguous slices that contain the spleenalong the transverse axis. (b) Transverse view. The maximal width (W) is obtained byfinding the largest diameter on any transverse slice (see distance between ab). Thethickness at hilum (Th) is determined by the thickness of the spleen at hilum andperpendicular to the spleen width (see distance between cd).
图8. 从CT图像中手动测量脾脏体积的示意图。(a)冠状位视图。脾脏长度(L)通过将冠状面的间距乘以沿横轴包含脾脏的连续切片数量得出。(b)横断位视图。最大宽度(W)通过在任意横断切片上找到最大直径获得(参见ab之间的距离)。脾门厚度(Th)由脾门处的脾脏厚度确定,且与脾脏宽度垂直(参见cd之间的距离)。
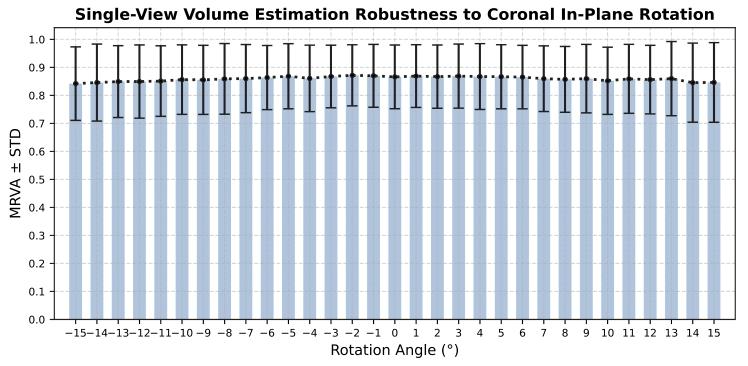
Fig. 9. Robustness of single-view volume estimation to coronal in-plane rotationalerrors.
图9.单视角体积估算对冠状位平面内旋转误差的稳健性。
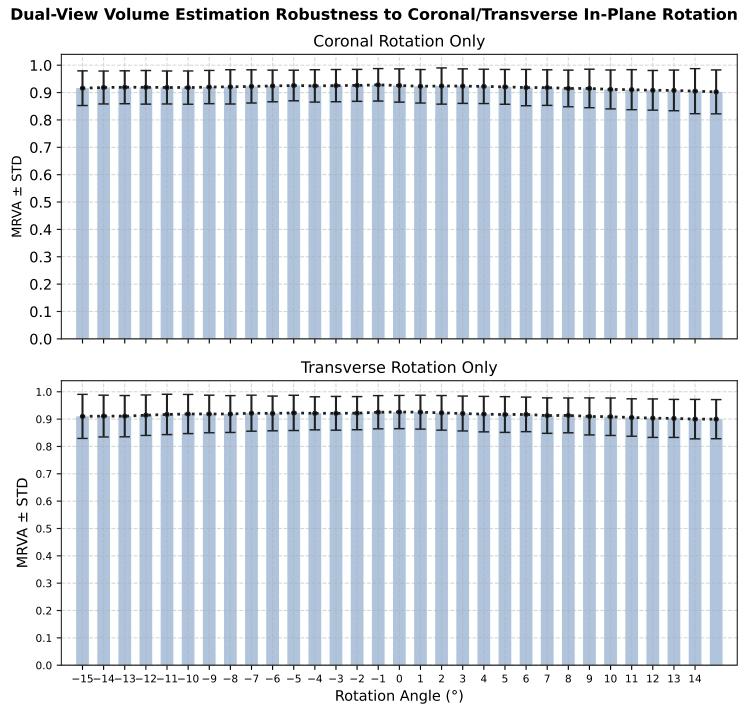
Fig. 10. Robustness of dual-view volume estimation to coronal and transverse in-planerotational errors.
图10. 双视角体积估算对冠状位和横断位平面内旋转误差的稳健性。
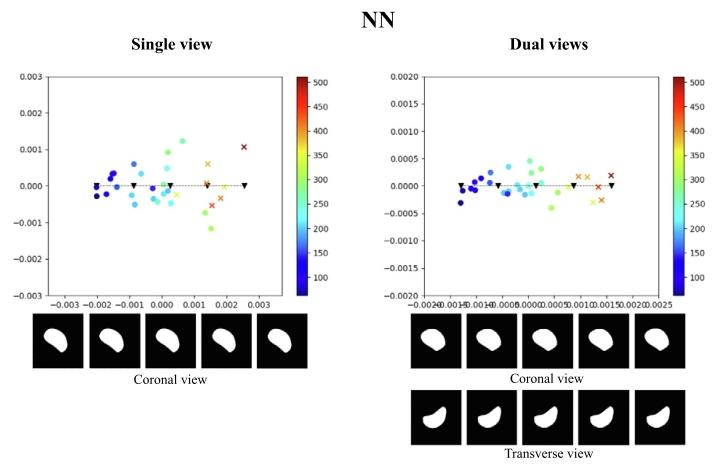
Fig. 11. Illustration of the test latent spaces of NN trained with single-view data ordual-view data. We sampled 5 points along the line of the principal axis, and decodedthe samples to spleen segmentations, as depicted below the 2D latent maps. The coloursindicate estimated spleen volume according to the colour scales shown. The dots arenormal spleen cases, and crosses are splenomegaly cases (i.e., with ground truth volumevalue greater than 314.5 mL).
图11. 经单视角数据或双视角数据训练的最近邻(NN)模型的测试集潜在空间示意图。我们沿主轴方向采样了5个点,并将这些样本解码为脾脏分割结果(如2D潜在空间图下方所示)。颜色根据所示色标表示估算的脾脏体积。圆点代表正常脾脏病例,叉号代表脾肿大病例(即真实体积大于314.5 mL)。
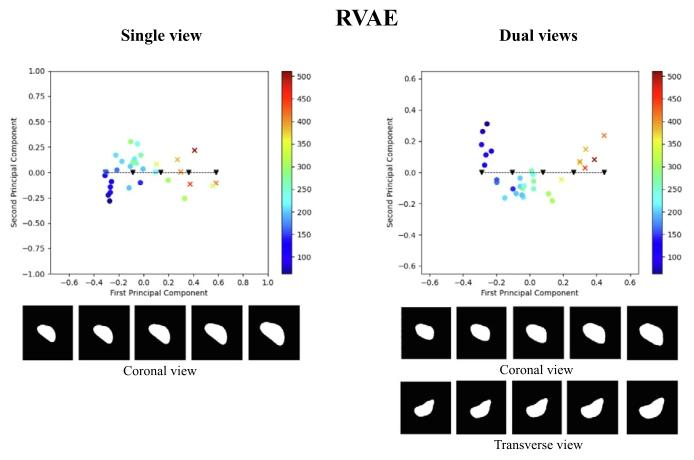
Fig. 12. Illustration of the test latent spaces of RVAE trained with single-view data ordual-view data. We sampled 5 points along the line of the principal axis, and decodedthe samples to spleen segmentations, as depicted below the 2D latent maps. The coloursindicate estimated spleen volume according to the colour scales shown. The dots arenormal spleen cases, and crosses are splenomegaly cases (i.e., with ground truth volumevalue greater than 314.5 mL)
图12. 经单视角数据或双视角数据训练的端到端回归变分自编码器(RVAE)模型的测试集潜在空间示意图。我们沿主轴方向采样了5个点,并将这些样本解码为脾脏分割结果(如2D潜在空间图下方所示)。颜色根据所示色标表示估算的脾脏体积。圆点代表正常脾脏病例,叉号代表脾肿大病例(即真实体积大于314.5 mL)。
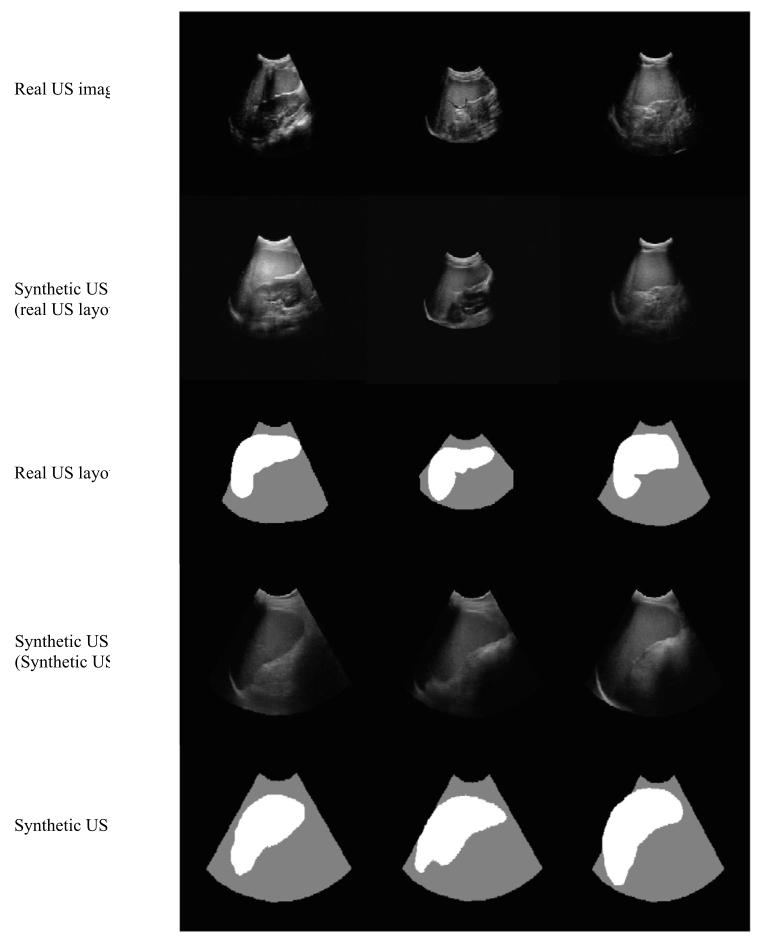
Fig. 13. Examples of real US images, synthetic US images generated from real USlayouts, and the corresponding real US layouts. Below are shown synthetic US imagesand the corresponding synthetic US layouts, which were manually created based on2D CT spleen segmentations.
图13. 真实超声图像、根据真实超声布局生成的合成超声图像,以及相应的真实超声布局示例。下方展示了合成超声图像及相应的合成超声布局,这些合成布局是基于2D CT脾脏分割结果手动创建的。
Table
表
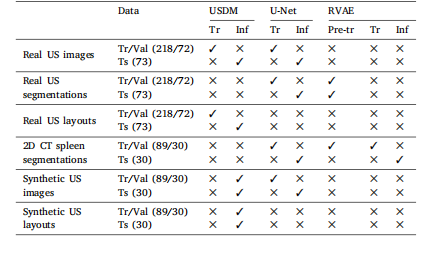
Table 1The breakdown of the data used in the experiments to validate the full volumeestimation pipeline. Tr: training. Val: validation. Ts: test. Pre-tr: pre-training. Inf:inference.
表1 用于验证完整体积估算流程的实验数据细分。Tr:训练;Val:验证;Ts:测试;Pre-tr:预训练;Inf:推理。
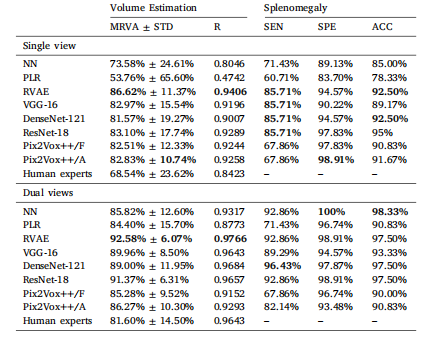
Table 2Comparison of results between NN, LR, RVAE, VGG-16, DenseNet-121, ResNet-18, andPix2Vox++ trained on coronal single-view data and dual view (coronal and transverse)data. Human Experts refers to spleen volume estimated using manual linear regression.Mean relative volume accuracy (MRVA) and standard deviation (STD). R: Pearson’scorrelation coefficient. SEN: sensitivity. SPE: specificity. ACC: accuracy. Best resultsare in bold.
表2 nearest neighbour(NN,最近邻)、linear regression(LR,线性回归)、end-to-end regression VAE(RVAE,端到端回归变分自编码器)、VGG-16、DenseNet-121、ResNet-18以及Pix2Vox++在冠状位单视角数据和双视角(冠状位与横断位)数据上的训练结果对比。“人类专家”指通过手动线性回归估算的脾脏体积。表格中包含平均相对体积精度(MRVA)、标准差(STD)、皮尔逊相关系数(R)、灵敏度(SEN)、特异度(SPE)和准确率(ACC)。最佳结果以粗体显示。
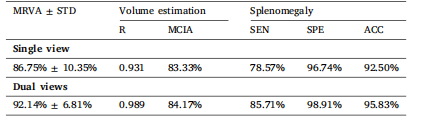
Table 3The results for model RVAE-CI. MRVA: mean relative volume accuracy. STD: standarddeviation; R: Pearson’s correlation coefficient; MCIA: mean confidence interval accuracy; SEN: sensitivity; SPE: specificity; ACC: accuracy.
表3 模型RVAE-CI的结果。MRVA:平均相对体积精度;STD:标准差;R:皮尔逊相关系数;MCIA:平均置信区间精度;SEN:灵敏度;SPE:特异度;ACC:准确率。
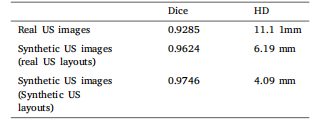
Table 4Dice scores and HD for U-Net segmentation results on the testset of real US images, as well as results specific to synthetic USimages generated using real US layouts and synthetic US layouts,respectively.
表4 U-Net在真实超声图像测试集上的分割结果(Dice系数和豪斯多夫距离),以及分别针对基于真实超声布局生成的合成超声图像和合成超声布局生成的合成超声图像的分割结果。
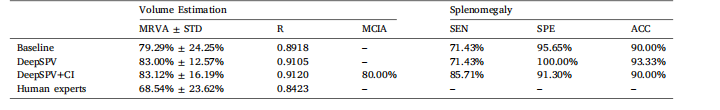
Table 5MRVA for volume estimation from single-view synthetic US images using the full DeepSPV pipeline. For comparison, we also include resultsfrom our best-performing baseline model (ResNet-18, denoted as ‘Baseline’ below) and manual estimations by human experts.
表5 使用完整DeepSPV流程从单视角合成超声图像中进行体积估算的平均相对体积精度(MRVA)。为便于比较,表中还包含了我们性能最佳的基线模型(ResNet-18,以下记为“Baseline”)的结果以及人类专家的手动估算结果。


![《P4092 [HEOI2016/TJOI2016] 树》](http://pic.xiahunao.cn/《P4092 [HEOI2016/TJOI2016] 树》)

(Java实现))


