本文是 IvorySQL 2025 生态大会暨 PostgreSQL 高峰论坛上的演讲内容,作者:NKYoung。
6 月底济南召开的 HOW2025 IvorySQL 生态大会上,我在内核论坛分享了“提升 vacuum 时间观测能力”的主题,提出了新增统计信息的方法,增强 vacuum 执行时长的观测能力。同时也给大家分享了一些 DBA 上手内核的感悟。
vacuum 在 PG 中是一个无法绕开的话题,甚至有些用户因为 vacuum 的特性而放弃 PG。老杨认为只要做好 vacuum 的观测以及优化,这都不是事。
监控 vacuum 的重要性
我们先来看vacuum 的主要工作:
- 移除死元组
- 移除每一页中的死元组,并对每一页内的元组进行碎片整理。
- 移除指向死元组的索引元组。
- 冻结旧的事务标识(txid)
- 如有必要,冻结旧元组的事务标识(txid)。
- 更新与冻结事务标识相关的系统视图(pg_database 与 pg_class)。
- 如果可能,移除非必需的提交日志(clog)。
- 其他
- 更新已处理表的空闲空间映射(FSM)和可见性映射(VM)。
- 更新一些统计信息(pg_stat_all_tables 等)
vacuum 伪代码:
// Phase 1: initializing(1)    FOR each table
(2)      Acquire a ShareUpdateExclusiveLock lock for the target table/* The first block */// Phase 2: Scan Heap
(3)      Scan all pages to get all dead tuples, and freeze old tuples if necessary// Phase 3: Vacuuming Indexes
(4)      Remove the index tuples that point to the respective dead tuples if exists/* The second block */// Phase 4: Vacuuming Heap
(5)      FOR each page of the table
(6)         Remove the dead tuples, and Reallocate the live tuples in the page
(7)         Update FSM and VMEND FOR/* The third block */// Phase 5: Cleaning up indexes
(8)      Clean up indexes// Phase 6: Truncating heap
(9)      Truncate the last page ifpossible
(10)     Update both the statistics and system catalogs of the target tableRelease the ShareUpdateExclusiveLock lockEND FOR/* Post-processing */// Phase 7: Final Cleaning
(11)  Update statistics and system catalogs
(12)  Remove both unnecessary files and pages of the clogif possible
如果 vacuum 不合理,可能会导致以下问题:
- 空间“膨胀”
- 统计信息偏差,SQL 性能劣化
- transaction ID wraparound or multixact ID wraparound
因此对 vacuum 的监控,是 PG 运维环节的重中之重。
监控执行时长的痛点
目前监控 vacuum 的手段:
- 查看统计信息视图:pg_stat_all(user)_tables,获取上次 vacuum 完成时间,vacuum 次数等
- 查看进度报告视图:pg_stat_progress_vacuum(analyze)
- 手动执行 vacuum command 使用 verbose option
我们也可以根据现有的统计信息视图,创建自定义视图来观测 vacuum,具体可以参考灿神的书中对应的章节。
如何监控(auto)vacuum 的时长?
- vacuum:
- 使用 verbose option,这样命令行就会返回 vacuum 过程信息
- 配置 log_min_duration_statement 参数,超过阈值的 vacuum 会记录到日志中
- Autovacuum:
- 配置 log_autovacuum_min_duration 参数,超过阈值的 autovacuum 会记录到日志中。
因此要查看表(auto)vacuum 的时长,几乎只能在 server log 中查看:
- log 阈值参数取值,需要在是否记录大部分表 vacuum 和产生的日志条目占用的存储空间中权衡
- 不是所有人员都有主机权限去访问日志
- 即使将 server log 做成日志服务,检索和分析起来也不是很方便
大多时候表的 vacuum 历史执行时长对于我们精细化 vacuum 调优来说是很必要的。比如结合表的 SQL 性能表现,确定 vacuum 的执行频率,是否调参加速。
所以,为什么不做到统计信息里呢?老杨一直认为对于数据库而言,SQL 是提供给外界访问的最好的 API。这一点 Oracle 就做的很不错,提供了各种各样的统计信息视图,相对丰富全面的统计信息,直接查询系统视图就可以定制大部分监控指标,并不是吹嘘,实事求是。
当然 PG 的可观测性也是一直在发展的。如果搭建监控有痛点的话,认准 pigsty。
提升执行时长观测能力
方案:
PgStatStatTabEntry 结构体新增几个成员,直观来说就是对 pg_stat_all_tables 进行改造,新增 last(auto)vacuumduration,last(auto)analyze_duration 字段,记录上次 vacuum 和 analyze 的时长。
这里特别感谢我的好友神医(邱文辉),感谢他的帮助,同时我能不能成为贡献者就看他了。不报什么期望,主打自嗨图片。
效果:
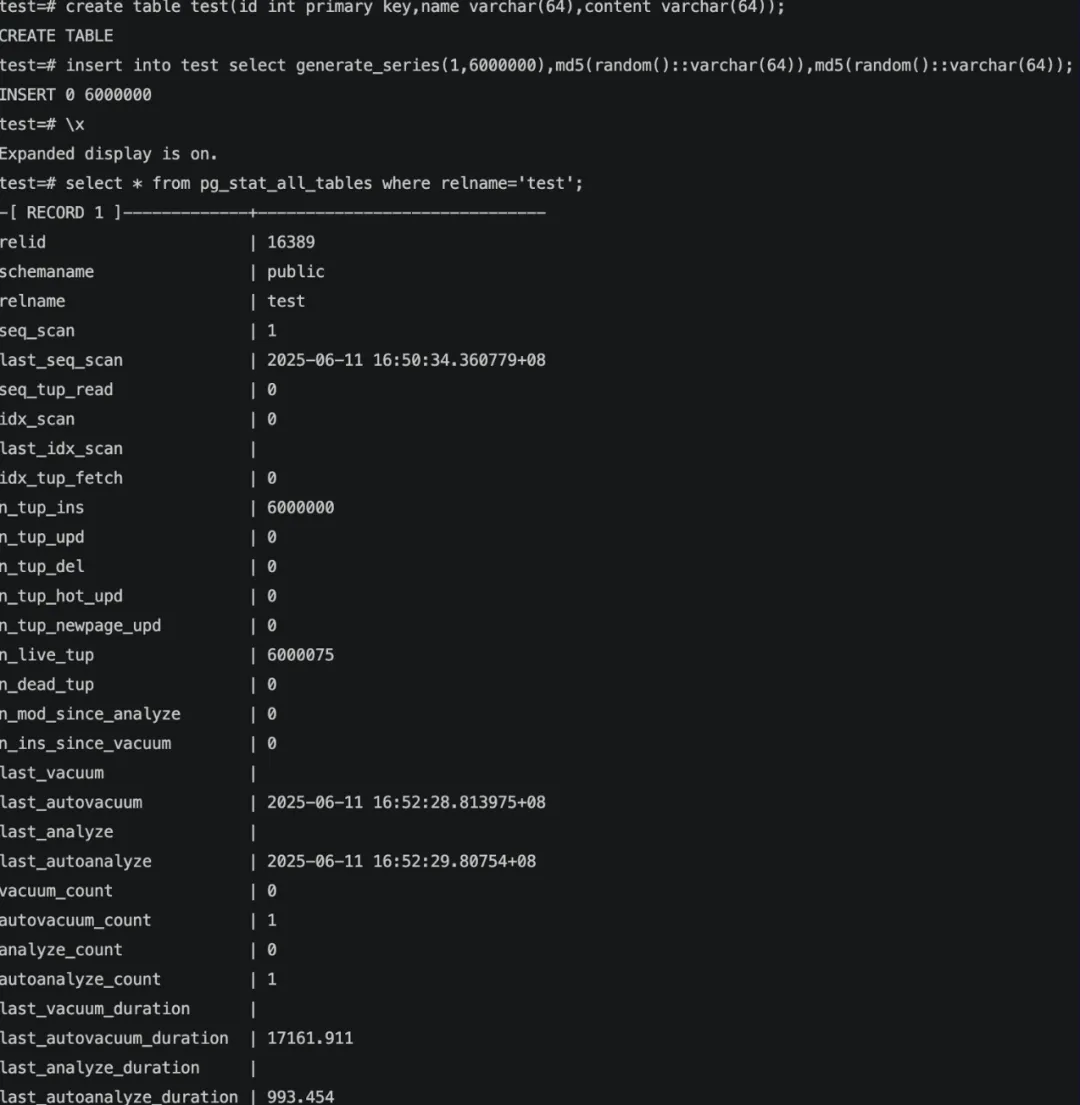
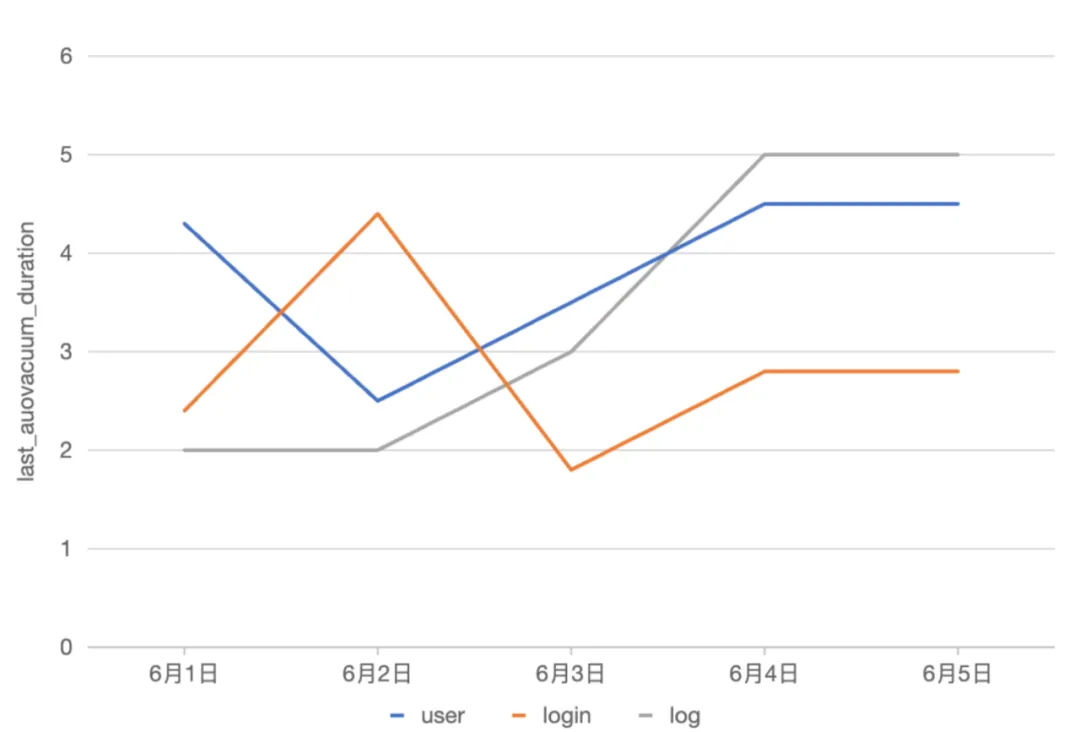
比如可以精细化统计关键表的 Autovacuum 时长,定制监控项来预警。
伪代码: vacuum/analyze 开始时记录一个时间戳,结束时记录一个时间戳。求 duration,并赋值给新增的统计信息。
heap_vacuum_rel:begintime=GetCurrentTimestamp();...do vacuum:...endtime=GetCurrentTimestamp();duration = endtime - begintime;last_vacuum_duration = duration;
do_analyze_rel:begintime=GetCurrentTimestamp();...do analyze:...endtime=GetCurrentTimestamp();duration = endtime - begintime;last_analyze_duration = duration;
代码:
From caeddbf1ead4078d3dd6af36c0bab27f747409a9 Mon Sep 17 00:00:002001
From: Nickyoung0 <yxbshare@163.com>
Date: Fri, 13 Jun 202516:29:55 +0800
Subject: [PATCH] add the duration for last_vacuum/analyze orlast_autovacuum/autoanalyze---.../src/backend/access/heap/vacuumlazy.c      | 38 ++++++++++++++++++-.../src/backend/catalog/system_views.sql      |  6 ++-.../src/backend/commands/analyze.c            | 38 ++++++++++++++++++-.../src/backend/utils/adt/pgstatfuncs.c       | 30 +++++++++++++++.../src/include/catalog/pg_proc.dat           | 16 ++++++++postgresql-17.4/src/include/pgstat.h          |  4 ++
6 files changed, 127 insertions(+), 5 deletions(-)diff --git a/postgresql-17.4/src/backend/access/heap/vacuumlazy.c b/postgresql-17.4/src/backend/access/heap/vacuumlazy.c
index f2d2598..9c78200 100644
--- a/postgresql-17.4/src/backend/access/heap/vacuumlazy.c
+++ b/postgresql-17.4/src/backend/access/heap/vacuumlazy.c
@@ -59,7 +59,7 @@
#include "utils/memutils.h"
#include "utils/pg_rusage.h"
#include "utils/timestamp.h"
-
+#include "utils/pgstat_internal.h"/** Space/time tradeoff parameters: do these need to be user-tunable?
@@ -305,7 +305,14 @@ heap_vacuum_rel(Relation rel, VacuumParams *params,new_rel_pages,new_rel_allvisible;PGRUsage ru0;
- TimestampTz starttime = 0;
+ TimestampTz starttime = 0,
+    begintime = 0;
+        long            secs;
+        int             usecs;
+        int             msecs;
+        PgStat_EntryRef *entry_ref;
+        PgStatShared_Relation *shtabentry;
+        PgStat_StatTabEntry *tabentry;PgStat_Counter startreadtime = 0,startwritetime = 0;WalUsage startwalusage = pgWalUsage;
@@ -327,6 +334,8 @@ heap_vacuum_rel(Relation rel, VacuumParams *params,}}+        begintime = GetCurrentTimestamp();
+pgstat_progress_start_command(PROGRESS_COMMAND_VACUUM,RelationGetRelid(rel));@@ -591,6 +600,31 @@ heap_vacuum_rel(Relation rel, VacuumParams *params,vacrel->missed_dead_tuples);pgstat_progress_end_command();+ TimestampDifference(begintime,
+                                        GetCurrentTimestamp(),
+                                        &secs, &usecs);
+        msecs = usecs / 1000;
+        /* Add commentMore actions
+         * Store the data in the table's hash table entry.
+         * block acquiring lock for the same reason as pgstat_report_autovac()
+         */
+        entry_ref = pgstat_get_entry_ref_locked(PGSTAT_KIND_RELATION,
+                                                MyDatabaseId, RelationGetRelid(rel), false);
+
+        shtabentry = (PgStatShared_Relation *) entry_ref->shared_stats;
+        tabentry = &shtabentry->stats;
+
+        if (AmAutoVacuumWorkerProcess())
+
+        {
+                snprintf(tabentry->last_autovacuum_duration, 32, "%ld.%03d",
+                                secs * 1000 + msecs, usecs % 1000);
+        }
+        else
+                snprintf(tabentry->last_vacuum_duration, 32, "%ld.%03d",
+                                secs * 1000 + msecs, usecs % 1000);
+        pgstat_unlock_entry(entry_ref);
+
if (instrument){TimestampTz endtime = GetCurrentTimestamp();
diff --git a/postgresql-17.4/src/backend/catalog/system_views.sql b/postgresql-17.4/src/backend/catalog/system_views.sql
index efb29ad..411609f 100644
--- a/postgresql-17.4/src/backend/catalog/system_views.sql
+++ b/postgresql-17.4/src/backend/catalog/system_views.sql
@@ -695,7 +695,11 @@ CREATE VIEW pg_stat_all_tables ASpg_stat_get_vacuum_count(C.oid) AS vacuum_count,pg_stat_get_autovacuum_count(C.oid) AS autovacuum_count,pg_stat_get_analyze_count(C.oid) AS analyze_count,
-            pg_stat_get_autoanalyze_count(C.oid) AS autoanalyze_count
+            pg_stat_get_autoanalyze_count(C.oid) AS autoanalyze_count,
+            pg_stat_get_last_vacuum_duration(c.oid) AS last_vacuum_duration,
+            pg_stat_get_last_autovacuum_duration(c.oid) AS last_autovacuum_duration,
+            pg_stat_get_last_analyze_duration(c.oid) AS last_analyze_duration,
+            pg_stat_get_last_autoanalyze_duration(c.oid) AS last_autoanalyze_durationFROM pg_class C LEFT JOINpg_index I ON C.oid = I.indrelidLEFT JOIN pg_namespace N ON(N.oid = C.relnamespace)
diff --git a/postgresql-17.4/src/backend/commands/analyze.c b/postgresql-17.4/src/backend/commands/analyze.c
index c590a2a..a98da59 100644
--- a/postgresql-17.4/src/backend/commands/analyze.c
+++ b/postgresql-17.4/src/backend/commands/analyze.c
@@ -57,7 +57,7 @@
#include "utils/spccache.h"
#include "utils/syscache.h"
#include "utils/timestamp.h"
-
+#include "utils/pgstat_internal.h"/* Per-index data for ANALYZE */
typedef struct AnlIndexData
@@ -298,7 +298,14 @@ do_analyze_rel(Relation onerel, VacuumParams *params,totaldeadrows;HeapTuple  *rows;PGRUsage ru0;
- TimestampTz starttime = 0;
+ TimestampTz starttime = 0,
+    begintime = 0;
+        long            secs;
+        int             usecs;
+        int             msecs;
+        PgStat_EntryRef *entry_ref;
+        PgStatShared_Relation *shtabentry;
+        PgStat_StatTabEntry *tabentry;MemoryContext caller_context;Oid   save_userid;
int   save_sec_context;
@@ -353,6 +360,8 @@ do_analyze_rel(Relation onerel, VacuumParams *params,starttime = GetCurrentTimestamp();}+        begintime = GetCurrentTimestamp();
+
/** Determine which columns to analyze*
@@ -722,6 +731,31 @@ do_analyze_rel(Relation onerel, VacuumParams *params,/* Done with indexes */vac_close_indexes(nindexes, Irel, NoLock);
+
+ TimestampDifference(begintime,
+                                        GetCurrentTimestamp(),
+                                        &secs, &usecs);
+        msecs = usecs / 1000;
+        /* Add commentMore actions
+         * Store the data in the table's hash table entry.
+         * block acquiring lock for the same reason as pgstat_report_autovac()
+         */
+        entry_ref = pgstat_get_entry_ref_locked(PGSTAT_KIND_RELATION,
+                                                MyDatabaseId, RelationGetRelid(onerel), false);
+
+        shtabentry = (PgStatShared_Relation *) entry_ref->shared_stats;
+        tabentry = &shtabentry->stats;
+
+        if (AmAutoVacuumWorkerProcess())
+
+        {
+                snprintf(tabentry->last_autoanalyze_duration, 32, "%ld.%03d",
+                                secs * 1000 + msecs, usecs % 1000);
+        }
+        else
+                snprintf(tabentry->last_analyze_duration, 32, "%ld.%03d",
+                                secs * 1000 + msecs, usecs % 1000);
+        pgstat_unlock_entry(entry_ref);/* Log the action if appropriate */
if (AmAutoVacuumWorkerProcess() && params->log_min_duration >= 0)
diff --git a/postgresql-17.4/src/backend/utils/adt/pgstatfuncs.c b/postgresql-17.4/src/backend/utils/adt/pgstatfuncs.c
index 2575dba..7aaab84 100644
--- a/postgresql-17.4/src/backend/utils/adt/pgstatfuncs.c
+++ b/postgresql-17.4/src/backend/utils/adt/pgstatfuncs.c
@@ -140,6 +140,36 @@ PG_STAT_GET_RELENTRY_TIMESTAMPTZ(last_vacuum_time)
/* pg_stat_get_lastscan */PG_STAT_GET_RELENTRY_TIMESTAMPTZ(lastscan)+#define PG_STAT_GET_RELENTRY_STRING(stat)                                  \
+Datum                                                                                                                   \
+CppConcat(pg_stat_get_,stat)(PG_FUNCTION_ARGS)                                  \
+{                                                                                                                               \
+        Oid                     relid = PG_GETARG_OID(0);                                               \
+        char    *result;                                                                                     \
+        PgStat_StatTabEntry *tabentry;                                                          \
+                                                                                                                                \
+        if ((tabentry = pgstat_fetch_stat_tabentry(relid)) == NULL)     \
+                PG_RETURN_NULL();                                                                                             \
+        else                                                                                                            \
+                result = tabentry->stat;                                                                \
+                                                                                                                                \
+        if (result == NULL || result[0] == '\0')                                                                                        \
+                PG_RETURN_NULL();                                                                               \
+        else                                                                                                            \
+                PG_RETURN_TEXT_P(cstring_to_text(result));                                                 \
+}
+/* pg_stat_get_last_vacuum_duration */
+PG_STAT_GET_RELENTRY_STRING(last_vacuum_duration)
+
+/* pg_stat_get_last_autovacuum_duration */
+PG_STAT_GET_RELENTRY_STRING(last_autovacuum_duration)
+
+/* pg_stat_get_last_analyze_duration */
+PG_STAT_GET_RELENTRY_STRING(last_analyze_duration)
+
+/* pg_stat_get_last_autoanalyze_duration */
+PG_STAT_GET_RELENTRY_STRING(last_autoanalyze_duration)
+Datumpg_stat_get_function_calls(PG_FUNCTION_ARGS){
diff --git a/postgresql-17.4/src/include/catalog/pg_proc.dat b/postgresql-17.4/src/include/catalog/pg_proc.dat
index 6a5476d..2809c39 100644
--- a/postgresql-17.4/src/include/catalog/pg_proc.dat
+++ b/postgresql-17.4/src/include/catalog/pg_proc.dat
@@ -5445,6 +5445,22 @@proname => 'pg_stat_get_autoanalyze_count', provolatile => 's',proparallel => 'r', prorettype => 'int8', proargtypes => 'oid',prosrc => 'pg_stat_get_autoanalyze_count' },
+{ oid => '6347', descr => 'statistics: last manual vacuum duration for a table',
+  proname => 'pg_stat_get_last_vacuum_duration', provolatile => 's',
+  proparallel => 'r', prorettype => 'text', proargtypes => 'oid',
+  prosrc => 'pg_stat_get_last_vacuum_duration' },
+{ oid => '6348', descr => 'statistics: last auto vacuum duration for a table',
+  proname => 'pg_stat_get_last_autovacuum_duration', provolatile => 's',
+  proparallel => 'r', prorettype => 'text', proargtypes => 'oid',
+  prosrc => 'pg_stat_get_last_autovacuum_duration' },
+{ oid => '6349', descr => 'statistics: last manual analyze duration for a table',
+  proname => 'pg_stat_get_last_analyze_duration', provolatile => 's',
+  proparallel => 'r', prorettype => 'text', proargtypes => 'oid',
+  prosrc => 'pg_stat_get_last_analyze_duration' },
+{ oid => '6350', descr => 'statistics: last auto analyze duration for a table',
+  proname => 'pg_stat_get_last_autoanalyze_duration', provolatile => 's',
+  proparallel => 'r', prorettype => 'text', proargtypes => 'oid',
+  prosrc => 'pg_stat_get_last_autoanalyze_duration' },{ oid => '1936', descr => 'statistics: currently active backend IDs',proname => 'pg_stat_get_backend_idset', prorows => '100', proretset => 't',provolatile => 's', proparallel => 'r', prorettype => 'int4',
diff --git a/postgresql-17.4/src/include/pgstat.h b/postgresql-17.4/src/include/pgstat.h
index 2136239..f3f3423 100644
--- a/postgresql-17.4/src/include/pgstat.h
+++ b/postgresql-17.4/src/include/pgstat.h
@@ -426,6 +426,10 @@ typedef struct PgStat_StatTabEntryPgStat_Counter analyze_count;TimestampTz last_autoanalyze_time; /* autovacuum initiated */PgStat_Counter autoanalyze_count;
+        char            last_vacuum_duration[32];
+        char            last_autovacuum_duration[32];
+        char            last_analyze_duration[32];
+        char            last_autoanalyze_duration[32];} PgStat_StatTabEntry;typedef struct PgStat_WalStats
--
2.39.5 (Apple Git-154)
DBA 上手内核的感悟
虽然老杨一直提倡 DBA 向内核精进,但是否搞内核,还是因人而异。
先说说我自己为什么会坚持玩内核:
说直白点,其实就是自嗨,给自己提供情绪价值,自我取悦,自我肯定。
工作是存在隐形鄙视链的,运维被视为“打杂的”再正常不过了。
所有的脏活累活运维来扛,却没什么成果可以呈现。
再加目前重应用,轻数据库的玩法,甚至有些项目中数据库被当做存储来使用,DBA 的价值就更得不到体现了。另外就是本身 DBA 的某些能力也不如前辈了,比如我自己,老实说我的 SQL 能力就不怎么样。
在晋升汇报时,时不时被拷打,没有量化的成果去展示。当你表达客户满意度提升,收入增长,成本缩减时可能被质疑,这是研发和产品所负责的事情。
所以,运维拿着最低的工资,没有价值体现,还被 PUA,你不自嗨,这工作干着得多心累?
多年前在某家公司,全组就我一个人能通过看代码分析报错,这期间我看过 PG、MySQL、Redis、MongoDB 等。虽然都是简单问题,但这种装 X 的感觉是真的好,人需要装 X。
不过,我现在的团队挺 nice 的,老板鼓励大家深入技术,多参加技术活动。
当然不是说 DBA 非得去搞内核,看个人的兴趣点在哪吧,这个节点更适合卷 AI。 工作的同时能够发展自己的兴趣,也是一件美事。
假如你也是非专业人士,想搞内核,可以参考下老杨的几点感悟:
-
前期积累:对 PG 代码的熟悉,对每个模块逻辑的理解。
-
从何入手:“临摹”已有的逻辑,比如实现一个新的 GUC 产生不同的控制逻辑
-
借助 AI :可以使用 AI 去分析代码逻辑,并实现功能,对比 AI 和自己思路的差异
-
勇于尝试:只要有想法就可以尝试实现,不要过于在乎“正确性”、“专业性”
-
过程>结果:能不能实现不重要,最有收益的是对于原理的深入理解


)

Cursor)


)


 ✨ | VerifyAccountUi(验证码组件))

