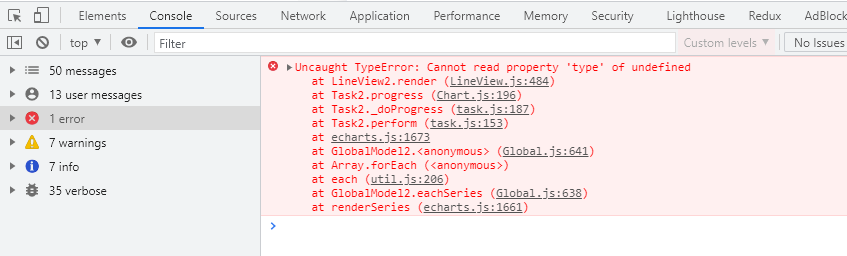
原因是:echats 实例,不能够用响应式变量去接收。
<template><div class="attendance-chart"><div v-if="loading" class="loading">加载中...</div><div v-else-if="error" class="error">数据加载失败: {{ error }}<button @click="fetchData">重新加载</button></div><div v-else><div ref="chart" style="width: 100%; height: 350px;"></div><div v-if="!chartData.attendanceData.length" class="no-data">暂无数据</div></div></div>
</template><script>
import * as echarts from 'echarts';
import homeService from '@api/home/home';export default {name: 'AttendanceChart',data() {return {chartInstance: null,  //这里是响应式chartData: {projectList: [],dateList: [],attendanceData: [],},loading: false,error: null,};},mounted() {this.fetchData();window.addEventListener('resize', this.resizeChart);},beforeDestroy() {window.removeEventListener('resize', this.resizeChart);this.destroyChart();},methods: {async fetchData() {this.loading = true;this.error = null;try {const response = await homeService.getData();if (this.validateData(response)) {this.chartData = response;this.$nextTick(() => this.initChart());} else {throw new Error('数据格式不正确');}} catch (err) {this.error = err.message || '请求失败';console.error('获取数据失败:', err);} finally {this.loading = false;}},validateData(data) {return (Array.isArray(data.projectList) &&Array.isArray(data.dateList) &&Array.isArray(data.attendanceData) &&data.attendanceData.every(item => item.projectName && Array.isArray(item.data) &&item.data.every(val => typeof val === 'number')));},initChart(attempt = 0) {if (attempt > 3) {this.error = '图表初始化超时';return;}if (!this.$refs.chart) {setTimeout(() => this.initChart(attempt + 1), 200);return;}this.destroyChart();try {this.chartInstance = echarts.init(this.$refs.chart);this.updateChart();} catch (err) {console.error('图表初始化失败:', err);this.error = '图表初始化失败';}},updateChart() {if (!this.chartInstance) return;try {const option = {tooltip: {trigger: 'axis',backgroundColor: 'rgba(0,0,0,0.7)',borderWidth: 0,padding: 10,textStyle: {color: '#fff',fontSize: 12},},legend: {data: this.chartData.projectList,bottom: 10,textStyle: {fontSize: 12},},grid: {left: '3%',right: '4%',bottom: '15%',top: '5%',containLabel: true},xAxis: {type: 'category',boundaryGap: false,data: this.chartData.dateList,axisLabel: {rotate: 45,fontSize: 12}},yAxis: {type: 'value',name: '人数',nameTextStyle: {fontSize: 12}},series: this.chartData.attendanceData.map(item => ({name: item.projectName,type: 'line',data: item.data,symbol: 'circle',symbolSize: 6,showSymbol: false,lineStyle: {width: 2},emphasis: {lineStyle: {width: 3}}}))};this.chartInstance.setOption(option, true);} catch (err) {console.error('图表配置失败:', err);this.error = '图表渲染失败';}},resizeChart() {if (this.chartInstance) {this.chartInstance.resize();}},destroyChart() {if (this.chartInstance) {this.chartInstance.dispose();this.chartInstance = null;}}}
};
</script><style scoped>
.attendance-chart {width: 100%;height: 350px;padding: 12px;background: #fff;border-radius: 8px;box-shadow: 0 2px 8px rgba(0, 0, 0, 0.1);position: relative;
}.loading,
.error,
.no-data {position: absolute;top: 50%;left: 50%;transform: translate(-50%, -50%);text-align: center;color: #666;
}.error {color: #f56c6c;
}.error button {margin-top: 8px;padding: 4px 12px;background: #f56c6c;color: white;border: none;border-radius: 4px;cursor: pointer;
}.no-data {color: #999;
}
</style>
修正后的代码:
<template><div class="attendance-chart"><div v-if="loading" class="loading">加载中...</div><div v-else-if="error" class="error">数据加载失败: {{ error }}<button @click="fetchData">重新加载</button></div><div v-else><div ref="chart" style="width: 100%; height: 350px;"></div><div v-if="!chartData.attendanceData.length" class="no-data">暂无数据</div></div></div>
</template><script>
import * as echarts from 'echarts';
import homeService from '../../../api/home/home';export default {name: 'AttendanceChart',data() {return {// 不要将 chartInstance 放在 data 中chartData: {projectList: [],dateList: [],attendanceData: [],},loading: false,error: null,};},// 将 chartInstance 作为组件实例属性chartInstance: null,mounted() {this.fetchData();window.addEventListener('resize', this.resizeChart);},beforeDestroy() {window.removeEventListener('resize', this.resizeChart);this.destroyChart();},methods: {async fetchData() {this.loading = true;this.error = null;try {const response = await homeService.getData();if (this.validateData(response)) {this.chartData = response;this.$nextTick(() => this.initChart());} else {throw new Error('数据格式不正确');}} catch (err) {this.error = err.message || '请求失败';console.error('获取数据失败:', err);} finally {this.loading = false;}},validateData(data) {return (Array.isArray(data.projectList) &&Array.isArray(data.dateList) &&Array.isArray(data.attendanceData) &&data.attendanceData.every(item => item.projectName && Array.isArray(item.data) &&item.data.every(val => typeof val === 'number')));},initChart(attempt = 0) {if (attempt > 3) {this.error = '图表初始化超时';return;}if (!this.$refs.chart) {setTimeout(() => this.initChart(attempt + 1), 200);return;}this.destroyChart();try {// 直接赋值给组件实例属性,而不是响应式数据this.$options.chartInstance = echarts.init(this.$refs.chart);this.updateChart();} catch (err) {console.error('图表初始化失败:', err);this.error = '图表初始化失败';}},updateChart() {// 从组件实例属性获取const chartInstance = this.$options.chartInstance;if (!chartInstance) return;try {const option = {tooltip: {trigger: 'axis',backgroundColor: 'rgba(0,0,0,0.7)',borderWidth: 0,padding: 10,textStyle: {color: '#fff',fontSize: 12},},legend: {data: this.chartData.projectList,bottom: 10,textStyle: {fontSize: 12},},grid: {left: '3%',right: '4%',bottom: '15%',top: '5%',containLabel: true},xAxis: {type: 'category',boundaryGap: false,data: this.chartData.dateList,axisLabel: {rotate: 45,fontSize: 12}},yAxis: {type: 'value',name: '人数',nameTextStyle: {fontSize: 12}},series: this.chartData.attendanceData.map(item => ({name: item.projectName,type: 'line',data: item.data,symbol: 'circle',symbolSize: 6,showSymbol: false,lineStyle: {width: 2},emphasis: {lineStyle: {width: 3}}}))};chartInstance.setOption(option, true);} catch (err) {console.error('图表配置失败:', err);this.error = '图表渲染失败';}},resizeChart() {const chartInstance = this.$options.chartInstance;if (chartInstance) {chartInstance.resize();}},destroyChart() {const chartInstance = this.$options.chartInstance;if (chartInstance) {chartInstance.dispose();this.$options.chartInstance = null;}}}
};
</script><style scoped>
.attendance-chart {width: 100%;height: 350px;padding: 12px;background: #fff;border-radius: 8px;box-shadow: 0 2px 8px rgba(0, 0, 0, 0.1);position: relative;
}.loading,
.error,
.no-data {position: absolute;top: 50%;left: 50%;transform: translate(-50%, -50%);text-align: center;color: #666;
}.error {color: #f56c6c;
}.error button {margin-top: 8px;padding: 4px 12px;background: #f56c6c;color: white;border: none;border-radius: 4px;cursor: pointer;
}.no-data {color: #999;
}
</style>
ECharts 在 Vue 中的正确使用方式
关键修改点
1. 移除响应式的 chartInstance
- ❌ 不再在
data()中声明chartInstance - ✅ 改为使用
this.$options.chartInstance存储 ECharts 实例
2. 统一实例访问方式
- 所有方法中通过
this.$options.chartInstance访问图表实例 - 确保不会触发 Vue 的响应式系统
3. 完善销毁机制
destroyChart() {const chartInstance = this.$options.chartInstanceif (chartInstance) {chartInstance.dispose()this.$options.chartInstance = null}
}
为什么不能使用响应式变量?
ECharts 实例被 Vue 响应式代理后会导致:
⚠️ ECharts 内部方法调用异常
⚠️ 图例点击等交互事件失效
⚠️ 可能引发内存泄漏
⚠️ 性能下降替代方案
// 方案1:使用组件选项
this.$options.chartInstance = echarts.init()// 方案2:在 created 中定义非响应式属性
created() {this.chartInstance = null
}
注意事项
确保容器存在
mounted() {this.$nextTick(() => {this.fetchData()})
}
处理动态数据更新
watch: {'chartData.attendanceData': {handler() {this.updateChart()},deep: true}
}
添加加载状态
updateChart() {if (this.$options.chartInstance) {this.$options.chartInstance.showLoading()// ...设置option...this.$options.chartInstance.hideLoading()}
}
最终效果:经过这些修改后,图表的所有交互功能(包括图例点击)都将正常工作。


)


