1.安装docker,docker-compose
(1)安装依赖包
yum install -y yum-utils device-mapper-persistent-data lvm22.2、部署dockertar  xvf docker-20.10.19.tgz
cp docker/* /usr/bin/vim /usr/lib/systemd/system/docker.service[Unit]
Description=Docker Application Container Engine
Documentation=https://docs.docker.com
After=network-online.target firewalld.service
Wants=network-online.target[Service]
Type=notify
# the default is not to use systemd for cgroups because the delegate issues still
# exists and systemd currently does not support the cgroup feature set required
# for containers run by docker
ExecStart=/usr/bin/dockerd
ExecReload=/bin/kill -s HUP $MAINPID
# Having non-zero Limit*s causes performance problems due to accounting overhead
# in the kernel. We recommend using cgroups to do container-local accounting.
LimitNOFILE=infinity
LimitNPROC=infinity
LimitCORE=infinity
# Uncomment TasksMax if your systemd version supports it.
# Only systemd 226 and above support this version.
#TasksMax=infinity
TimeoutStartSec=0
# set delegate yes so that systemd does not reset the cgroups of docker containers
Delegate=yes
# kill only the docker process, not all processes in the cgroup
KillMode=process
# restart the docker process if it exits prematurely
Restart=on-failure
StartLimitBurst=3
StartLimitInterval=60s
[Install]
WantedBy=multi-user.targetsystemctl enable docker
systemctl restart docker vim /etc/docker/daemon.json{"data-root": "/data/docker/ucsp-data/docker "
}
```mkdir -p /data/docker/ucsp-data/docker
cp -r /var/lib/docker/*  /data/docker/ucsp-data/dockersystemctl daemon-reload
systemctl restart docker
docker   version
[root@localhost ~]# docker   version
Client:Version:           20.10.19API version:       1.41Go version:        go1.18.7Git commit:        d85ef84Built:             Thu Oct 13 16:43:07 2022OS/Arch:           linux/amd64Context:           defaultExperimental:      trueServer: Docker Engine - CommunityEngine:Version:          20.10.19API version:      1.41 (minimum version 1.12)Go version:       go1.18.7Git commit:       c964641Built:            Thu Oct 13 16:48:41 2022OS/Arch:          linux/amd64Experimental:     falsecontainerd:Version:          v1.6.8GitCommit:        9cd3357b7fd7218e4aec3eae239db1f68a5a6ec6runc:Version:          1.1.4GitCommit:        v1.1.4-0-g5fd4c4d1docker-init:Version:          0.19.0GitCommit:        de40ad0
[root@localhost ~]#
安装docker-compose
##安装docker-compose
cp ./docker-compose-linux-x86_64 /usr/local/bin/docker-compose
chmod +x /usr/local/bin/docker-compose
ln -s /usr/local/bin/docker-compose /usr/bin/docker-compose
配置docker国内镜像源
##配置DockerHub 国内镜像源
vim /etc/docker/daemon.json 添加如下:
"registry-mirrors": ["https://docker.1ms.run","https://docker.xuanyuan.me"]##查看配置
[root@localhost ~]# cat /etc/docker/daemon.json
{"data-root": "/data/docker/ucsp-data/docker","registry-mirrors": ["https://docker.1ms.run","https://docker.xuanyuan.me"]
}
[root@localhost ~]###重启
systemctl daemon-reload
systemctl restart docker
修改docker-compose.yaml
[root@localhost OpenTelemetry]# cat docker-compose.yml
version: '3.8'services:# OpenTelemetry Collector (数据收集和转发)otel-collector:image: otel/opentelemetry-collector:latestcontainer_name: otel-collectorcommand: ["--config=/etc/otel-config.yaml"]volumes:- ./otel-config.yaml:/etc/otel-config.yamlports:- "4317:4317"  # OTLP gRPC- "4318:4318"  # OTLP http- "8889:8889"  # Promentheus exporter metricsdepends_on:- prometheus# Prometheus (指标存储)prometheus:image: prom/prometheus:latestvolumes:- ./prometheus.yml:/etc/prometheus/prometheus.yml- ./alertmanager.yml:/etc/alertmanager/alertmanager.ymlports:- "9090:9090"command:- "--config.file=/etc/prometheus/prometheus.yml"- "--web.external-url=http://localhost:9090"depends_on:- alertmanager# Alertmanager (告警管理)alertmanager:image: prom/alertmanager:latestvolumes:- ./alertmanager.yml:/etc/alertmanager/alertmanager.ymlports:- "9093:9093"command:- "--config.file=/etc/alertmanager/alertmanager.yml"# Grafana (可视化)grafana:image: grafana/grafana:latestvolumes:- grafana-storage:/var/lib/grafanaenvironment:- GF_SECURITY_ADMIN_PASSWORD=adminports:- "3000:3000"depends_on:- prometheuszipkin:image: openzipkin/zipkin:latestcontainer_name: zipkinports:- "9411:9411"deploy:resources:limits:memory: 2Genvironment:JAVA_OPTS: "-Xmx1g -Xms1g -XX:+UseG1GC -XX:+HeapDumpOnOutOfMemoryError"redis:image: "redis:6.2"container_name: redishostname: redisrestart: alwaysenvironment:TZ: Asia/Shanghaiports:- "6379:6379"victoriametrics:image: victoriametrics/victoria-metrics:v1.79.12container_name: victoriametricshostname: victoriametricsrestart: alwaysenvironment:TZ: Asia/Shanghaiports:- "8428:8428"command:- "--loggerTimezone=Asia/Shanghai"nightingale:image: flashcatcloud/nightingale:latestcontainer_name: nightingalehostname: nightingalerestart: alwaysenvironment:GIN_MODE: releaseTZ: Asia/ShanghaiWAIT_HOSTS: redis:6379volumes:- ./etc-nightingale:/app/etcports:- "17000:17000"- "20090:20090"depends_on:- redis- victoriametricscommand: >sh -c "/app/n9e"categraf:image: "flashcatcloud/categraf:latest"container_name: "categraf"hostname: "categraf01"restart: alwaysenvironment:TZ: Asia/ShanghaiHOST_PROC: /hostfs/procHOST_SYS: /hostfs/sysHOST_MOUNT_PREFIX: /hostfsWAIT_HOSTS: nightingale:17000, nightingale:20090volumes:- ./etc-categraf:/etc/categraf/conf- /:/hostfsdepends_on:- nightingalevolumes:grafana-storage:
修改otel-config.yaml
[root@localhost OpenTelemetry]# cat otel-config.yaml
receivers:otlp:protocols:grpc:endpoint: '0.0.0.0:4317'http:endpoint: '0.0.0.0:4318'
processors:batch:exporters:# NOTE: Prior to v0.86.0 use `logging` instead of `debug`.prometheus:endpoint: "0.0.0.0:8889"debug:verbosity: detailedzipkin:endpoint: "http://0.0.0.0:9411/api/v2/spans"service:pipelines:traces:receivers: [otlp]processors: []exporters: [zipkin]metrics:receivers: [otlp]processors: []exporters: [prometheus]logs:receivers: [otlp]exporters: [debug]
修改prometheus.yml
[root@localhost OpenTelemetry]# cat prometheus.yml
global:scrape_interval: 15sevaluation_interval: 15srule_files:- '/etc/prometheus/alert.rules.yml'alerting:alertmanagers:- static_configs:- targets: ['alertmanager:9093']scrape_configs:- job_name: 'otel-collector'metrics_path: '/metrics'scrape_interval: 5sstatic_configs:- targets: ['otel-collector:8889']- job_name: 'prometheus'static_configs:- targets: ['prometheus:9090']- job_name: 'alertmanager'static_configs:- targets: ['alertmanager:9093']
修改alertmanager.yml
[root@localhost OpenTelemetry]# cat alertmanager.yml
route:group_by: ['alertname']receiver: 'email-notifications'receivers:
- name: 'email-notifications'email_configs:- to: 'your-email@example.com'from: 'alertmanager@example.com'smarthost: 'smtp.example.com:587'auth_username: 'your-email@example.com'auth_password: 'your-password'send_resolved: true
修改alert.rules.yml
[root@localhost OpenTelemetry]# cat alert.rules.yml
groups:
- name: examplerules:- alert: HighRequestLatencyexpr: histogram_quantile(0.95, sum(rate(http_server_duration_seconds_bucket[5m])) by (le) > 1for: 10mlabels:severity: criticalannotations:summary: "High request latency on {{ $labels.instance }}"description: "Request latency is {{ $value }} seconds"
修改./etc-nightingale/config.toml
[root@localhost OpenTelemetry]# cat ./etc-nightingale/config.toml
[Global]
RunMode = "release"[Log]
# log write dir
Dir = "logs"
# log level: DEBUG INFO WARNING ERROR
Level = "INFO"
# stdout, stderr, file
Output = "stdout"
# # rotate by time
# KeepHours = 4
# # rotate by size
# RotateNum = 3
# # unit: MB
# RotateSize = 256[HTTP]
# http listening address
Host = "0.0.0.0"
# http listening port
Port = 17000
# https cert file path
CertFile = ""
# https key file path
KeyFile = ""
# whether print access log
PrintAccessLog = false
# whether enable pprof
PProf = false
# expose prometheus /metrics?
ExposeMetrics = true
# http graceful shutdown timeout, unit: s
ShutdownTimeout = 30
# max content length: 64M
MaxContentLength = 67108864
# http server read timeout, unit: s
ReadTimeout = 20
# http server write timeout, unit: s
WriteTimeout = 40
# http server idle timeout, unit: s
IdleTimeout = 120[HTTP.ShowCaptcha]
Enable = false [HTTP.APIForAgent]
Enable = true
# [HTTP.APIForAgent.BasicAuth]
# user001 = "ccc26da7b9aba533cbb263a36c07dcc5"[HTTP.APIForService]
Enable = false
[HTTP.APIForService.BasicAuth]
user001 = "ccc26da7b9aba533cbb263a36c07dcc5"[HTTP.JWTAuth]
# unit: min
AccessExpired = 1500
# unit: min
RefreshExpired = 10080
RedisKeyPrefix = "/jwt/"[HTTP.TokenAuth]
Enable = false
HeaderUserTokenKey = "X-User-Token"[HTTP.ProxyAuth]
# if proxy auth enabled, jwt auth is disabled
Enable = false
# username key in http proxy header
HeaderUserNameKey = "X-User-Name"
DefaultRoles = ["Standard"][HTTP.RSA]
# open RSA
OpenRSA = false[DB]
# postgres: DSN="host=127.0.0.1 port=5432 user=root dbname=n9e_v6 password=1234 sslmode=disable"
DSN="nightingale:Nightingale_324@tcp(10.12.12.80:3306)/n9e_v6?charset=utf8mb4&parseTime=True&loc=Local&allowNativePasswords=true"
# enable debug mode or not
Debug = false
# mysql postgres
DBType = "mysql"
# unit: s
MaxLifetime = 7200
# max open connections
MaxOpenConns = 150
# max idle connections
MaxIdleConns = 50
# enable auto migrate or not
# EnableAutoMigrate = false[Redis]
# address, ip:port or ip1:port,ip2:port for cluster and sentinel(SentinelAddrs)
Address = "redis:6379"
# Username = ""
# Password = ""
# DB = 0
# UseTLS = false
# TLSMinVersion = "1.2"
# standalone cluster sentinel
RedisType = "standalone"
# Mastername for sentinel type
# MasterName = "mymaster"
# SentinelUsername = ""
# SentinelPassword = ""[Alert]
[Alert.Heartbeat]
# auto detect if blank
IP = ""
# unit ms
Interval = 1000
EngineName = "default"# [Alert.Alerting]
# NotifyConcurrency = 10[Center]
MetricsYamlFile = "./etc/metrics.yaml"
I18NHeaderKey = "X-Language"[Center.AnonymousAccess]
PromQuerier = false
AlertDetail = false[Pushgw]
# use target labels in database instead of in series
LabelRewrite = true
ForceUseServerTS = true# [Pushgw.DebugSample]
# ident = "xx"
# __name__ = "xx"# [Pushgw.WriterOpt]
# QueueMaxSize = 1000000
# QueuePopSize = 1000[[Pushgw.Writers]]
# Url = "http://127.0.0.1:8480/insert/0/prometheus/api/v1/write"
Url = "http://victoriametrics:8428/api/v1/write"
# Basic auth username
BasicAuthUser = ""
# Basic auth password
BasicAuthPass = ""
# timeout settings, unit: ms
Headers = ["X-From", "n9e"]
Timeout = 10000
DialTimeout = 3000
TLSHandshakeTimeout = 30000
ExpectContinueTimeout = 1000
IdleConnTimeout = 90000
# time duration, unit: ms
KeepAlive = 30000
MaxConnsPerHost = 0
MaxIdleConns = 100
MaxIdleConnsPerHost = 100
## Optional TLS Config
# UseTLS = false
# TLSCA = "/etc/n9e/ca.pem"
# TLSCert = "/etc/n9e/cert.pem"
# TLSKey = "/etc/n9e/key.pem"
# InsecureSkipVerify = false
# [[Writers.WriteRelabels]]
# Action = "replace"
# SourceLabels = ["__address__"]
# Regex = "([^:]+)(?::\\d+)?"
# Replacement = "$1:80"
# TargetLabel = "__address__"[Ibex]
Enable = true
RPCListen = "0.0.0.0:20090"
springboot 应用启动参数添加
nohup java -server -Xms256m -Xmx512m -javaagent:/路径/opentelemetry-javaagent.jar \
-Dotel.resource.attributes=service.name=myService \
-Dotel.exporter.otlp.endpoint=http://localhost:4318 \
-Dotel.service.name=my-java-app \
-Dotel.traces.exporter=zipkin \
-Dotel.exporter.zipkin.endpoint=http://localhost:9411/api/v2/spans \
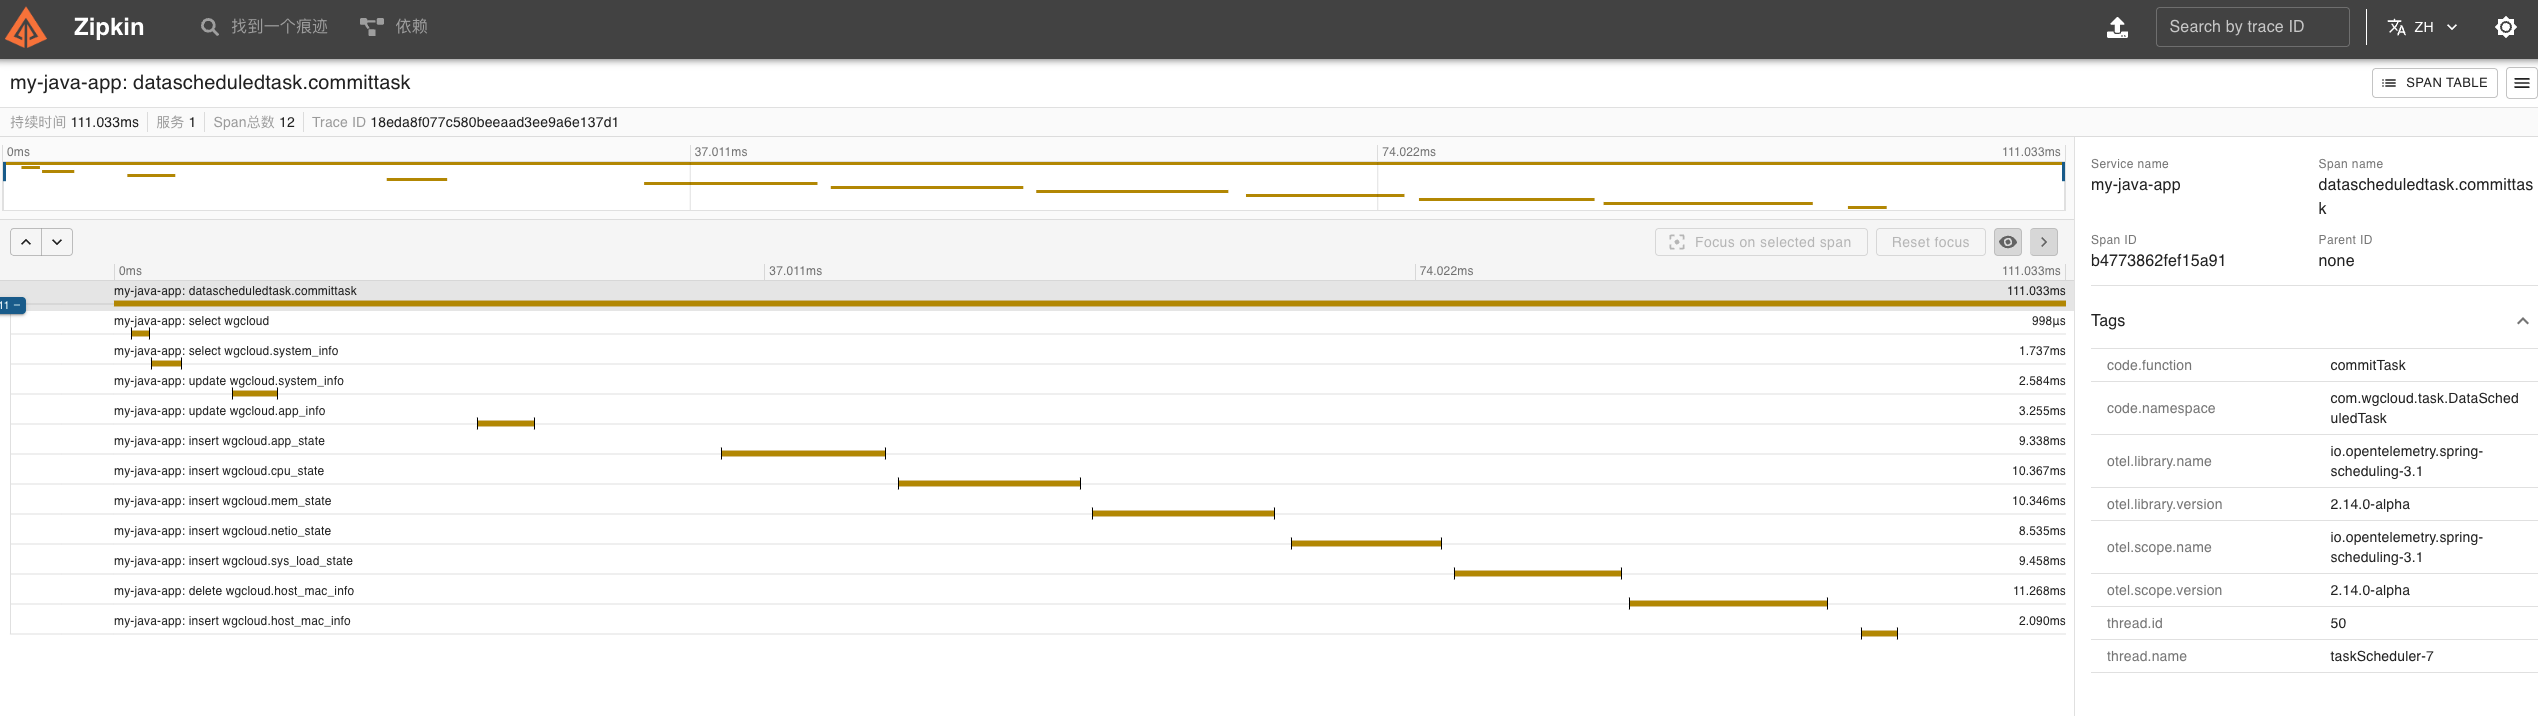
-jar springboot_app.jar >test.log 2>&1 &截图如下:
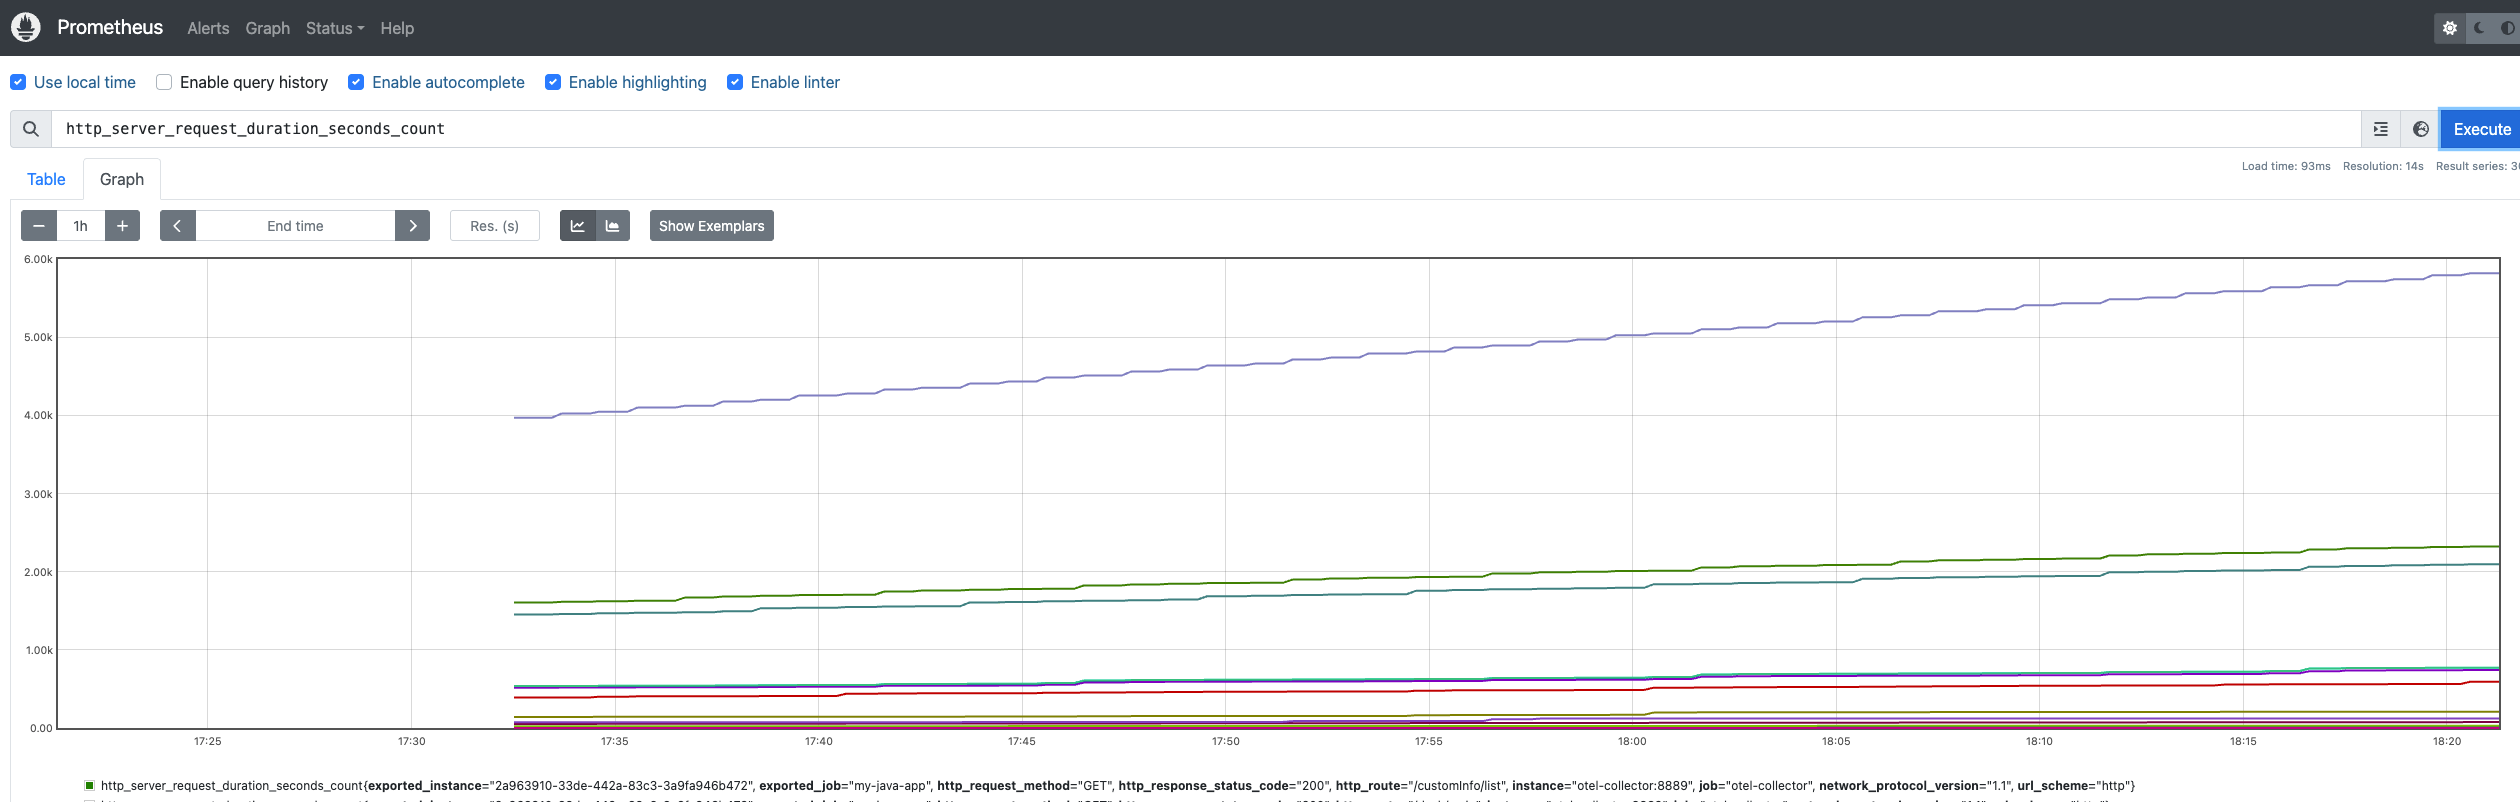
Prometheus监控
http://ip::9090/graph
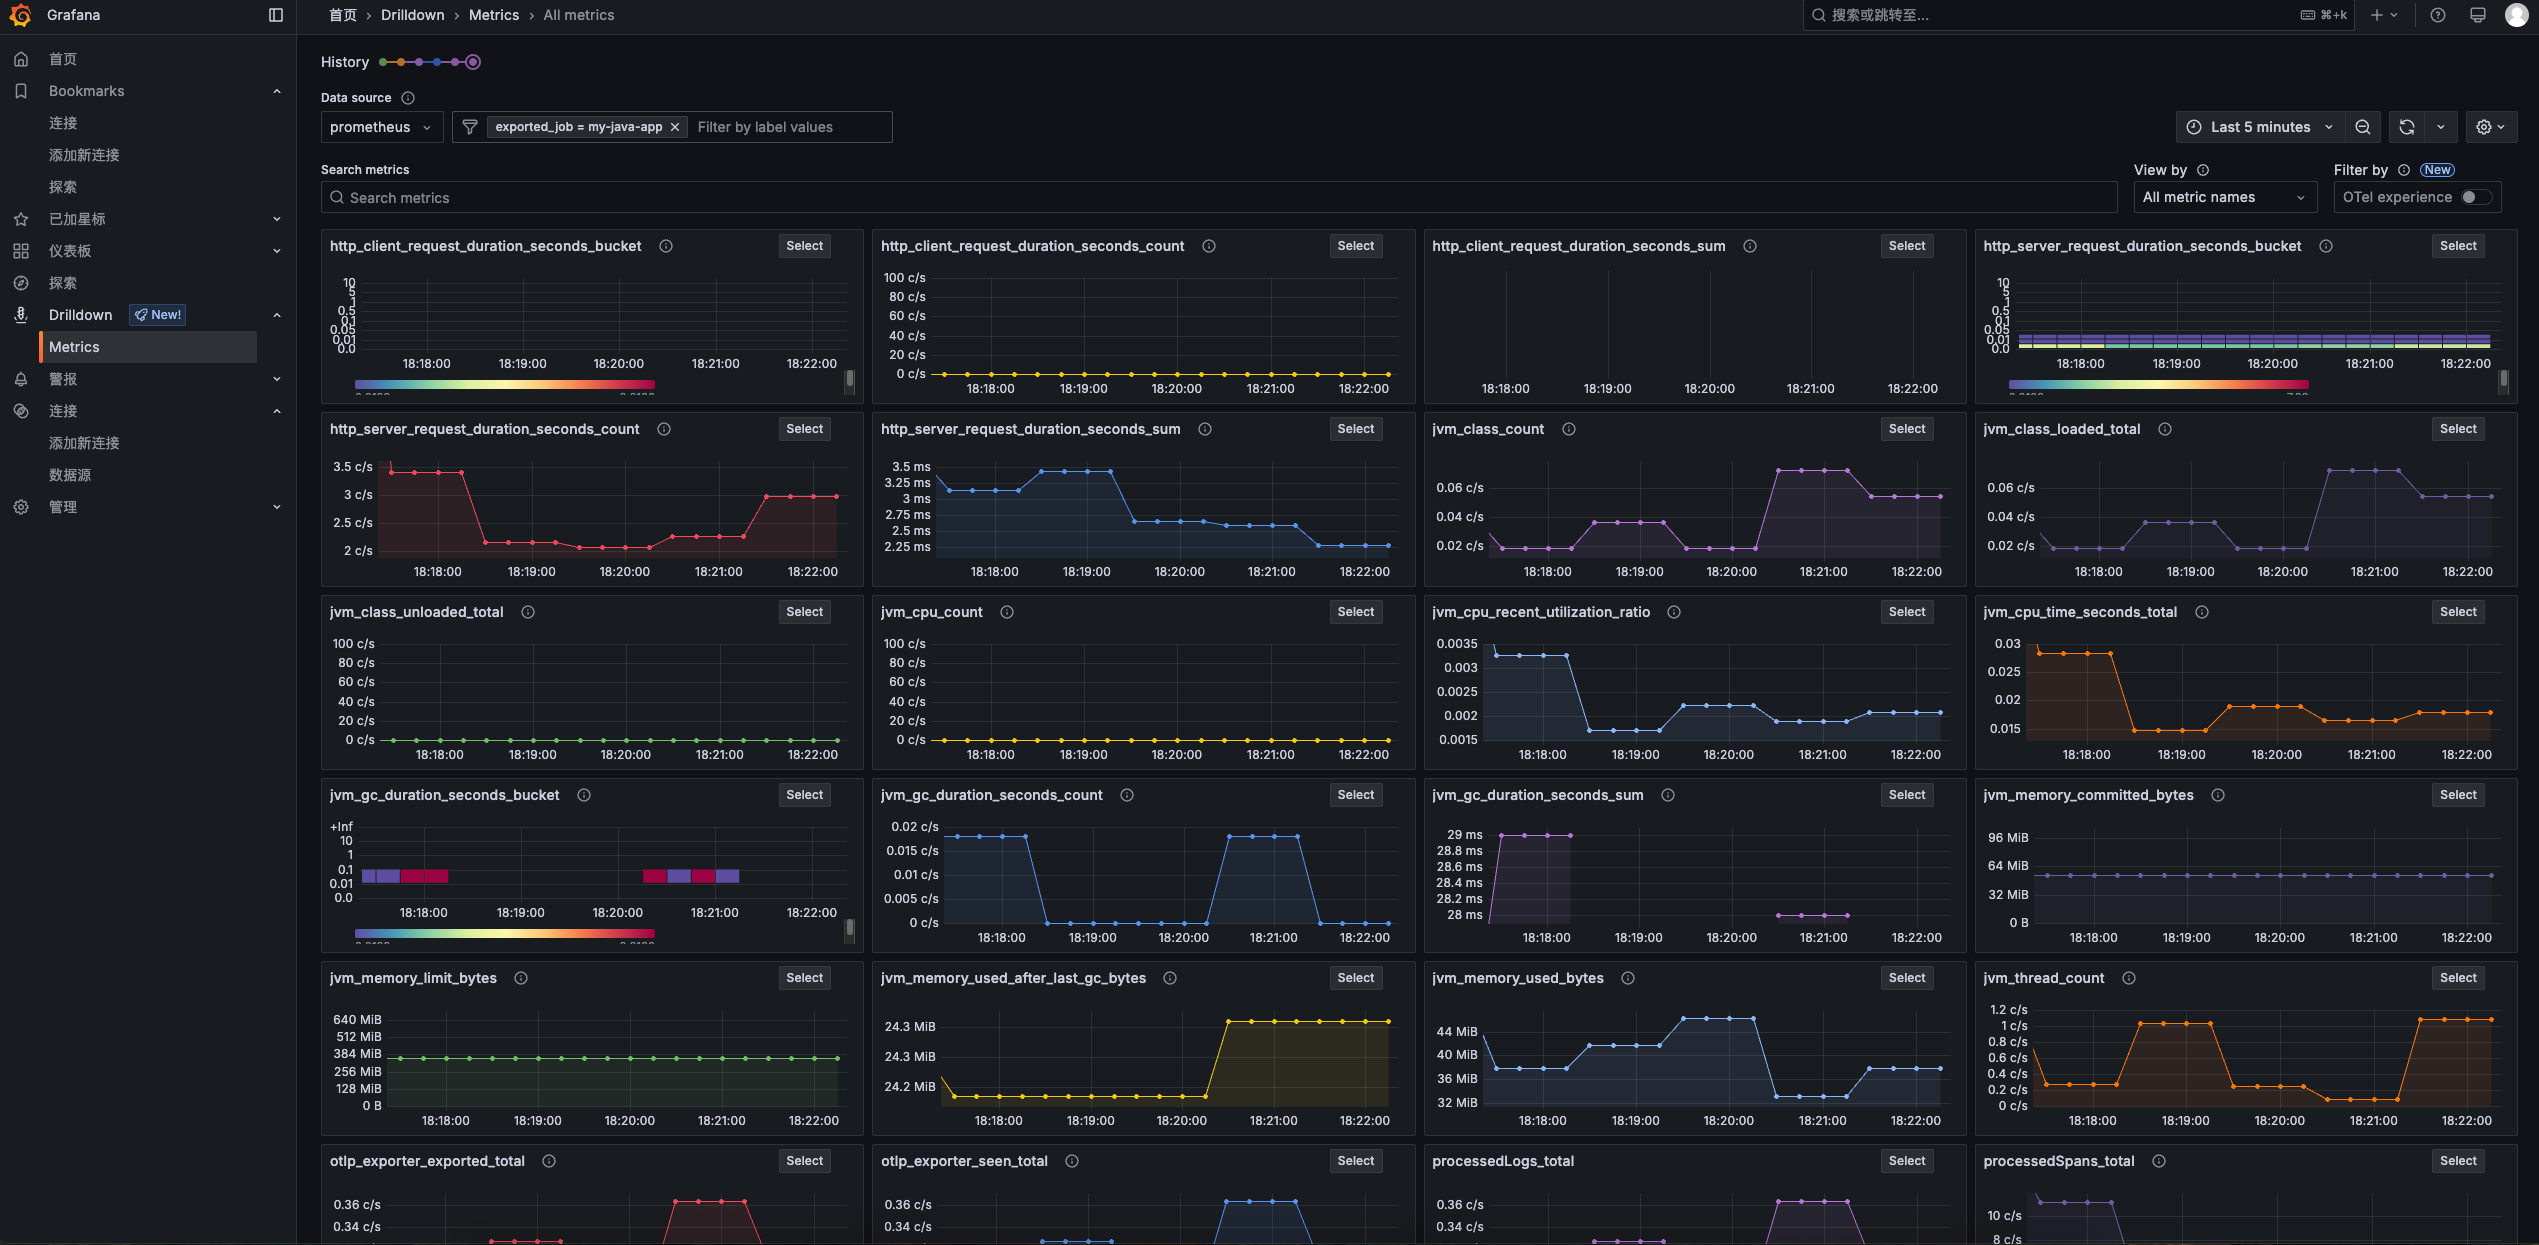
grafana监控
http://IP:3000/
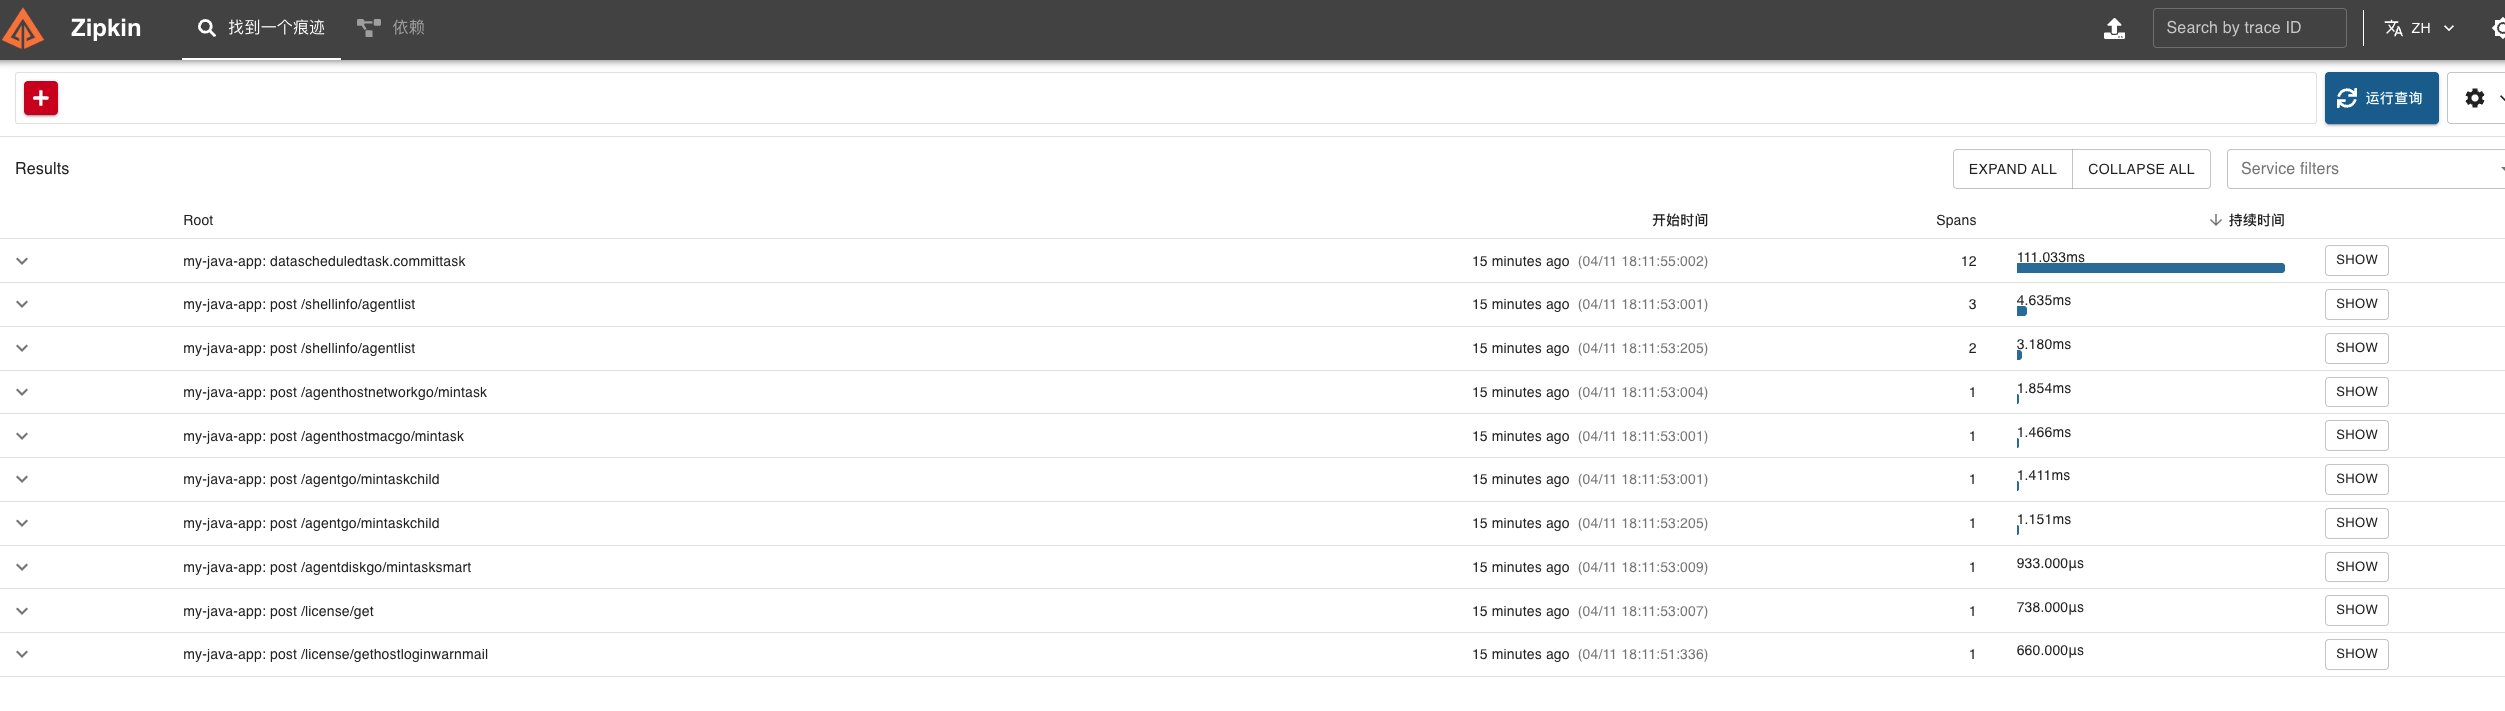
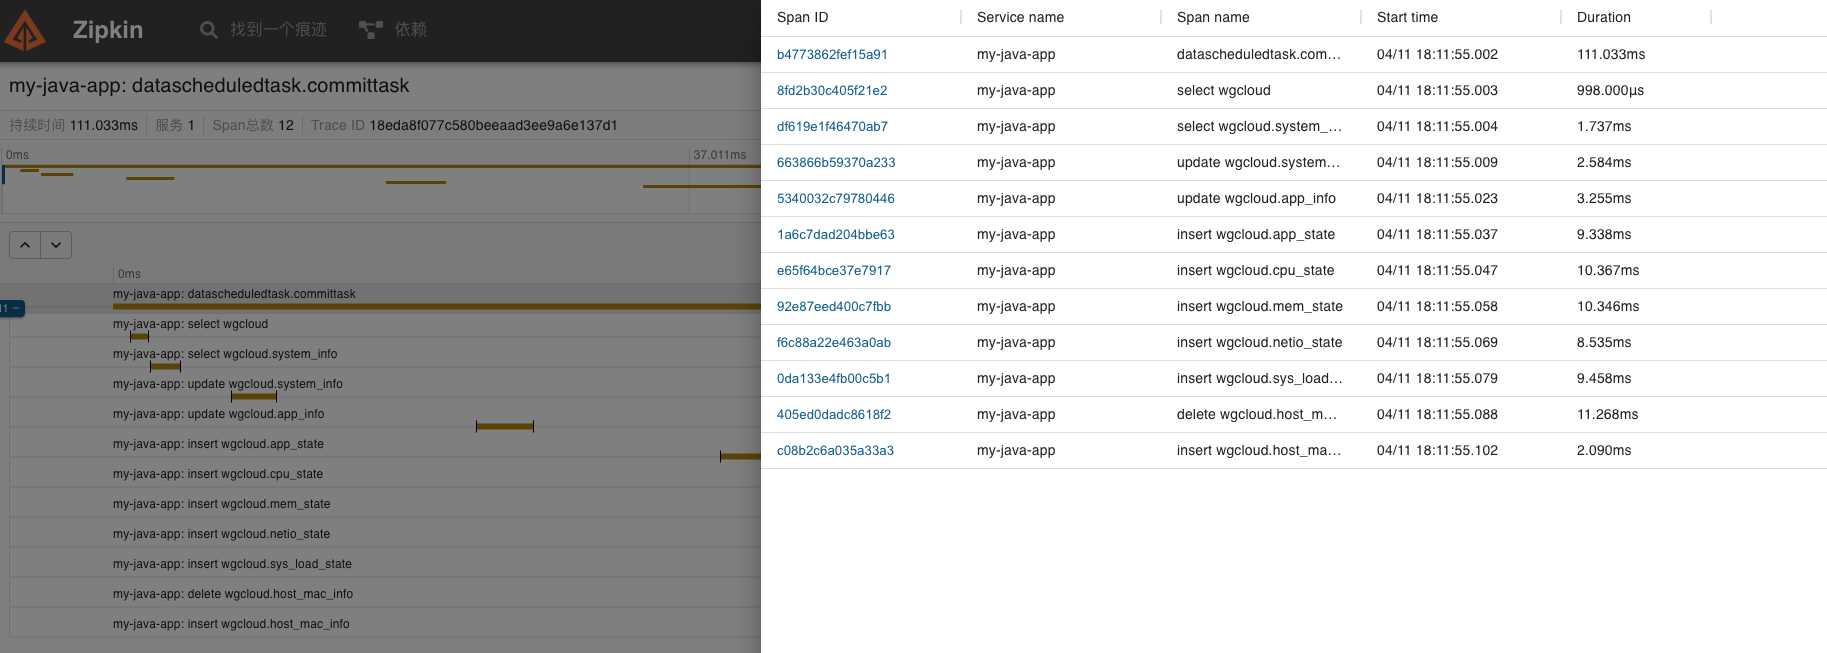
zipkin监控
http://IP:9411/
夜莺监控
http://iP:17000


)


详细讲解)


)

