目录
关键代码:
运行结果:
关键代码:
# 4. 按序号展示社团星级分布 - 热力图样式
plt.subplot(2, 2, 4)
# 创建星级映射为数值
star_mapping = {'五星':4, '四星':3, '三星':2, '星级入围':1}
star_values = df['答辩结果'].map(star_mapping)
plt.scatter(df['序号'], [1]*len(df), c=star_values, cmap='YlOrBr', s=500, alpha=0.7)
plt.yticks([])
plt.title('按序号展示社团星级分布(热力图)', fontproperties=zh_font)
plt.xlabel('序号', fontproperties=zh_font)
# 添加颜色条
cbar = plt.colorbar()
cbar.set_ticks([1, 2, 3, 4])
cbar.set_ticklabels(['星级入围', '三星', '四星', '五星'])
cbar.ax.set_ylabel('星级', fontproperties=zh_font)plt.tight_layout()
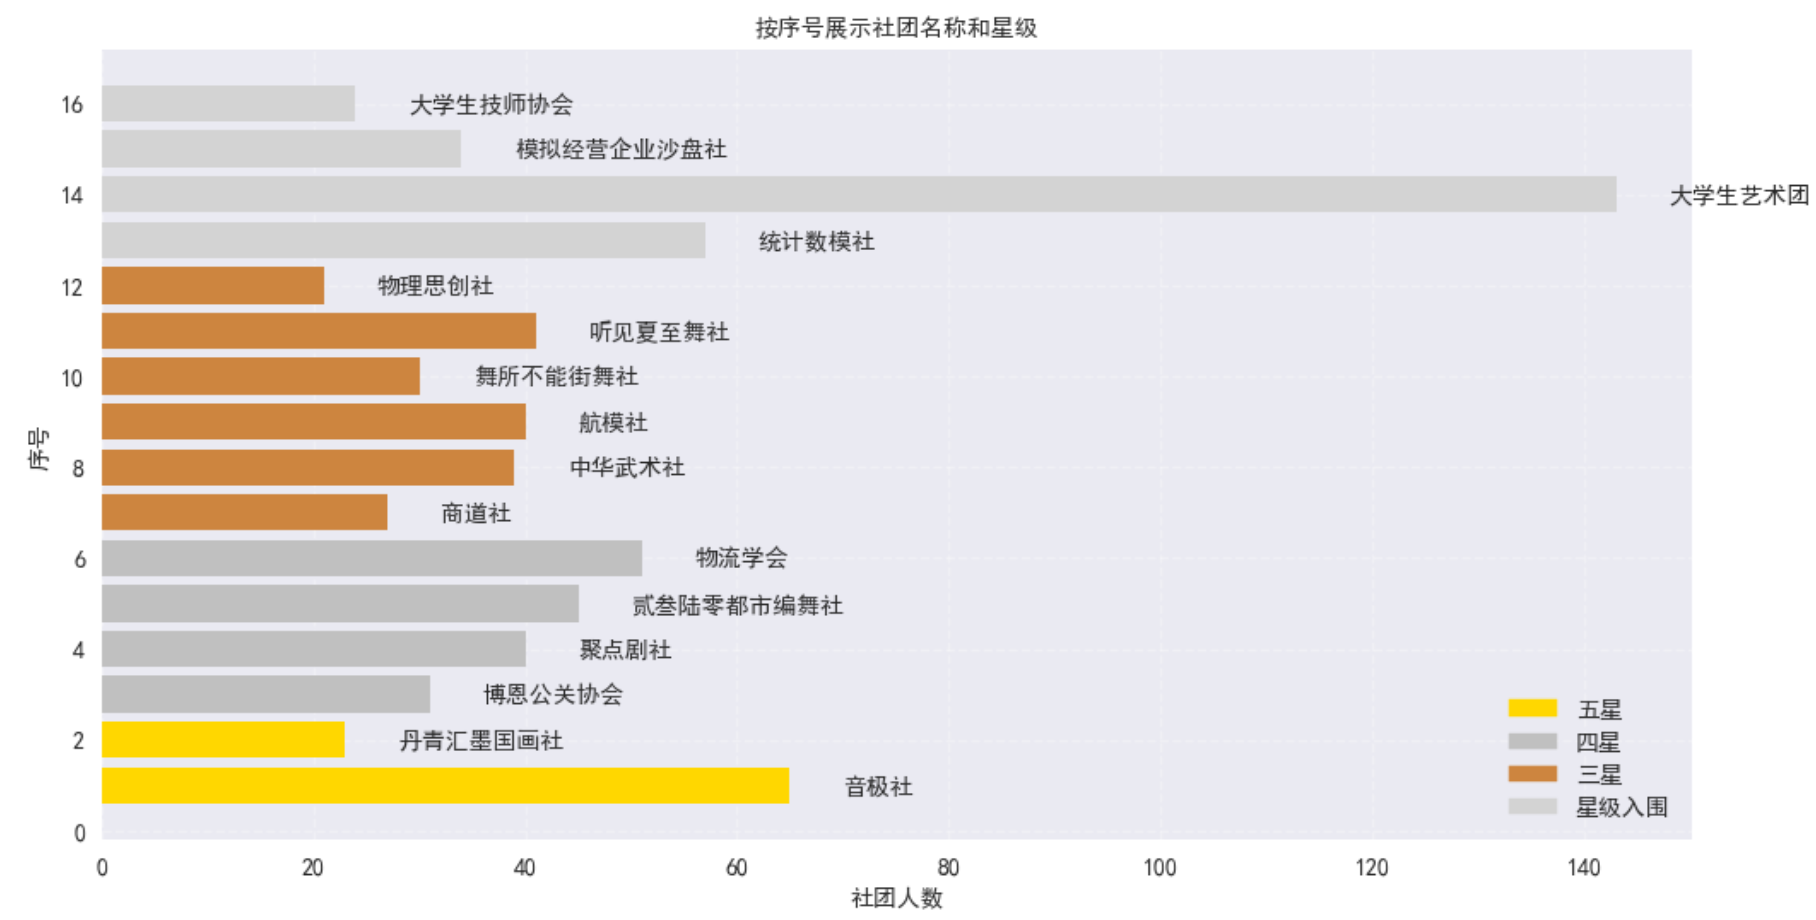
plt.show()# 额外可视化:按序号展示社团名称和星级
plt.figure(figsize=(12, 6))
# 创建星级颜色映射
colors = [star_colors[star] for star in df['答辩结果']]
bars = plt.barh(df['序号'], df['社团人数'], color=colors)
plt.title('按序号展示社团名称和星级', fontproperties=zh_font)
plt.xlabel('社团人数', fontproperties=zh_font)
plt.ylabel('序号', fontproperties=zh_font)
# 在条形上添加社团名称
for i, bar in enumerate(bars):width = bar.get_width()plt.text(width + 5, bar.get_y() + bar.get_height()/2, df.loc[i, '社团名称'], ha='left', va='center', fontproperties=zh_font)
# 添加图例
legend_elements = [plt.Rectangle((0,0),1,1, color='gold', label='五星'),plt.Rectangle((0,0),1,1, color='silver', label='四星'),plt.Rectangle((0,0),1,1, color='peru', label='三星'),plt.Rectangle((0,0),1,1, color='lightgray', label='星级入围')]
plt.legend(handles=legend_elements, prop=zh_font, loc='lower right')
plt.grid(True, linestyle='--', alpha=0.3)
plt.show()运行结果:
声明:著作权归作者所有。商业转载请联系作者获得授权,非商业转载请注明出处。


之ForwardAdd(简化版))


行为型:模板方法模式详解)


