一. 数据读取
1.pd.to_csv & pd.read_csv
细节:
1.pd.read_csv 需要 ignore_index = True or ,index_col=0 否则会有列Unnamed0
2.pickle具有更快的读取速度,与更小的体积。
读取前N行(若不需获取所有数据)
pd.read_csv(path, nrows =5)
pd.read_csv 只包含数据类型 strings, integers and floats,无datetime类似,datetime 会转为object。
解决:parse_dates (如果为True,则仅解析index,若为列表,解析相对应字段)
headers = ['col1', 'col2', 'col3', 'col4']
dtypes = {'col1': 'str', 'col2': 'str', 'col3': 'str', 'col4': 'float'}
parse_dates = ['col1', 'col2']
pd.read_csv(file, sep='\t', header=None, names=headers, dtype=dtypes, parse_dates=parse_dates)
2.pd.to_pkl & pd.read_pkl(推荐)
对象的序列化(serialization)与反序列化(deserialization)
pickle dump (pd.to_pickle)
with open(‘../pathname/source_object_name.pkl’, ‘wb’) as f:pickle.dump(object_name, f)Save:
a dataframe (df),
a matrix or array (X_train_sc),
a fitted model (rand_forest_1),
or anything else you want to save.
pickle load (pd.read_pickle)
with open(‘../pathname/source_object_name.pkl’, ‘rb’) as f:dest_object_name = pickle.load(f)pickle (python2 & python3)
• In python 2 there are 3 different protocols (0, 1, 2) and the default is 0.
• In python 3 there are 5 different protocols (0, 1, 2, 3, 4) and the default is 3.
在python3.8中多了protocols (5)
读取方法:
# !pip3 install pickle5 import pickle5 as pickle
with open(path_to_protocol5, "rb") as fh:   data = pickle.load(fh) # Could also save into a protocol-4 pickle from python 3.6
data.to_pickle(path_to_protocol4)
3.pd.to_excel & pd.read_excel
pd.read_excel(path, sheet=None)
如果有多个sheet,想获取sheet的名称:
import pandas as pd
f = pd.ExcelFile('./data.xlsx')
f.sheet_names  # 获取工作表名称data = pd.DataFrame()
for i in f.sheet_names:d = pd.read_excel('./data.xlsx', sheetname=i)
4.pd.to_json & pd.read_json
其中有个参数:orient
Indication of expected JSON string format.
- Series:
- default is ‘index’
- allowed values are: {‘split’,’records’,’index’,’table’}.
- DataFrame:
- default is ‘columns’
- allowed values are: {‘split’, ‘records’, ‘index’, ‘columns’, ‘values’, ‘table’}.
- The format of the JSON string:
- ‘split’ : dict like {‘index’ -> [index], ‘columns’ -> [columns], ‘data’ -> [values]}
- ‘records’ : list like [{column -> value}, … , {column -> value}]
- ‘index’ : dict like {index -> {column -> value}}
- ‘columns’ : dict like {column -> {index -> value}}
- ‘values’ : just the values array
- ‘table’ : dict like {‘schema’: {schema}, ‘data’: {data}}
json_data = df_data.to_json(orient='index')
df_data = pd.read_json(json_data, orient='index)
5.dict & pd.DataFrame
输入:my_dict = {'i': 1, 'love': 2, 'you': 3}
期望输出:my_df
0
i 1
love 2
you 3
如果字典里key和value是一一对应的,那么直接输入
my_df = pd.DataFrame(my_dict)
会报错“ValueError: If using all scalar values, you must pass an index”。
————————————————
解决方法如下:
1、使用DataFrame函数时指定字典的索引index
my_dict = {'i': 1, 'love': 2, 'you': 3}
my_df = pd.DataFrame(my_dict,index=[0]).T
2、把字典dict转为list后传入DataFrame
my_dict = {'i': 1, 'love': 2, 'you': 3}
my_list = [my_dict]
my_df = pd.DataFrame(my_list).T
3、 使用DataFrame.from_dict函数
my_dict = {'i': 1, 'love': 2, 'you': 3}
my_df = pd.DataFrame.from_dict(my_dict, orient='index')
二. 数据增删改查
1.获取数据or位置
- 已知列名or索引,求在所有列or索引中的位置
col_loc = df.columns.get_loc(col)
idx_loc = df.index.get_loc(idx)
已知在所有列or索引中的位置,求列名or索引
col_name = df.columns.columns[loc]
idx_name = df.index.index[loc] - Series获取最大值最大值/位置
series_A.idxmax()
series_A.argxmax()
series_A.idxmin()
series_A.argxmin() - pandas获取最大值最小值/位置
pd_A.stack().max()
pd_A.stack().idxmax()
pd_A.stack().min()
pd_A.stack().idxmin()
2.插入数据
插入列:
df.insert(loc, column, value, allow_duplicates=False)
# 例:
df.insert(0, 'datetime', times_list)# 默认插入到最后一列
df['datetime'] = times_list
插入行
df = pd.concat([df_above,df_insertRow,df_below],ignore_index = True)2.字符串包含
df['name'].str.contains("ly")3. 索引排序sort_values, sort_index,set_index, reset_index
sort_values()
sort_index()
reset_index(drop=False)
在获得新的index,原来的index变成数据列,保留下来。
不想保留原来的index,使用参数 drop=True,默认 False。
set_index()
注意:
很多会多nan值的操作,可能里边有 参数fill_value,会很方便。
如:
pivot_table
reindex
对原始dataframe采用新的index。类似join的作用。
与pd.daterange常搭配用。
df.index = pd.to_datetime(df.index)
time_range = pd.date_range(dt_start, dt_end, freq='150s')
df = df.reindex(time_range)
df.fillna(method='ffill', inplace=True)
df.fillna(method='bfill', inplace=True)
4. in / not in 筛选数据
筛选出某字段中值 in list的df。
错误写法
data = data[data["idc"] in (["NA61","NA62"])]
data = data[data["idc"] not in (["NA61","NA62"])]
正确写法
data = data[data["idc"].isin (["NA61","NA62"])
data = data[~data["idc"].isin (["NA61","NA62"])
5.多列中最大值组成新的一列
df['z']=df[['x','y']].max(axis=1)
6.找出每行最大的第n个值
def sort_value(column, n):
new_column = column.sort_values(ascending = False)
return new_column.iloc[n-1]
def nth_largest(df):
return df.apply(sort_value)
7.两个DataFrame找交集,差集
交集:
intersected_df = pd.merge(df1, df2, how='inner')差集:
set_diff_df = pd.concat([df2, df1, df1]).drop_duplicates(keep=False)
print(set_diff_df)
三. 数据转换
0. df2str / str2df
def df2str(df):"""1.','连接每行数据,包括columns列。2.'|'聚合为长字符串。"""n = df.shape[0]df = df.astype(str)col_str_list = df.columns.astype(str)whole_str = ','.join(col_str_list)for i in range(n):row = df.iloc[i, :].valuesrow_str = ','.join(row)whole_str = '|'.join([whole_str, row_str])return whole_strdef str2df(whole_str):""""""row_list = whole_str.split('|')cols = row_list[0].split(',')row_data = []for row_str in row_list[1:]:row = row_str.split(',')row_data.append(row)df = pd.DataFrame(data=row_data, columns=cols)return df1.pivot/pivot_table
pd.pivot_table 后有multiIndex
取消:
pd_pivot.reset_index().rename_axis(None, axis=1)
unpivot:
df_unpivot = pd.melt(df, id_vars='col1', value_vars=['col2', 'col3', ...])
2.join/merge/concat
- merge方法主要基于两个dataframe的共同列进行合并;
- join方法主要基于两个dataframe的索引进行合并;
- concat方法是对series或dataframe进行行拼接或列拼接。
DataFrame数据的合并与拼接(merge、join、concat)
3.多行合并为一行
df = df.groupby(['姓名','年龄'])['爱好'].apply(lambda x: ','.join(x))注:这个匿名函数相当于聚合函数。
3. apply
一列生成一列
df[col].apply(lambda x: x+1)多列生成一列(实际上是在行上进行apply)
df.apply(lambda row: row[col1] + row[col2], axis=1)4. 拆分一行为多行 (explode)
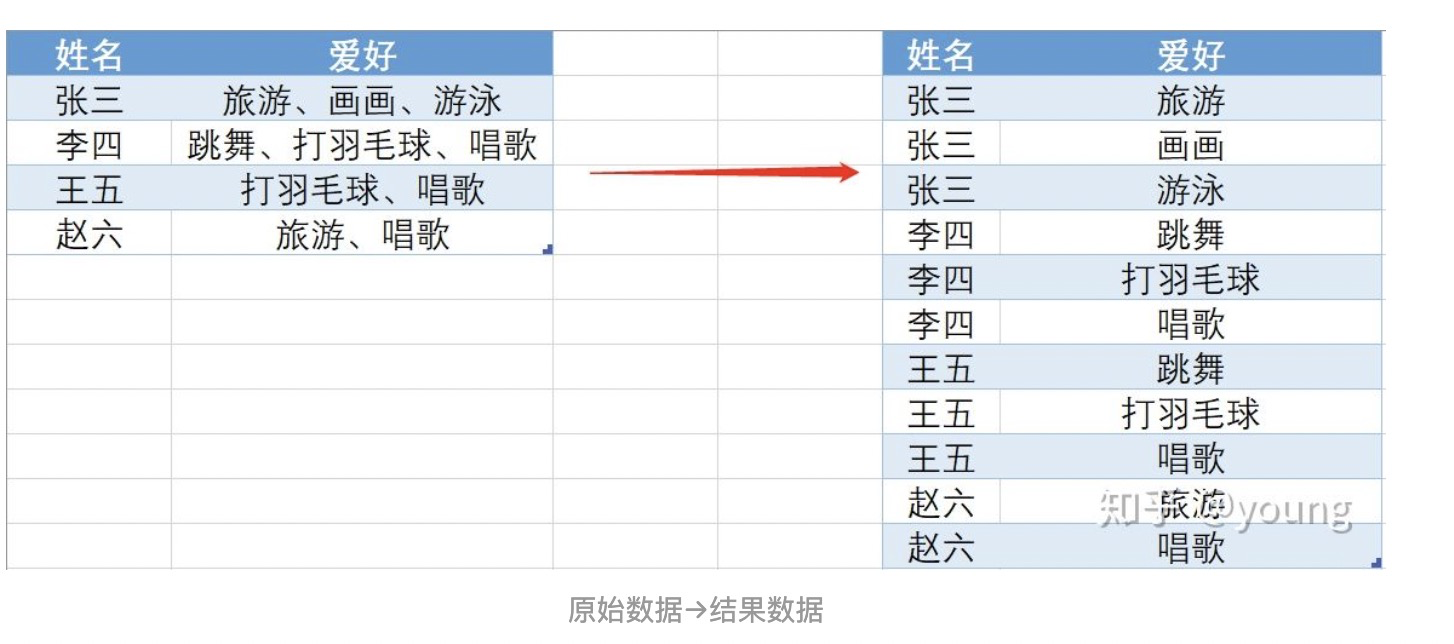
方法一:
##一、读数据
df=pd.read_excel('一行变多行.xlsx')
#二、把“爱好”字段拆分,分为多列
df_name=df['爱好'].str.split('、',expand=True)
#三、把行转列成列
df_name=df_name.stack()
#四、重置索引,并删除多于的索引
df_name = df_name.reset_index(level=1,drop=True)
#五、与原始数据合并
df_name.name='df_name1'
df_new = df.drop(['爱好'], axis=1).join(df_name)
df_new
方法二:
#一、先将‘爱好’字段拆分
df['爱好']=df['爱好'].map(lambda x:x.split(','))
#二、然后直接调用explode()方法
df_new=df.explode('爱好')
5. groupby agg
groupby之后记着reset_index,会变得显示正常。
pandas.core.groupby.DataFrameGroupBy.agg — pandas 0.23.1 documentation
四. 时间datetime相关
pd.to_datetime()
可以直接对字符串转为datetime格式,而不需要用内置函数datetime.datetime
date_time = pd.to_datetime('2020-06-15')pd.Timedelta('1D')
可直接与datetime格式 相加减,而不需要用内置函数datetime.timedelta
unit:  str, default ‘ns’
Denote the unit of the input, if input is an integer.
Possible values:
• ‘W’, ‘D’, ‘T’, ‘S’, ‘L’, ‘U’, or ‘N’
• ‘days’ or ‘day’
• ‘hours’, ‘hour’, ‘hr’, or ‘h’
• ‘minutes’, ‘minute’, ‘min’, or ‘m’
• ‘seconds’, ‘second’, or ‘sec’
• ‘milliseconds’, ‘millisecond’, ‘millis’, or ‘milli’
• ‘microseconds’, ‘microsecond’, ‘micros’, or ‘micro’
• ‘nanoseconds’, ‘nanosecond’, ‘nanos’, ‘nano’, or ‘ns’.
date_end = data_time + pd.Timedelta(1,'D')unix_time <-> datetime
'1643558400' -> '2022-01-31 00:00:00'
注意:直接以下边方式,和系统自带datetime会有8个小时的时差。
1. 如果单位为s
df['date'] = pd.to_datetime(df['date'], unit='s')1. 如果单位为ms
df['date'] = pd.to_datetime(df['date'], unit='ms')
系统自带
1. 如果单位为s
df['date'] = df.unix_time.apply(lambda x: datetime.fromtimestamp(int(x))) 1. 如果单位为ms
df['date'] = df.unix_time.apply(lambda x: datetime.fromtimestamp(int(x/1000)))
datetime -> unix_time
'2022-01-31 00:00:00' -> '1643558400'. # 这个是正常的,没误差
df['unix_time'] = df['date_time'].apply(lambda x: pd.to_datetime(x).strftime('%s'))或者
df['unix_time'] = df['date_time'].apply(lambda x: datetime.strptime(x, '%Y-%m-%d %H:%M:%S').timestamp()*1000)Timestamp
此外,在pandas中,还有一种Timestamp格式。转化容易出错:
在ODPS中,为 datetime 格式,下载到本地为 Timestamp :
alarm_time: Timestamp('2023-02-13 14:52:00')# .timestamp()的方式 直接转化
alarm_time.timestamp(): 1676299920   --有误
datetime.fromtimestamp(int(1676299920)): datetime(2023, 2, 13, 22, 52)  --时间+8h# .timestamp()的方式 设置时区
alarm_time.tz_localize('Asia/Shanghai').timestamp(): 1676271120
datetime.fromtimestamp(int(1676271120)): datetime(2023, 2, 13, 14, 52)  --正常
# Pandas中 tz_localize 和 tz_convert函数,前者用于将时间戳转换为本地时间,而后者可以用于任意时区的转换。# .strftime的方式 直接转化
alarm_time.strftime('%s'): '1676271120'   --正常,不过是string
datetime.fromtimestamp('1676271120'): datetime(2023, 2, 13, 14, 52)  --正常
此外:如果对Timestamp格式先求str,然后转为datetime格式,以上两种方式都可正常运行
alarm_time = str(alarm_time)
alarm_time = datetime.strptime(alarm_time, "%Y-%m-%d %H:%M:%S")
pd.date_range()
按指定间隔,生成时间序列
time_range = pd.date_range(start=start_date, end=end_date, freq='5min')*这里start_date/end_date可以为 string or datetime-like
*这里的time_range是DatetimeIndex格式。
这里经常与df.reindex()搭配使用。
DatetimeIndex to str_list
date_list = time_range.format()
或者
date_list = [datetime.strftime(x,'%F') for x in time_range]
或者
date_list = [x.strftime('%F') for x in time_range]
Sample
df_feat.index = pd.DatetimeIndex(df_feat.index)
df_feat_res = df_feat.resample('5min').mean()
8.rolling
DataFrame.rolling(window, min_periods=None, center=False, win_type=None, on=None, axis=0, closed=None)
window: 也可以省略不写。表示时间窗的大小,注意有两种形式(int or offset)。如果使用int,则数值表示计算统计量的观测值的数量即向前几个数据。如果是offset类型,表示时间窗的大小。offset详解
min_periods:每个窗口最少包含的观测值数量,小于这个值的窗口结果为NA。值可以是int,默认None。offset情况下,默认为1。
center: 把窗口的标签设置为居中。布尔型,默认False,居右
# 滑动聚合
s = [1,2,3,5,6,10,12,14,12,30]
pd.Series(s).rolling(window=3).mean()
# 如果index是datetime形式,也可以直接滑窗
df_w_sum = df_trian.rolling('7D').sum()9.resample
重采样。仅对时间序列。
index = pd.date_range('1/1/2000', periods=9, freq='T')
series = pd.Series(range(9), index=index)# 下采样
s.resample('3T').sum() # 分钟
s.resample('H').sum()  # 小时
s.resample('M').sum()
s.resample('W').mean()# 上采样
s.resample('D').asfreq()
10.fill 插值
可配合resample使用。
ffill 空值取前面的值
bfill 空值取后面的值
interpolate 线性取值
五.绘图plot
df.plot()
使用DataFrame的plot方法绘制图像会按照数据的每一列绘制一条曲线,默认按照列columns的名称在适当的位置展示图例,比matplotlib绘制节省时间,且DataFrame格式的数据更规范,方便向量化及计算。
参数详解:(参考:pandas.DataFrame.plot( )参数详解 - BobPong - 博客园)
DataFrame.plot(x=None, y=None, kind='line', ax=None, subplots=False, sharex=None,sharey=False, layout=None, figsize=None, use_index=True, title=None, grid=None,legend=True, style=None, logx=False, logy=False, loglog=False, xticks=None,yticks=None, xlim=None, ylim=None, rot=None, fontsize=None, colormap=None,position=0.5, table=False, yerr=None, xerr=None, stacked=True/False,sort_columns=False, secondary_y=False, mark_right=True, **kwds)说明
x : label or position, default None #指数据列的标签或位置参数
y : label, position or list of label, positions, default None
kind : str#绘图类型
‘line’ : line plot (default)#折线图
‘bar’ : vertical bar plot#条形图。stacked为True时为堆叠的柱状图
‘barh’ : horizontal bar plot#横向条形图
‘hist’ : histogram#直方图(数值频率分布)
‘box’ : boxplot#箱型图
‘kde’ : Kernel Density Estimation plot#密度图,主要对柱状图添加Kernel 概率密度线
‘density’ : same as ‘kde’
‘area’ : area plot#与x轴所围区域图(面积图)。Stacked=True时,每列必须全部为正或负值,stacked=False时,对数据没有要求
‘pie’ : pie plot#饼图。数值必须为正值,需指定Y轴或者subplots=True
‘scatter’ : scatter plot#散点图。需指定X轴Y轴
‘hexbin’ : hexbin plot#蜂巢图。需指定X轴Y轴
ax : matplotlib axes object, default None#子图(axes, 也可以理解成坐标轴) 要在其上进行绘制的matplotlib subplot对象。如果没有设置,则使用当前matplotlib subplot其中,变量和函数通过改变figure和axes中的元素(例如:title,label,点和线等等)一起描述figure和axes,也就是在画布上绘图。
# ax可以这样直接画两条线
fig, axs = plt.subplots(2, 1)
axs.plot(t, s1, t, s2)
subplots : boolean, default False#是否对列分别作子图
较常用:
layout : tuple (rows, columns) for the layout of subplots#子图的行列布局
figsize : a tuple (width, height) in inches#图片尺寸大小
title : string#图片的标题用字符串 Title to use for the plot
grid : boolean, default None#图片是否有网格
legend : False/True/’reverse’#子图的图例 (默认为True)
style : list or dict#对每列折线图设置线的类型
xticks : sequence#设置x轴刻度值,序列形式(比如列表)
yticks : sequence#设置y轴刻度,序列形式(比如列表)
xlim : float/2-tuple/list#设置坐标轴的范围。数值(最小值),列表或元组(区间范围)
ylim : float/2-tuple/list
rot : int, default None#设置轴标签(轴刻度)的显示旋转度数
fontsize : int, default None#设置轴刻度的字体大小
模版一
fig = plt.figure(figsize=(16, 9), dpi = 80)
ax = fig.add_subplot(1,1,1)# 或
fig, ax = plt.subplots(figsize=(16,9), dpi= 80)    df.plot(ax=ax, grid=True, fontsize=16, ylim=None, legend=True)
plt.tick_params(axis='x', labelsize=16)
plt.tick_params(axis='y', labelsize=16)
plt.xlabel('collect_time', fontsize=16)
plt.ylabel('ylabel', fontsize=16)
plt.legend(loc='upper right', title='location', fontsize='x-large',) #shadow=True,)
plt.savefig('figure0.png', dpi=150)
# plt.show()
模版二(推荐)
1)首先定义画图的画布
2)然后定义子图ax
3)然后加plt的各种设置。
3)用 ax.plot( )函数或者 df.plot(ax = ax)
4)plt.show()
5) plt.close() : close the figure
plt.clf() : clear the figure
fig = plt.figure(figsize=(16,9), dpi = 80)
ax= fig.add_subplot(行,列,位置标)
df.plot(ax = ax)  # 或ax.plot( )
plt.show()
plt.clf() # 或 plt.close()
双y轴图
pandas 自带(需在一个dataframe里的两列):
fig, ax = plt.subplots(figsize=(16,9), dpi= 80)
df.plot(ax=ax, grid=True, fontsize=16, y=['col1','col2'], secondary_y=['col2'])
pandas 常规(两个series, x轴长度必须相等):
fig, ax1 = plt.subplots(figsize=(16,9), dpi= 80)    ax1.set_xlabel('Same X for different Y')
ax1.set_ylabel('Y1')
ax1.set_title("Double Y axis")ax1.plot(df1.index, df1.values, color='red')
# df1.plot(ax=ax1, color='red')ax2 = ax1.twinx()  # this is the important function
ax2.set_ylabel('Y2')ax2.plot(df1.index, df2.values, color='blue')
# df2.plot(ax=ax2, color='blue')
多subplot图
(1)
fig = plt.figure(figsize=(16, 9), dpi = 80)
ax1 = fig.add_subplot(2,1,1)
x = pd_cold_mean_new.index
ax1.plot(x, pd_cold_mean_new.values, color='red')
ax1.set_xlabel('time')
ax1.set_ylabel('cold')
ax2 = fig.add_subplot(2,1,2)
ax2.plot(x, pd_it_mean.values, color='blue')
ax2.set_xlabel('time')
ax2.set_ylabel('it')
(2)
如果存在多个子图,直接df.plot() 会画在一个ax上。
如果想画在多个ax上,直接用参数 subplots=True,而且不用指定分为多少个子图
pandas 自带
df.plot(subplots=True)六、Excel插入图片
def save_to_excel(file_name,category_name,point_name,df_result,patten = ''):imgsize = (1280*2 / 4, 720*2 / 4)# 创建一个新的工作簿wb = openpyxl.Workbook()ws = wb.activews.column_dimensions['B'].width = imgsize[0] * 0.14# 添加表头ws.append(['device_tag', 'Image','llm_check','check'])# # 添加数据与图片df_result = df_result.sort_values('device_tag')for i,[name, image_path,str_check] in enumerate(df_result.values):cell = ws[f'A{i+2}']cell.value = nameif image_path:img = Image(image_path) # 缩放图片img.width, img.height = imgsizews.add_image(img, f'B{i+2}') # 图片 插入 A1 的位置上ws.row_dimensions[i+2].height = imgsize[1] * 0.78 # 修改列第1行的宽cell = ws[f'C{i+2}']cell.value = str_check# 保存为 Excel 文件wb.save(f'result/{file_name}/{category_name}_{point_name}_{patten}.xlsx'))
如何分析MySQL的锁等待问题?)


)


冯诺依曼体系结构,操作系统与系统调用和库函数概念)
——言语理解与表达、判断推理(强化训练))


