文章目录
- Kubernetes 中部署 kube-state-metrics 及 Prometheus 监控配置实战
- 环境准备
- 创建监控命名空间
- 准备配置文件
- 创建 ServiceAccount
- 配置 RBAC 权限
- 部署 kube-state-metrics
- 部署node_exporter(可选)
- 验证服务账号 Token
- Prometheus 配置示例
- 小结
- 验证
- 增加Grafana面板
- 增加prometheus监控数据源
- 添加k8s监控面板(需Grafana这台有网)
- 扩展告警规则
- 总结
Kubernetes 中部署 kube-state-metrics 及 Prometheus 监控配置实战
本文详细介绍了如何在 Kubernetes 集群中部署 kube-state-metrics 组件,配置服务账号(ServiceAccount)、RBAC 授权,并结合 Prometheus 采集 kube-state-metrics 和 node-exporter 指标的全过程,方便你快速搭建集群监控体系。
环境准备
假设你的 Kubernetes 集群节点 IP 为 10.255.101.217,且已经安装了 kubectl,且配置了访问权限。
一台 Master 多节点玩转 Kubernetes:sealos 一键部署实践
使用 Supervisor 和 Systemd 搭建 Prometheus + Alertmanager + Node Exporter + Grafana 全套监控系统
创建监控命名空间
首先,为监控组件创建一个专用的命名空间 monitor-sa:
kubectl create ns monitor-sa
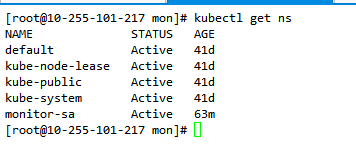
确认命名空间已经创建:
kubectl get ns
准备配置文件
- sa.yaml
- rbac.yaml
- clust.yaml
- jiankong.yaml
- svc.yaml
- node.yaml
创建 ServiceAccount
在 monitor-sa 命名空间中为 kube-state-metrics 创建一个服务账号 kube-state-metrics,方便后续绑定权限。
sa.yaml 文件内容:
apiVersion: v1
kind: ServiceAccount
metadata:# sa 账号名称name: kube-state-metrics# sa 账号名称空间namespace: monitor-sa
执行:
# kubectl apply -f sa.yaml serviceaccount/kube-state-metrics created
配置 RBAC 权限
为了让 kube-state-metrics 能够访问 Kubernetes 资源,创建对应的 ClusterRole:
rbac.yaml 文件内容:
apiVersion: rbac.authorization.k8s.io/v1
kind: ClusterRole
metadata:name: kube-state-metrics
rules:
- apiGroups: [""]resources: ["nodes", "pods", "services", "resourcequotas", "replicationcontrollers", "limitranges", "persistentvolumeclaims", "persistentvolumes", "namespaces", "endpoints"]verbs: ["list", "watch"]
- apiGroups: ["extensions"]resources: ["daemonsets", "deployments", "replicasets"]verbs: ["list", "watch"]
- apiGroups: ["apps"]resources: ["statefulsets"]verbs: ["list", "watch"]
- apiGroups: ["batch"]resources: ["cronjobs", "jobs"]verbs: ["list", "watch"]
- apiGroups: ["autoscaling"]resources: ["horizontalpodautoscalers"]verbs: ["list", "watch"]
- apiGroups: [""]resources: ["nodes/proxy"]verbs: ["get"]
创建 ClusterRoleBinding,将 ClusterRole 绑定给前面创建的 ServiceAccount:
clust.yaml 文件内容:
apiVersion: rbac.authorization.k8s.io/v1
kind: ClusterRoleBinding
metadata:name: kube-state-metrics
roleRef:apiGroup: rbac.authorization.k8s.iokind: ClusterRolename: kube-state-metrics
subjects:
- kind: ServiceAccountname: kube-state-metricsnamespace: monitor-sa
应用:
# kubectl apply -f rbac.yamlclusterrole.rbac.authorization.k8s.io/kube-state-metrics created# kubectl apply -f clust.yamlclusterrolebinding.rbac.authorization.k8s.io/kube-state-metrics created
部署 kube-state-metrics
准备 Deployment 配置文件 jiankong.yaml:
apiVersion: apps/v1
kind: Deployment
metadata:labels:app.kubernetes.io/name: kube-state-metricsname: kube-state-metricsnamespace: monitor-sa
spec:replicas: 1selector:matchLabels:app.kubernetes.io/name: kube-state-metricstemplate:metadata:labels:app.kubernetes.io/name: kube-state-metricsspec:serviceAccountName: kube-state-metricscontainers:- image: registry.k8s.io/kube-state-metrics/kube-state-metrics::latestimagePullPolicy: IfNotPresentname: kube-state-metricsports:- containerPort: 8080name: http-metricsprotocol: TCP
在准备它的svc.yaml
apiVersion: v1
kind: Service
metadata:name: kube-state-metricsnamespace: monitor-sa
spec:ports:- name: http-metricsport: 8080protocol: TCP#targetPort: 8080targetPort: http-metrics- name: telemetryport: 8081protocol: TCPtargetPort: telemetryselector:app.kubernetes.io/name: kube-state-metricssessionAffinity: Nonetype: NodePort
执行部署:
# kubectl apply -f jiankong.yaml
deployment.apps/kube-state-metrics created
# kubectl apply -f svc.yaml
service/kube-state-metrics created
查看 Pod 状态:
# kubectl -n monitor-sa get podsNAME                                  READY   STATUS    RESTARTS   AGE
kube-state-metrics-5b7cf967d6-knhww   1/1     Running   0          40m
查看映射的端口
# kubectl -n monitor-sa get svc
NAME                 TYPE       CLUSTER-IP        EXTERNAL-IP   PORT(S)                         AGE
kube-state-metrics   NodePort   192.168.144.178   <none>        8080:32470/TCP,8081:31602/TCP   75m
部署node_exporter(可选)
集群node很多,我们不会跟传统模式似的,一个一个去部署node_exporter,这个时候我们就再k8s中创建个DaemonSet,让它自己根据k8S的node节点进行创建
准备node.yaml
apiVersion: apps/v1
kind: DaemonSet
metadata:name: node-exporternamespace: monitor-sa
spec:selector:matchLabels:app: node-exportertemplate:metadata:labels:app: node-exporterspec:hostPID: truehostIPC: truehostNetwork: truecontainers:- name: node-exporterimage: quay.io/prometheus/node-exporter:v1.9.1imagePullPolicy: IfNotPresentports:- containerPort: 9100name: metricsresources:requests:cpu: "150m"limits:cpu: "500m"securityContext:privileged: true  # 若非必要,可设为 false 增强安全args:- --path.procfs=/host/proc- --path.sysfs=/host/sys- --collector.filesystem.ignored-mount-points=^/(sys|proc|dev|host|etc)($|/)volumeMounts:- name: devmountPath: /host/devreadOnly: true- name: procmountPath: /host/procreadOnly: true- name: sysmountPath: /host/sysreadOnly: true- name: rootfsmountPath: /rootfsreadOnly: truetolerations:- key: "node-role.kubernetes.io/control-plane"operator: "Exists"effect: "NoSchedule"volumes:- name: prochostPath:path: /proc- name: devhostPath:path: /dev- name: syshostPath:path: /sys- name: rootfshostPath:path: /
执行部署:
# kubectl apply -f node.yaml
daemonset.apps/node-exporter created
查看pod状态
# kubectl -n monitor-sa get nodes -o wide NAME             STATUS   ROLES                  AGE   VERSION   INTERNAL-IP      EXTERNAL-IP   OS-IMAGE                KERNEL-VERSION               CONTAINER-RUNTIME
10-255-101-152   Ready    <none>                 41d   v1.22.0   10.255.101.152   <none>        CentOS Linux 7 (Core)   4.18.9-1.el7.elrepo.x86_64   containerd://1.4.3
10-255-101-216   Ready    <none>                 41d   v1.22.0   10.255.101.216   <none>        CentOS Linux 7 (Core)   4.18.9-1.el7.elrepo.x86_64   containerd://1.4.3
10-255-101-217   Ready    control-plane,master   41d   v1.22.0   10.255.101.217   <none>        CentOS Linux 7 (Core)   4.18.9-1.el7.elrepo.x86_64   containerd://1.4.3
10-255-101-82    Ready    <none>                 41d   v1.22.0   10.255.101.82    <none>        CentOS Linux 7 (Core)   4.18.9-1.el7.elrepo.x86_64   containerd://1.4.3# kubectl -n monitor-sa get pods -o wide NAME                                  READY   STATUS    RESTARTS   AGE   IP               NODE             NOMINATED NODE   READINESS GATES
kube-state-metrics-5b7cf967d6-tk5kr   1/1     Running   0          87m   192.168.154.12   10-255-101-82    <none>           <none>
node-exporter-7sc7c                   1/1     Running   0          72m   10.255.101.152   10-255-101-152   <none>           <none>
node-exporter-d2w2z                   1/1     Running   0          72m   10.255.101.216   10-255-101-216   <none>           <none>
node-exporter-rc6bt                   1/1     Running   0          72m   10.255.101.82    10-255-101-82    <none>           <none>
验证服务账号 Token
通过命令查看 default 服务账号的 token:
# kubectl -n monitor-sa get secrets
NAME                             TYPE                                  DATA   AGE
default-token-wrbmj              kubernetes.io/service-account-token   3      5m9s
kube-state-metrics-token-bkrsr   kubernetes.io/service-account-token   3      3m41s# kubectl -n monitor-sa describe secrets kube-state-metrics-token-bkrsr
将显示包含 token 的详细信息,可用于 Prometheus 授权。
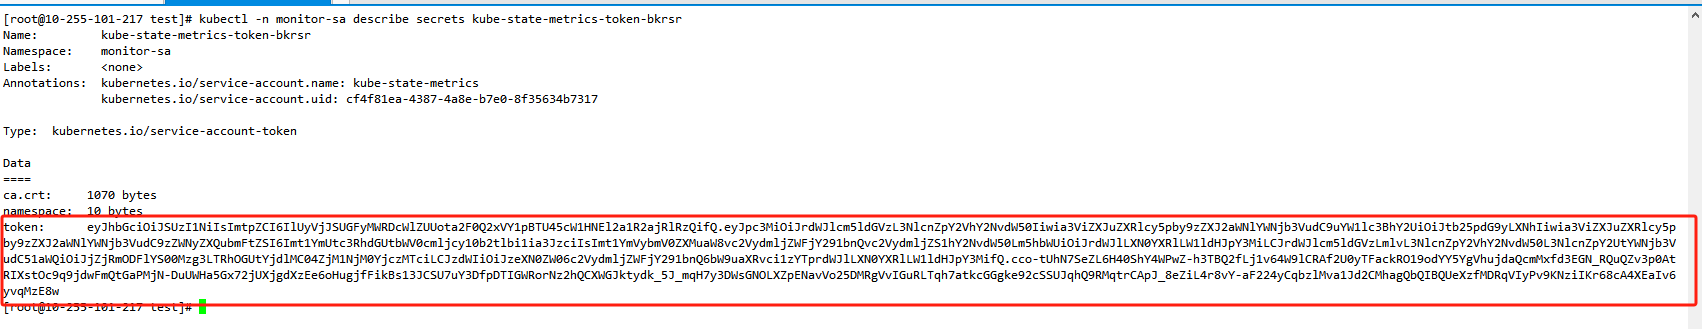
!!!把token内容,复制到prometheus的服务器里
/data/app/prometheus/token
[root@10-255-101-216 prometheus]# cat token
eyJhbGciOiJSUzI1NiIsImtpZCI6IlUyVjJSUGFyMWRDcWlZUUota2F0Q2xVY1pBTU45cW1HNEl2a1R2ajRlRzQifQ.eyJpc3MiOiJrdWJlcm5ldGVzL3NlcnZpY2VhY2NvdW50Iiwia3ViZXJuZXRlcy5pby9zZXJ2aWNlYWNjb3VudC9uYW1lc3BhY2UiOiJtb25pdG9yLXNhIiwia3ViZXJuZXRlcy5pby9zZXJ2aWNlYWNjb3VudC9zZWNyZXQubmFtZSI6Imt1YmUtc3RhdGUtbWV0cmljcy10b2tlbi1ia3JzciIsImt1YmVybmV0ZXMuaW8vc2VydmljZWFjY291bnQvc2VydmljZS1hY2NvdW50Lm5hbWUiOiJrdWJlLXN0YXRlLW1ldHJpY3MiLCJrdWJlcm5ldGVzLmlvL3NlcnZpY2VhY2NvdW50L3NlcnZpY2UtYWNjb3VudC51aWQiOiJjZjRmODFlYS00Mzg3LTRhOGUtYjdlMC04ZjM1NjM0YjczMTciLCJzdWIiOiJzeXN0ZW06c2VydmljZWFjY291bnQ6bW9uaXRvci1zYTprdWJlLXN0YXRlLW1ldHJpY3MifQ.cco-tUhN7SeZL6H40ShY4WPwZ-h3TBQ2fLj1v64W9lCRAf2U0yTFackRO19odYY5YgVhujdaQcmMxfd3EGN_RQuQZv3p0AtRIXstOc9q9jdwFmQtGaPMjN-DuUWHa5Gx72jUXjgdXzEe6oHugjfFikBs13JCSU7uY3DfpDTIGWRorNz2hQCXWGJktydk_5J_mqH7y3DWsGNOLXZpENavVo25DMRgVvIGuRLTqh7atkcGGgke92cSSUJqhQ9RMqtrCApJ_8eZiL4r8vY-aF224yCqbzlMva1Jd2CMhagQbQIBQUeXzfMDRqVIyPv9KNziIKr68cA4XEaIv6yvqMzE8w
[root@10-255-101-216 prometheus]#
Prometheus 配置示例
将上面获取到的服务账号 Token 保存到 Prometheus 服务器 /data/app/prometheus/token 文件中。
Prometheus 配置文件 prometheus.yml 中增加如下内容,实现采集 kube-state-metrics 和 node-exporter 指标:
global:scrape_interval: 15sevaluation_interval: 15s# Load rules once and periodically evaluate them according to the global 'evaluation_interval'.
rule_files:# - "first_rules.yml"# - "second_rules.yml"scrape_configs:- job_name: "prometheus"static_configs:- targets: ["localhost:9090"]# 上边查看的svc的端口映射地址- job_name: kube-state-metricsstatic_configs:- targets: ['10.255.101.217:32470']labels:env: test20250528# 采集 node-exporter 指标- job_name: 'k8s-node-exporter'kubernetes_sd_configs:- role: podapi_server: https://10.255.101.217:6443bearer_token_file: /data/app/prometheus/tokentls_config:insecure_skip_verify: truerelabel_configs:- source_labels: [__meta_kubernetes_pod_label_app]regex: node-exporteraction: keep- target_label: envreplacement: test20250528- source_labels: [__meta_kubernetes_pod_ip]target_label: __address__replacement: '${1}:9100'action: replace- source_labels: [__meta_kubernetes_pod_node_name]target_label: nodeaction: replace- source_labels: [__meta_kubernetes_namespace]target_label: kubernetes_namespaceaction: replace- source_labels: [__meta_kubernetes_pod_name]target_label: kubernetes_pod_nameaction: replace# 采集 cadvisor 指标- job_name: test20250528-cadvisorhonor_timestamps: truemetrics_path: /metricsscheme: httpskubernetes_sd_configs:- api_server: https://10.255.101.217:6443role: nodebearer_token_file: /data/app/prometheus/tokentls_config:insecure_skip_verify: truebearer_token_file: /data/app/prometheus/tokentls_config:insecure_skip_verify: truerelabel_configs:- action: labelmapregex: __meta_kubernetes_node_label_(.+)- separator: ;regex: (.*)target_label: __address__replacement: 10.255.101.217:6443action: replace- source_labels: [__meta_kubernetes_node_name]separator: ;regex: (.+)target_label: __metrics_path__replacement: /api/v1/nodes/${1}/proxy/metrics/cadvisoraction: replace- source_labels: [kubernetes_io_hostname]separator: ;regex: (.+)target_label: env_kubernetes_io_hostnamereplacement: test20250528-${1}action: replace- source_labels: [kubernetes_io_hostname]separator: ;regex: (.+)target_label: envreplacement: test20250528action: replace
小结
通过以上步骤,你已经完成了以下工作:
- 创建专用命名空间
monitor-sa - 创建 kube-state-metrics 服务账号和对应的 RBAC 授权
- 部署 kube-state-metrics 监控组件
- 通过 Prometheus 采集 kube-state-metrics 和 node-exporter 指标
- 配置了 Prometheus 访问 Kubernetes API Server 的安全 Token
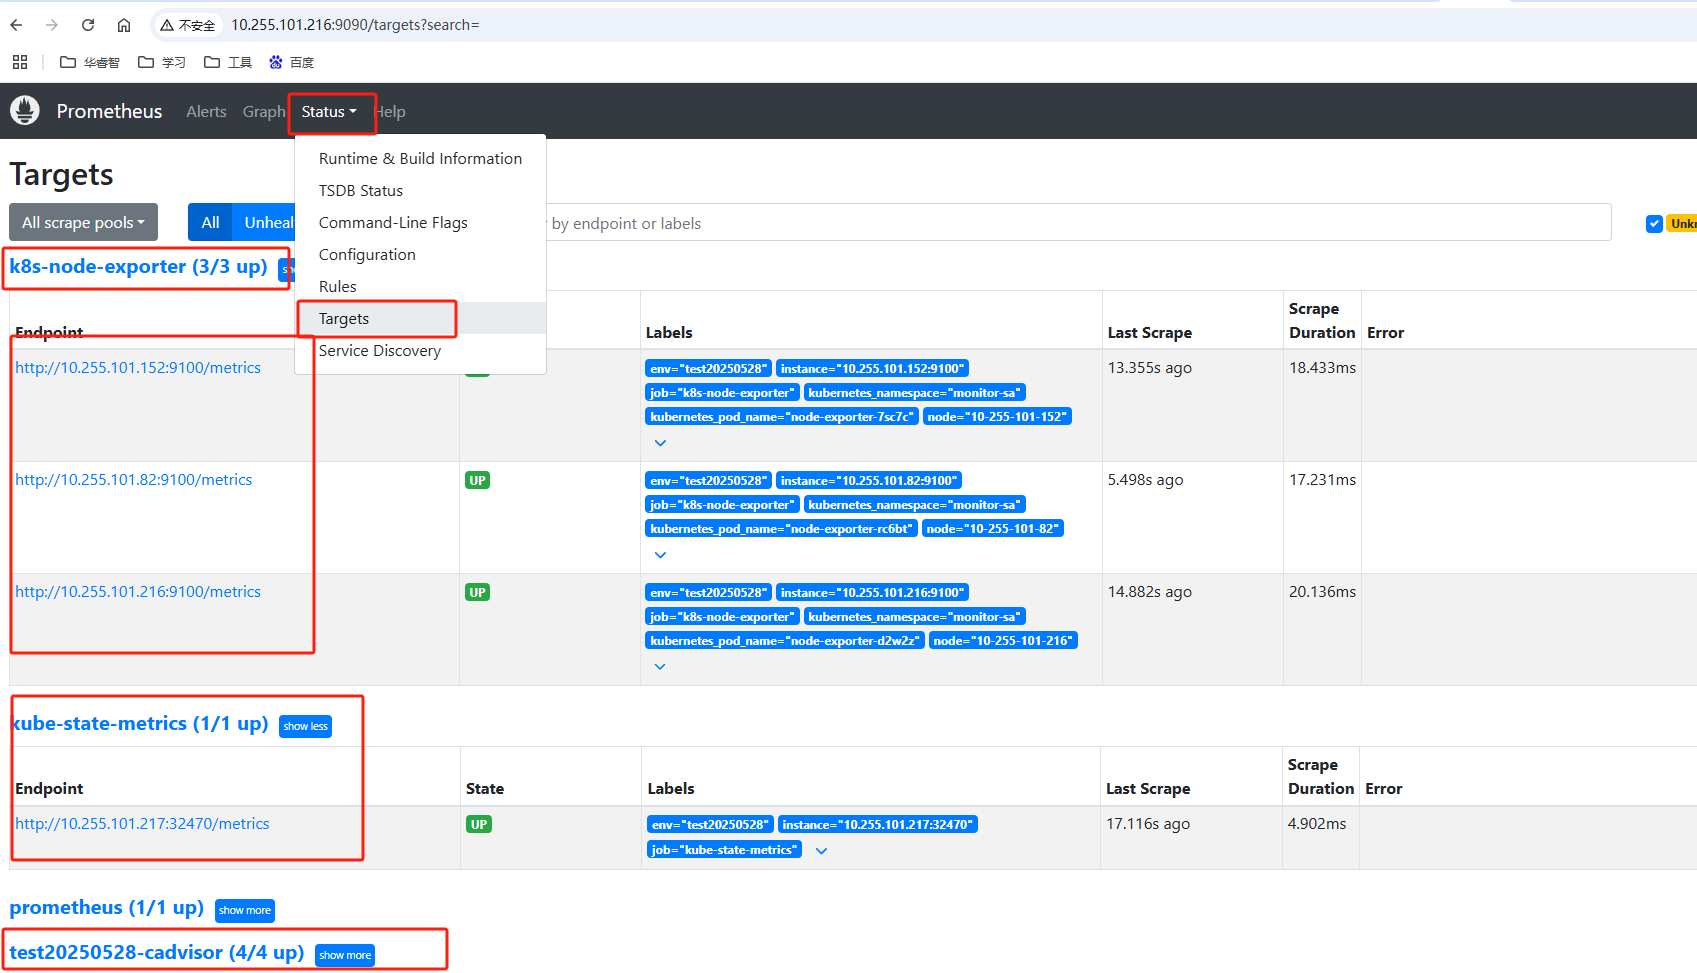
验证
增加Grafana面板
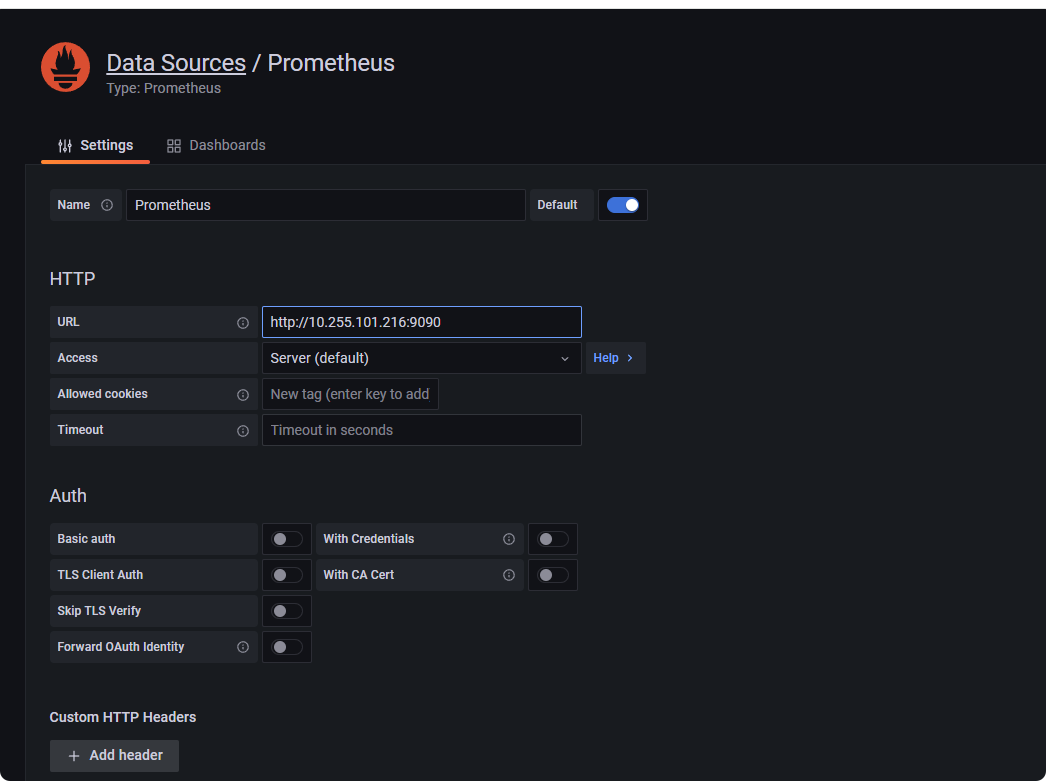
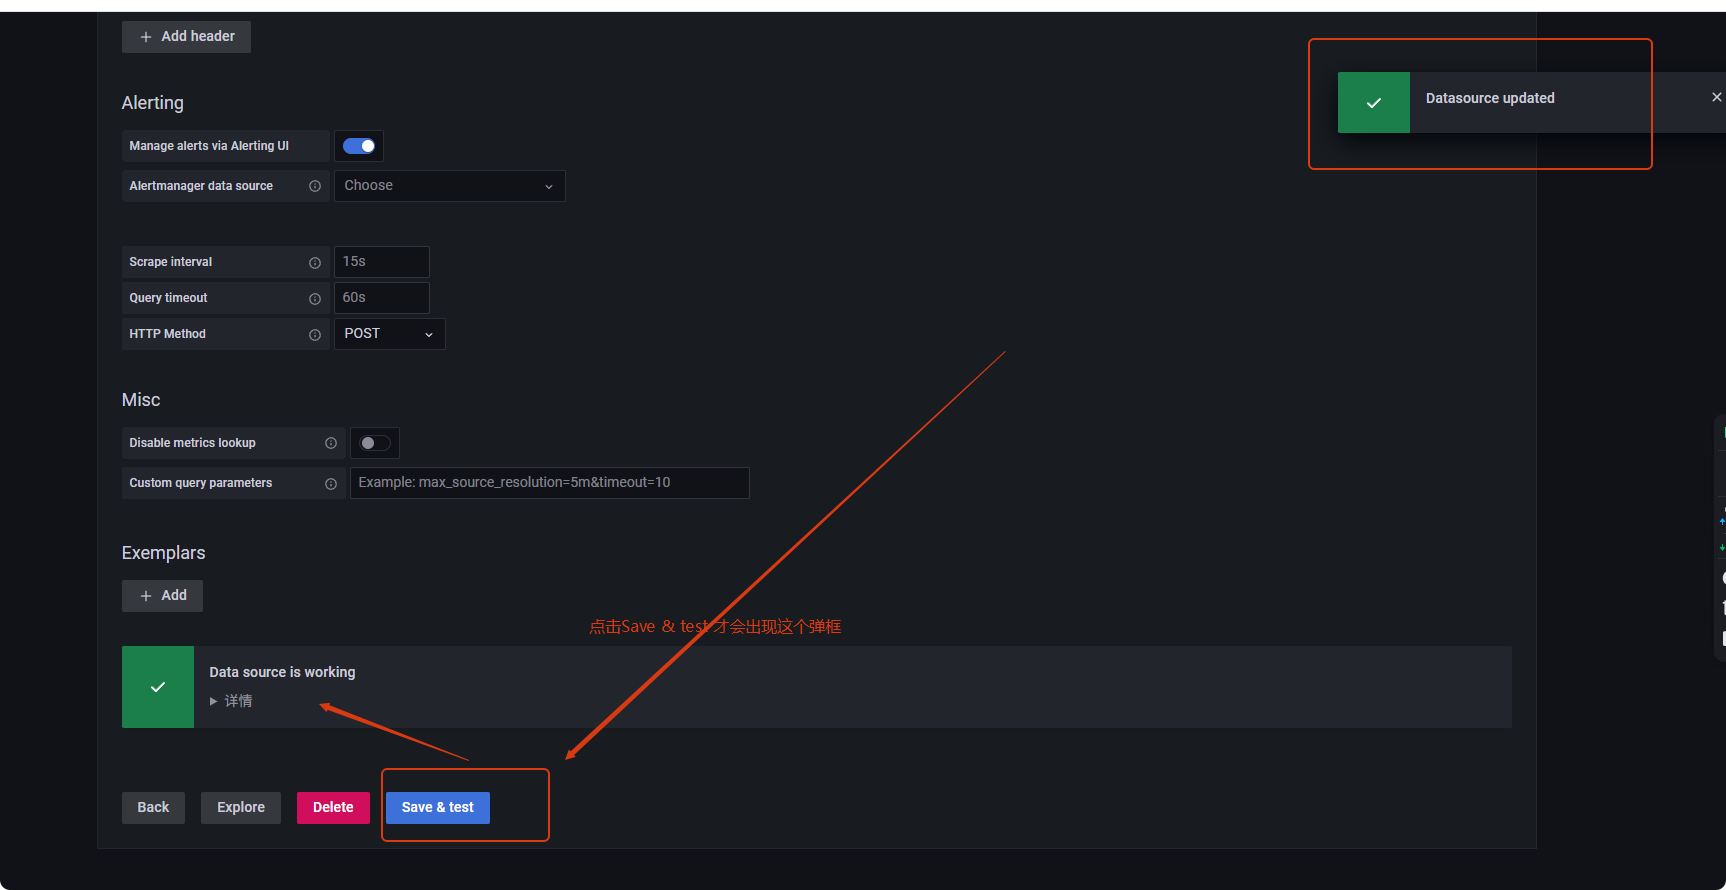
增加prometheus监控数据源
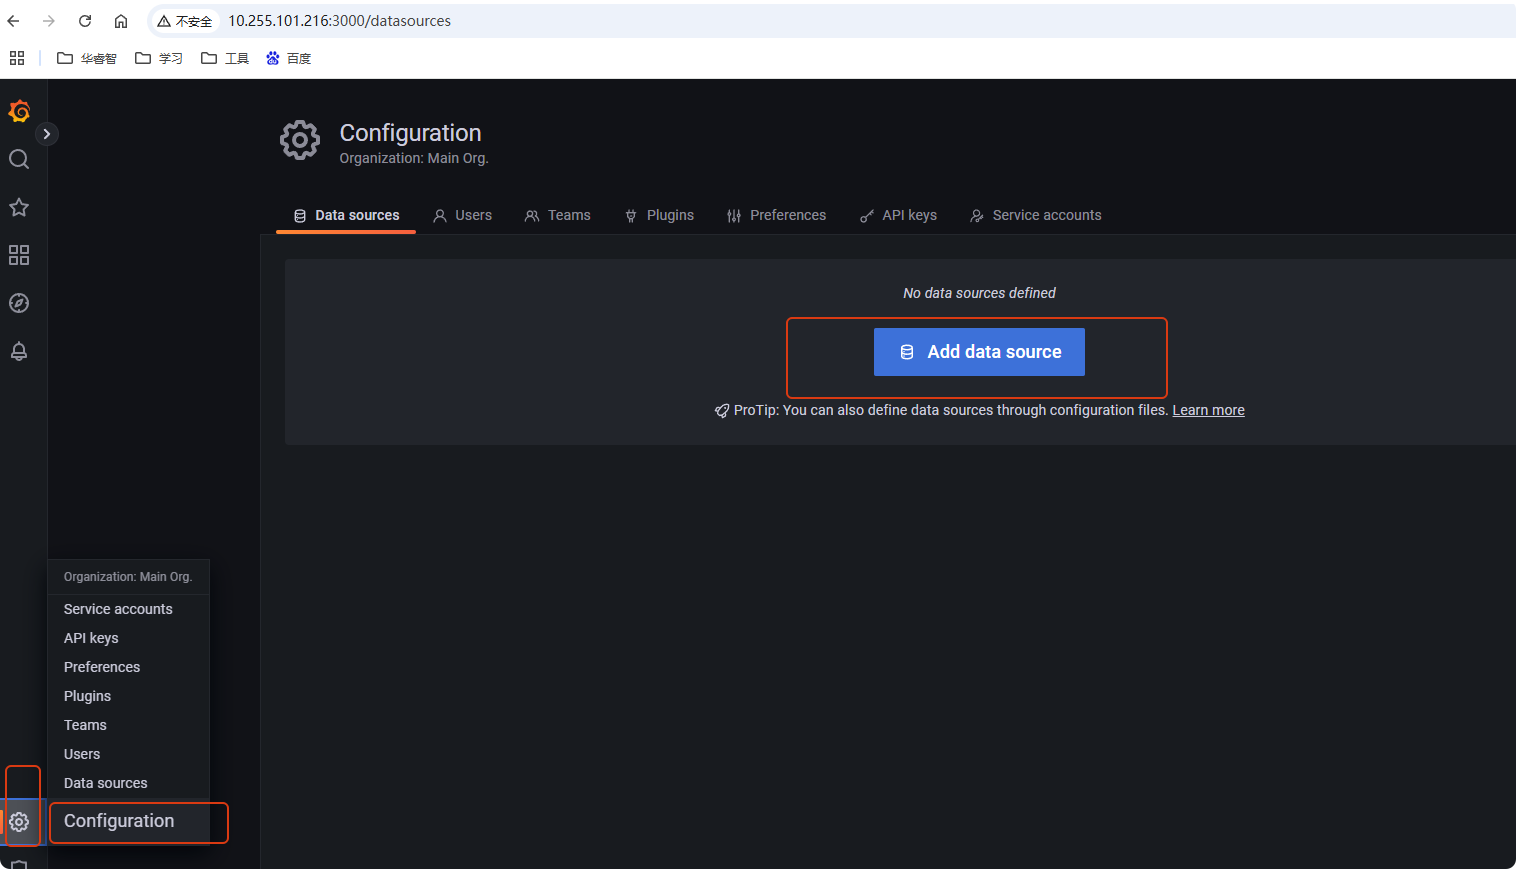
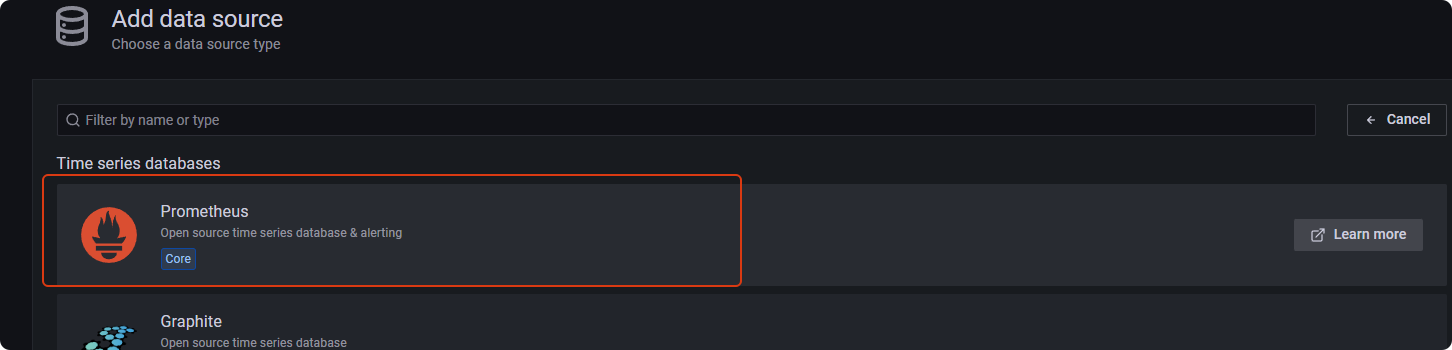
我是只修改了URL,其他没任何修改
添加k8s监控面板(需Grafana这台有网)
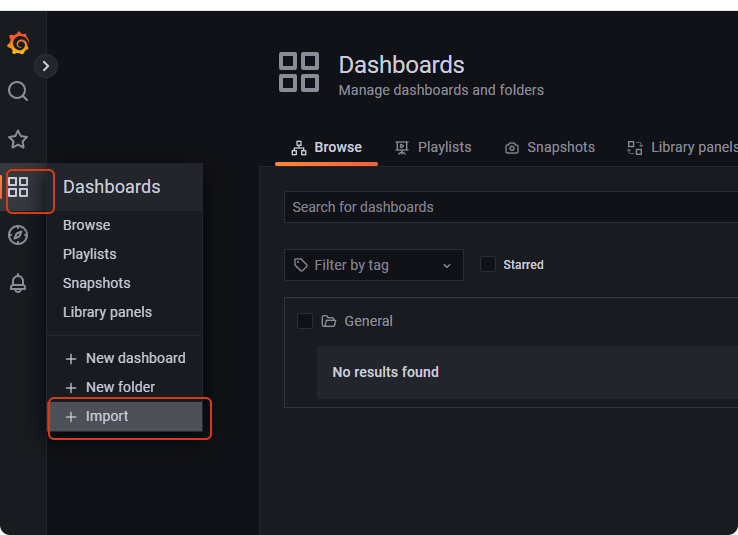
ID:10000
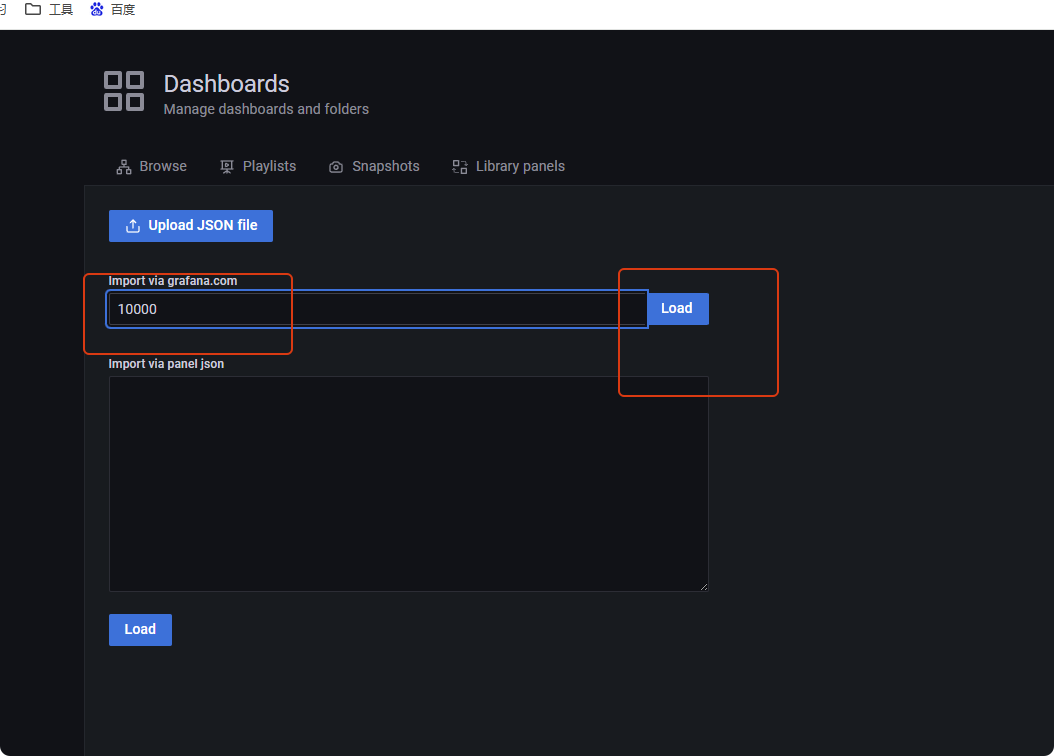
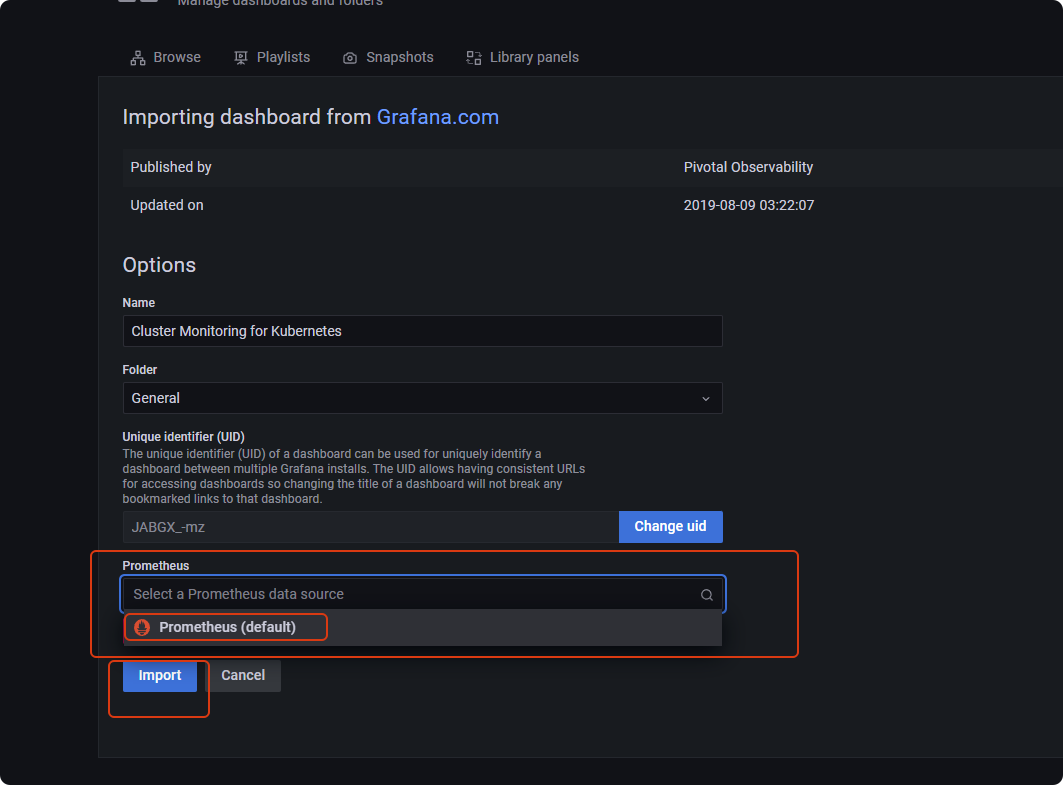
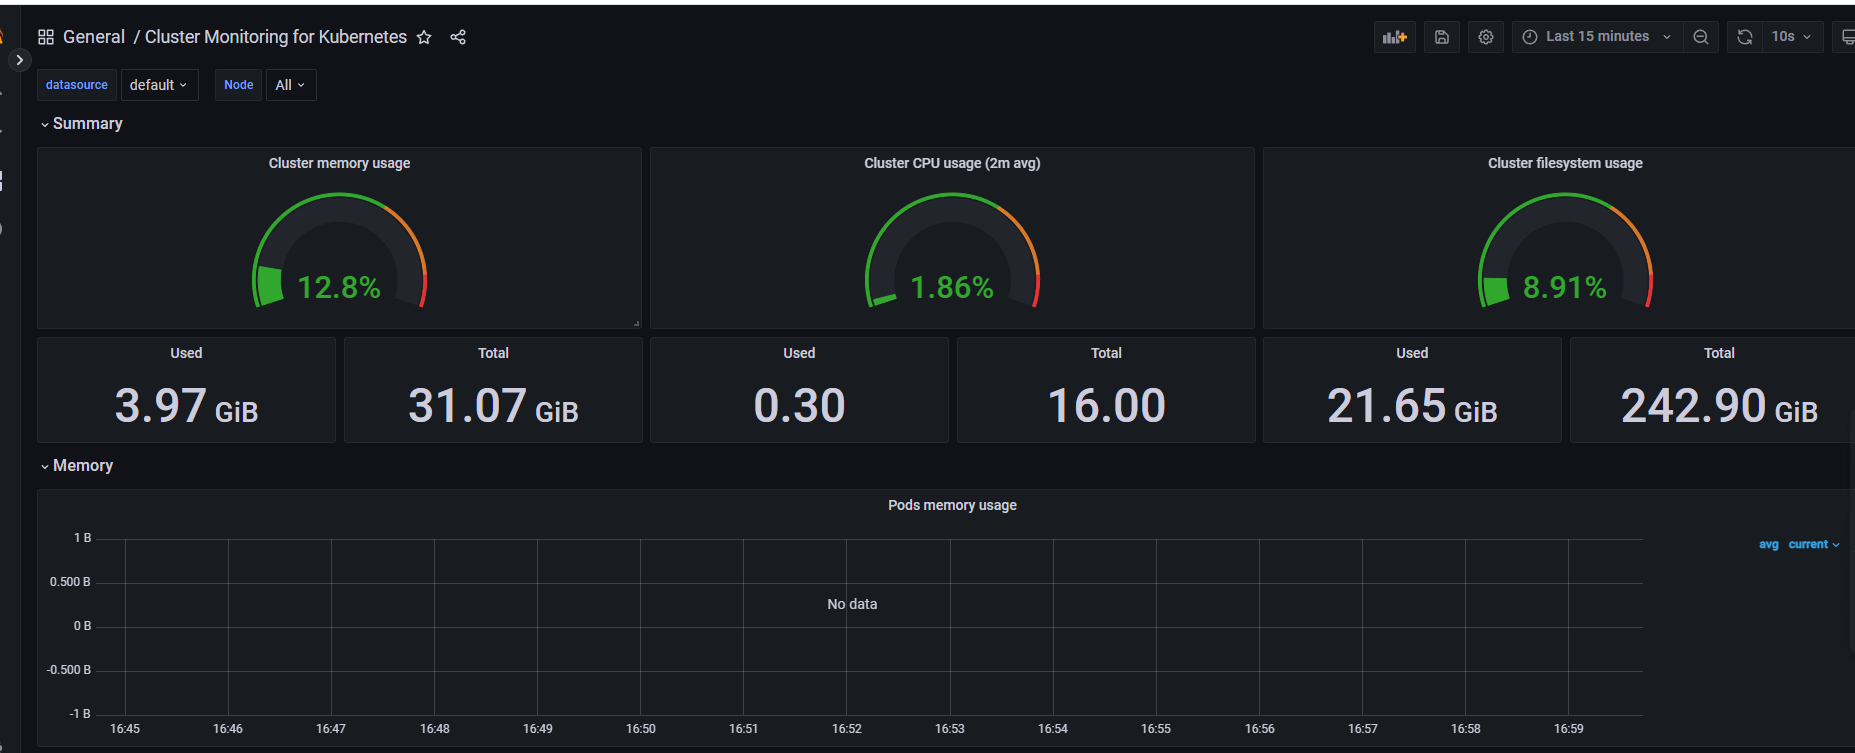
至此面板添加完了,数据未显示的,需要微调,可自行进行调整
扩展告警规则
# 容器相关报警信息
groups:
- name: "ContainerRules"rules:- alert: "容器异常"expr: kube_pod_container_status_running{env="test20250528",pod !~ "security-inspector-polaris-cronjob.*"} != 1for: 90slabels:severity: Disasterenv: test20250528annotations:summary: "ns:{{ $labels.namespace }} pod: {{ $labels.container }}]"description: "{{ $labels.instance }}: {{ $labels.namespace }} 服务{{ $labels.container }} 容器运行异常"# 容器内存使用率告警(>80%)- alert: "ContainerMemoryUsage"expr: sum by(namespace,pod,container) (container_memory_rss{image!="",env="test20250528"}) / sum by(namespace,pod,container) (container_spec_memory_limit_bytes{image!="",env="test20250528"}) * 100  != +Inf > 80for: 1mlabels:severity: Warningenv: test20250528annotations:summary: "[{{ $labels.namespace }}/{{ $labels.pod }} - {{ $labels.container }}] Container memory usage warning"description: "Container memory usage is above 80%.\nVALUE = {{ $value | printf \"%.2f\" }}%\n"# 容器 CPU 使用率告警(>80% - Warning)- alert: ContainerCpuUsageexpr: sum by(container, namespace, pod) (irate(container_cpu_usage_seconds_total{env="test20250528",image!=""}[5m]) * 100) / sum by(container, namespace, pod) (container_spec_cpu_quota{env="test20250528",image!=""} / container_spec_cpu_period{env="test20250528",image!=""}) > 80for: 1mlabels:severity: Warningenv: test20250528annotations:summary: "[{{ $labels.namespace }}/{{ $labels.pod }} - {{ $labels.container }}] Container CPU usage warning"description: "Container CPU usage is above 80%.\nVALUE = {{ $value | printf \"%.2f\" }}%\n"# 容器 CPU 使用率告警(>90% - Disaster)- alert: "ContainerCpuUsage"expr: sum by(container, namespace, pod) (irate(container_cpu_usage_seconds_total{env="test20250528",image!=""}[5m]) * 100) / sum by(container, namespace, pod) (container_spec_cpu_quota{env="test20250528",image!=""} / container_spec_cpu_period{env="test20250528",image!=""}) > 90for: 1mlabels:severity: Disasterenv: test20250528annotations:summary: "[{{ $labels.namespace }}/{{ $labels.pod }} - {{ $labels.container }}] Container CPU usage critical"description: "Container CPU usage is above 90%.\nVALUE = {{ $value | printf \"%.2f\" }}%\n"- alert: "容器重启"expr: rate(kube_pod_container_status_restarts_total{env="test20250528"}[15m]) > 0for: 5mlabels:severity: Disasterenv: test20250528annotations:summary: "[{{ $labels.namespace }}/{{ $labels.pod }} - {{ $labels.container }}] 容器发生重启"description: "{{ $labels.namespace }} 命名空间中的容器 {{ $labels.container }}(所属 Pod: {{ $labels.pod }})在过去 15 分钟内发生了重启)"
总结
至此 Kubernetes 监控体系的基础框架搭建完毕。后续可以根据业务需求增加更多监控项和告警规则。


)


