目录
一.环境准备
试验机安装
修改文件配置
二.收集测试机(test)日志
配置pipline文件
配置filebeat配置文件
三.收集测试机nginx日志
下载安装nginx
修改filebeat文件
修改pipline文件
四.收集网络服务模块日志
1.DHCP
下载dhcp
修改配置文件
修改dhcp配置文件
配置logstash文件
配置filebeat文件
重启应用查看kibana
2.DNS
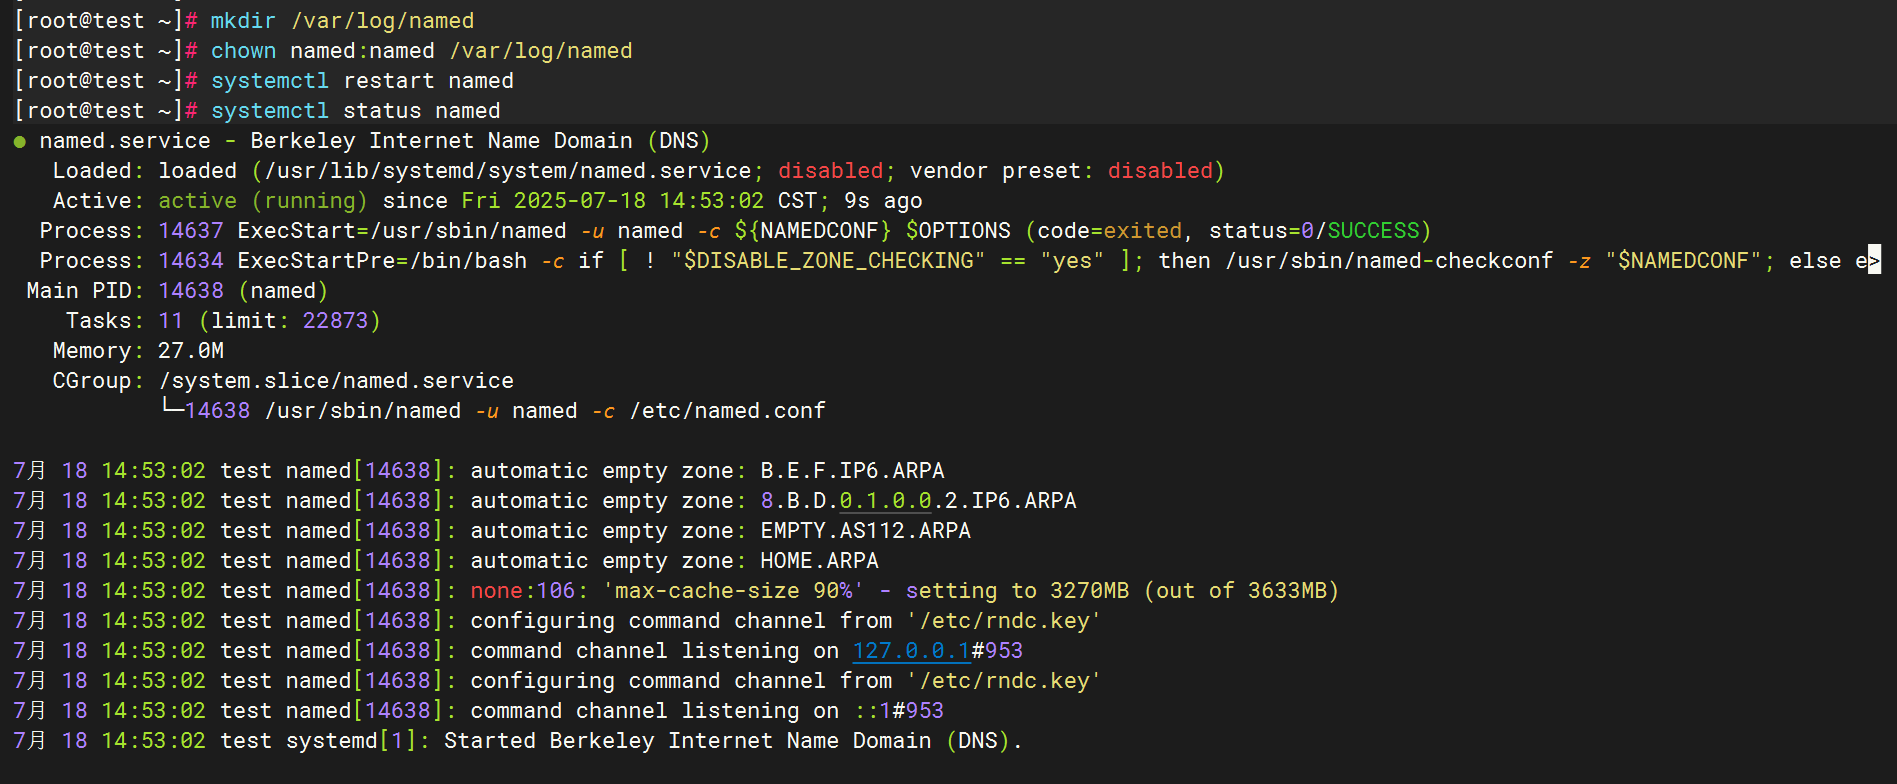
修改配置文件(/etc/named.conf)
创建日志目录并赋权
编辑配置filebeat文件
编辑 配置logstash文件
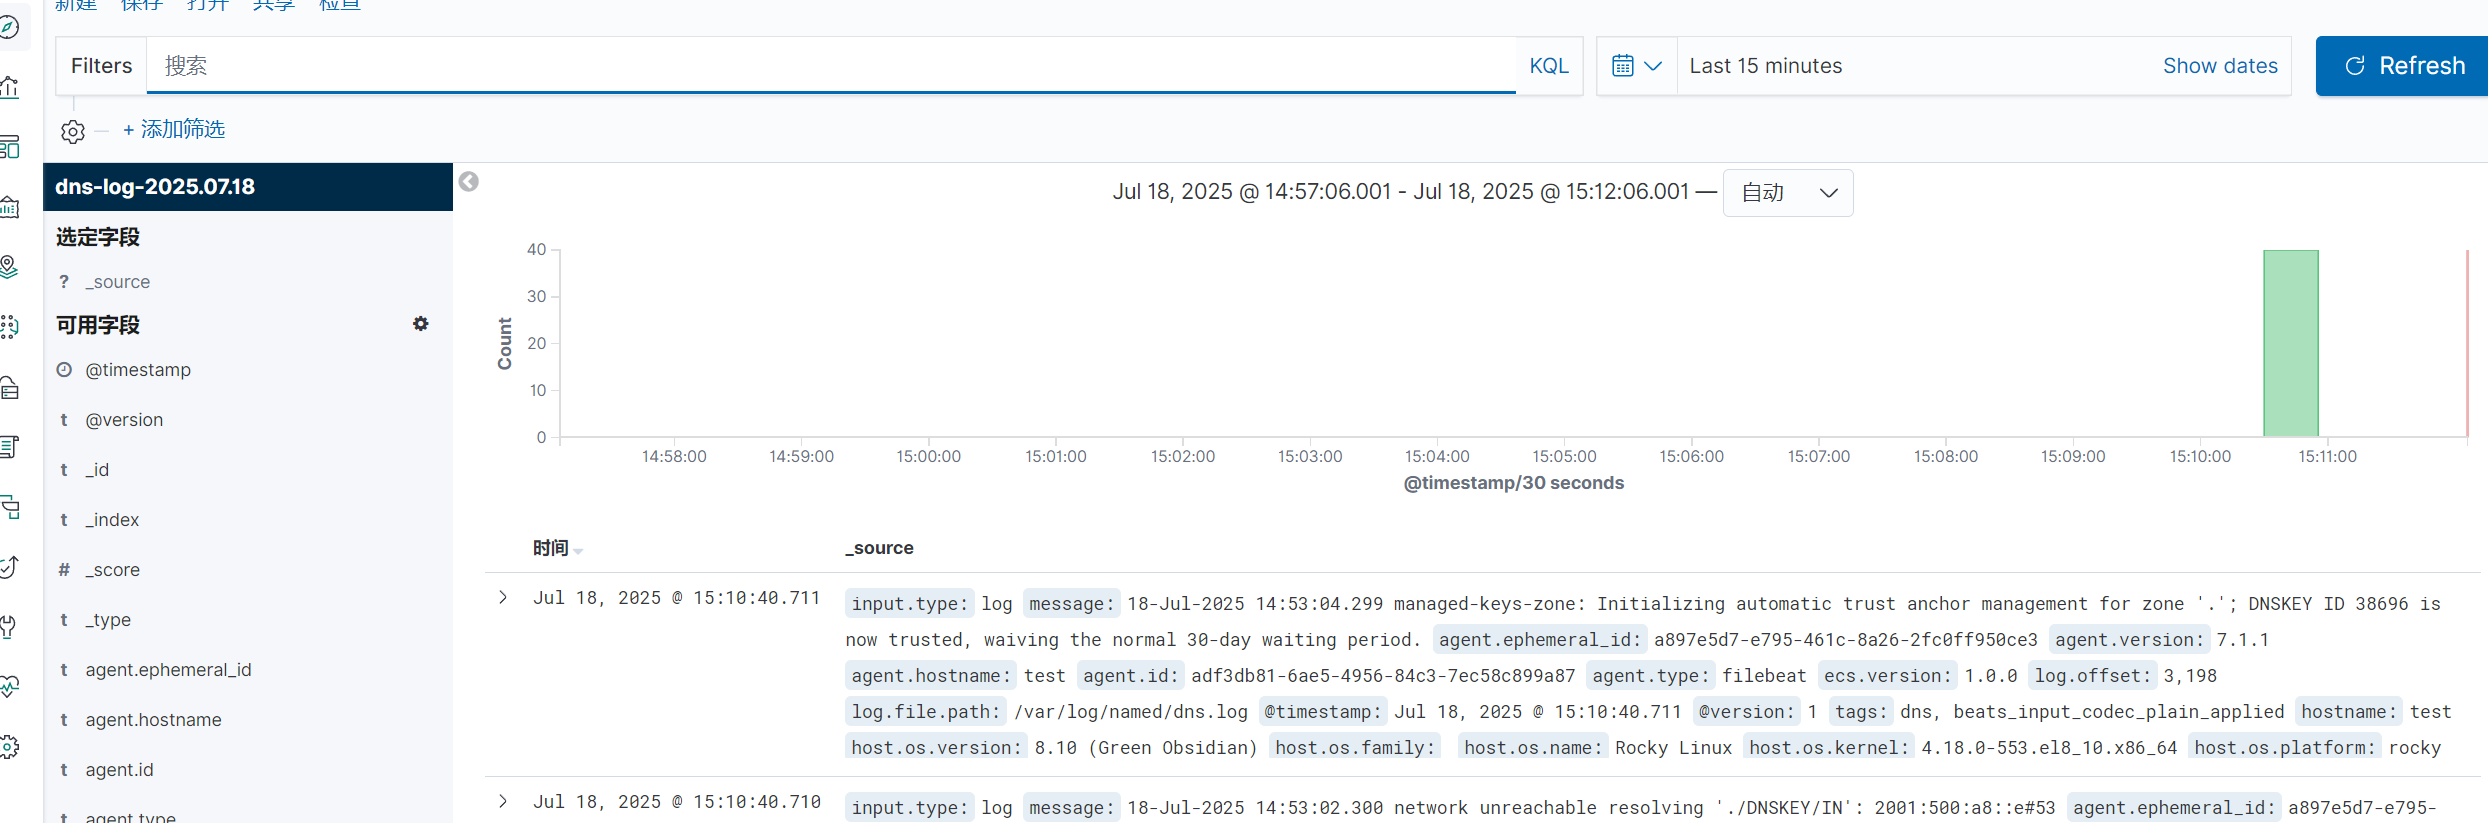
全部启动后在kibana查看日志
3.SSH
配置文件
Filebeat配置
Logstash配置
重启应用
检查kibana
4.Rsync
配置rsync
Filebeat配置
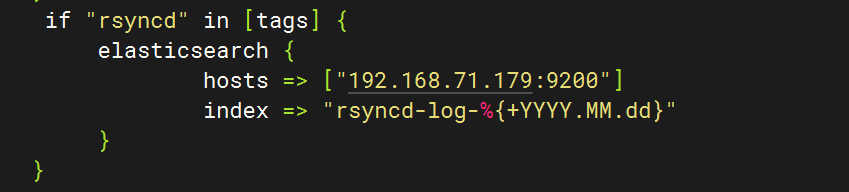
logstash配置
五.收集Tomcat服务日志
1.安装tomcat
2.Tomcat启动验证
3.配置filebeat文件
4.配置logstash文件
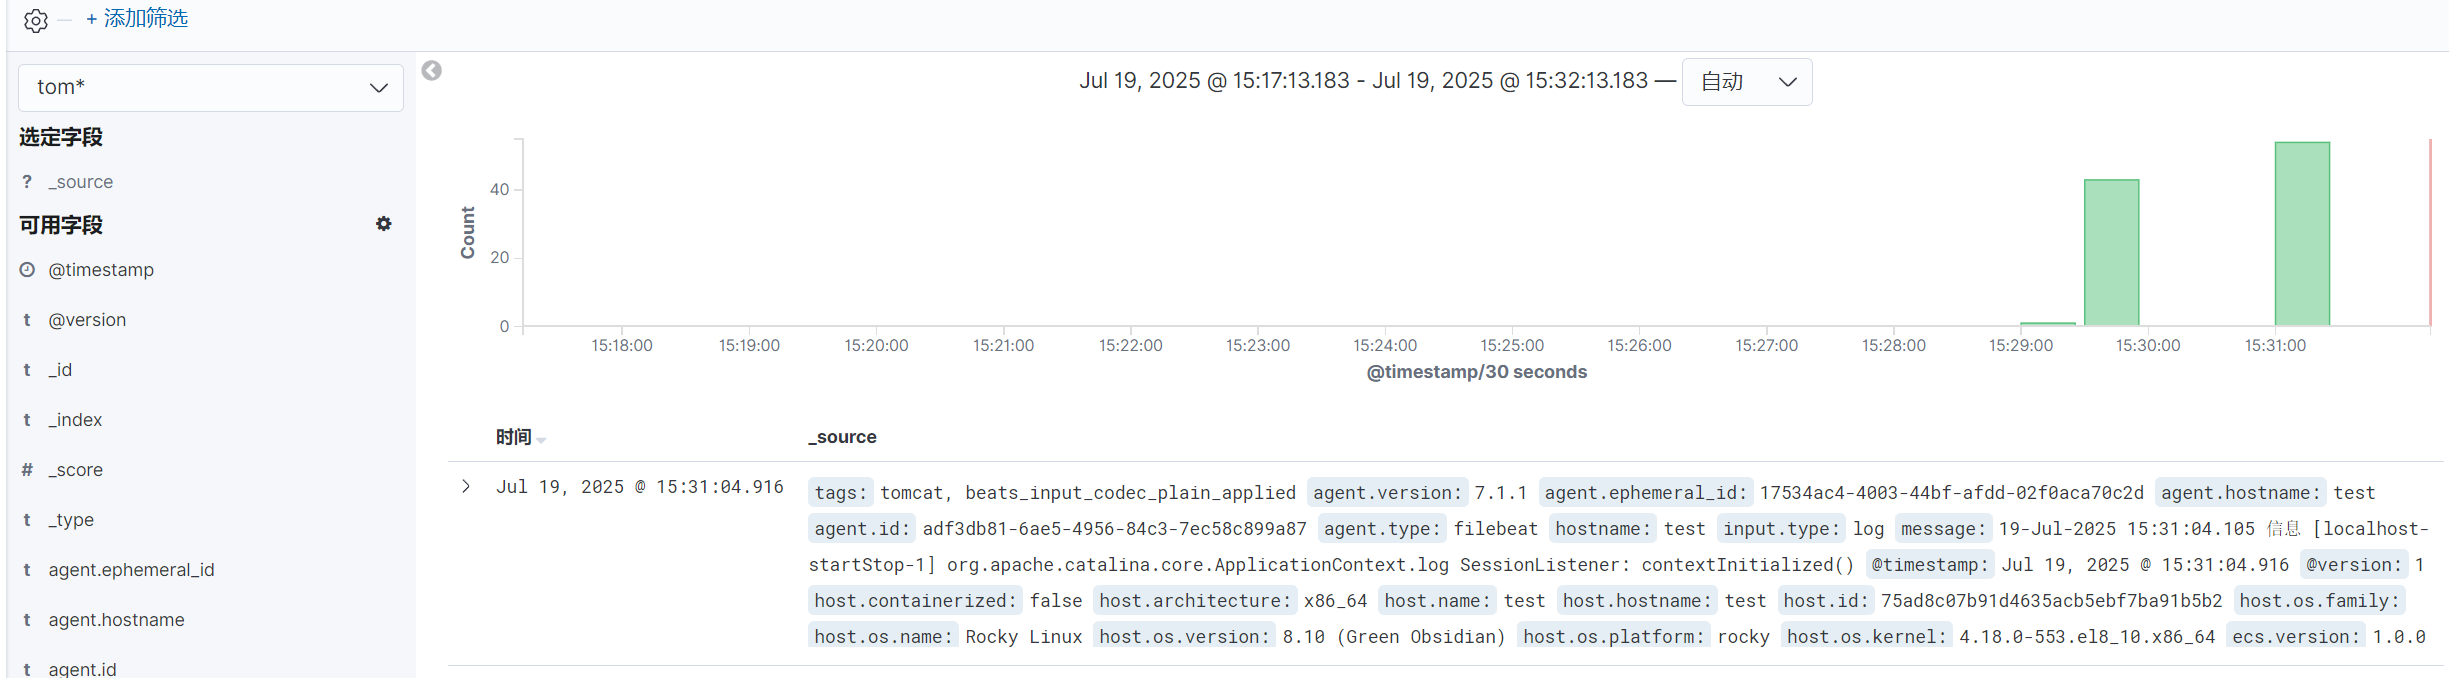
5.重启服务查看kibana
六.MySQL数据库日志收集
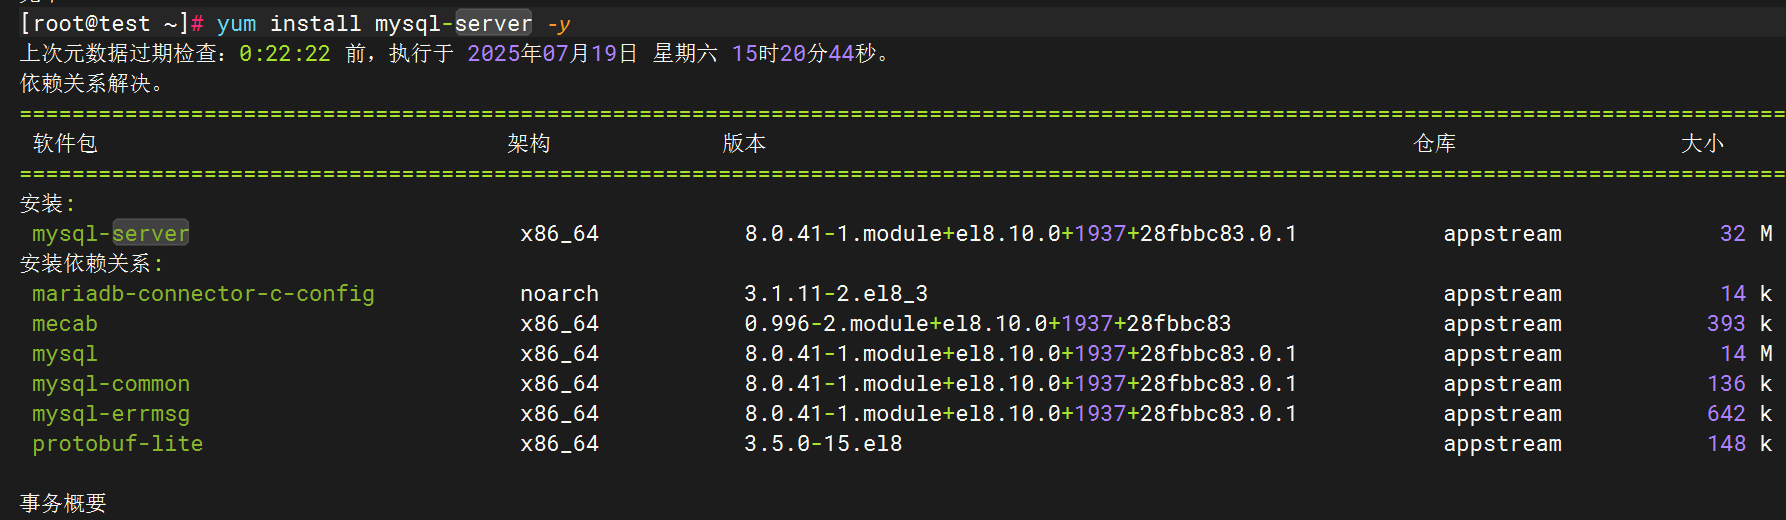
1.安装MySQL
2.编辑MySQL日志生成配置
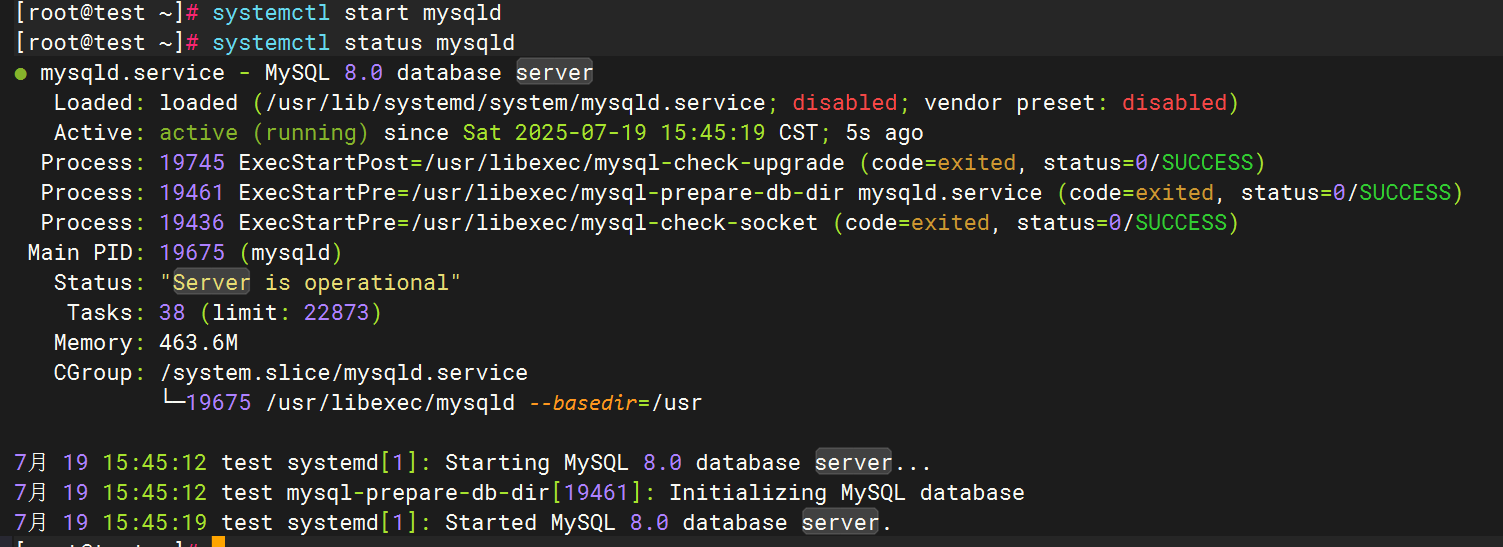
3.启动mysql并验证日志生成
4.配置filebeat文件
5.配置logstash文件
6.重启服务查看kibana
七.NFS日志收集
1.安装NFS
2.启用NFS日志
验证配置:
3.配置filebeat文件
4.配置logstash文件
5.重启服务查看kibana
八.Redis数据库日志收集
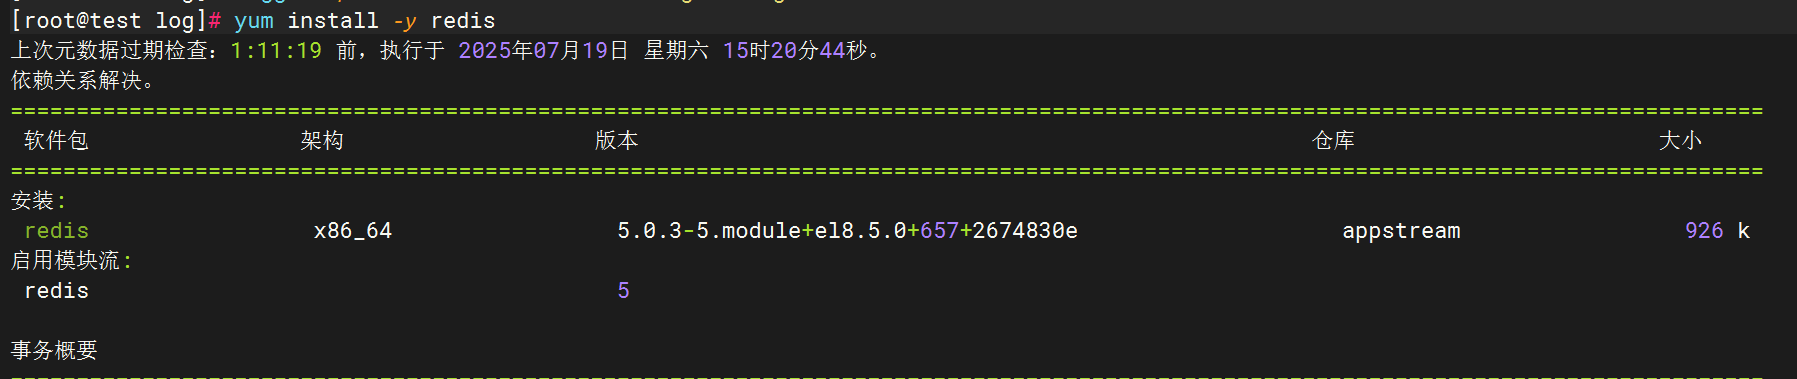
1.安装redis数据库
2.Redis日志生成配置
3.配置filebeat文件
4.配置logstash文件
5.重启服务查看kibana
九.LVS日志收集
1.下载安装ipvsadm
2.配置rsyslog文件
2.配置filebeat文件
3.配置logstash文件
十.Haproxy日志收集
1.安装haproxy
2.配置haproxy文件
3.配置Rsyslog收集HAProxy日志
4.修改filebeat文件
5.修改logstash文件
6.重启全部服务,登录kibana查看日志
十一.Keepalived日志收集
1.安装keepalived
2.配置keepalived日志输出
3.测试日志生成
4.修改filebeat文件
5.修改logstash文件
6.重启全部服务,检查kibana
十二.汇总
一.环境准备
| 角色 | 主机名 | IP地址 |
|---|---|---|
| 图形展示 | kibana | 192.168.71.178 |
| 日志存储 | es | 192.168.71.179 |
| 日志收集分析 | lostash | 192.168.71.180 |
| 日志采集 | test | 192.168.71.181 |
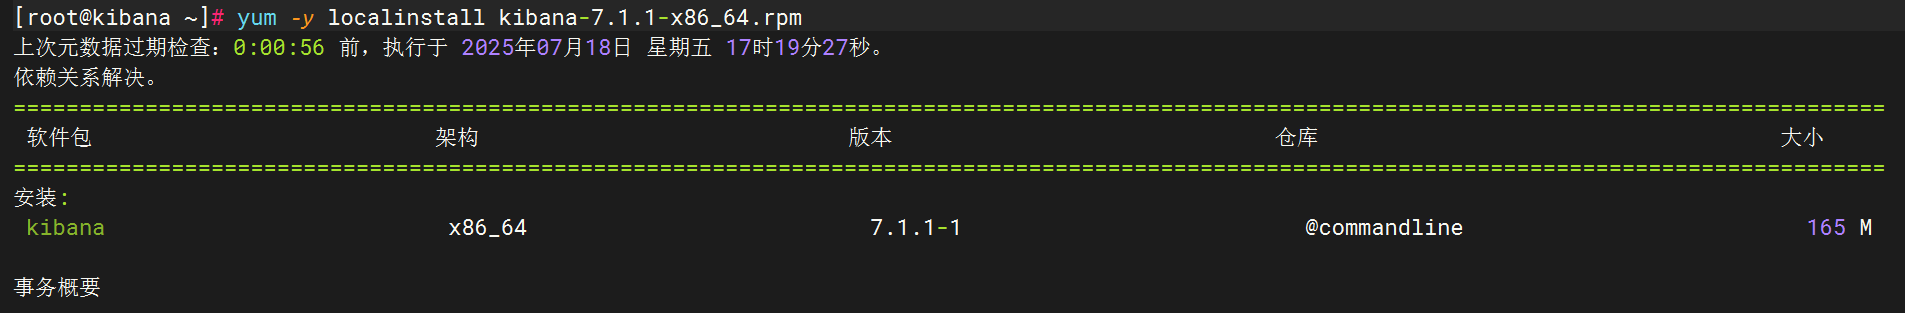
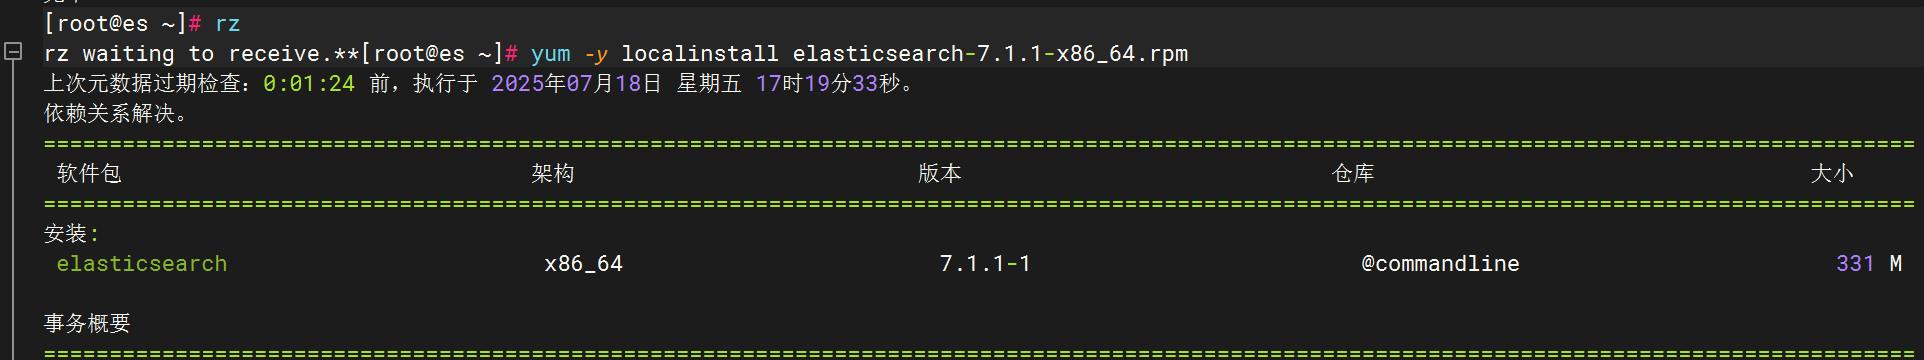
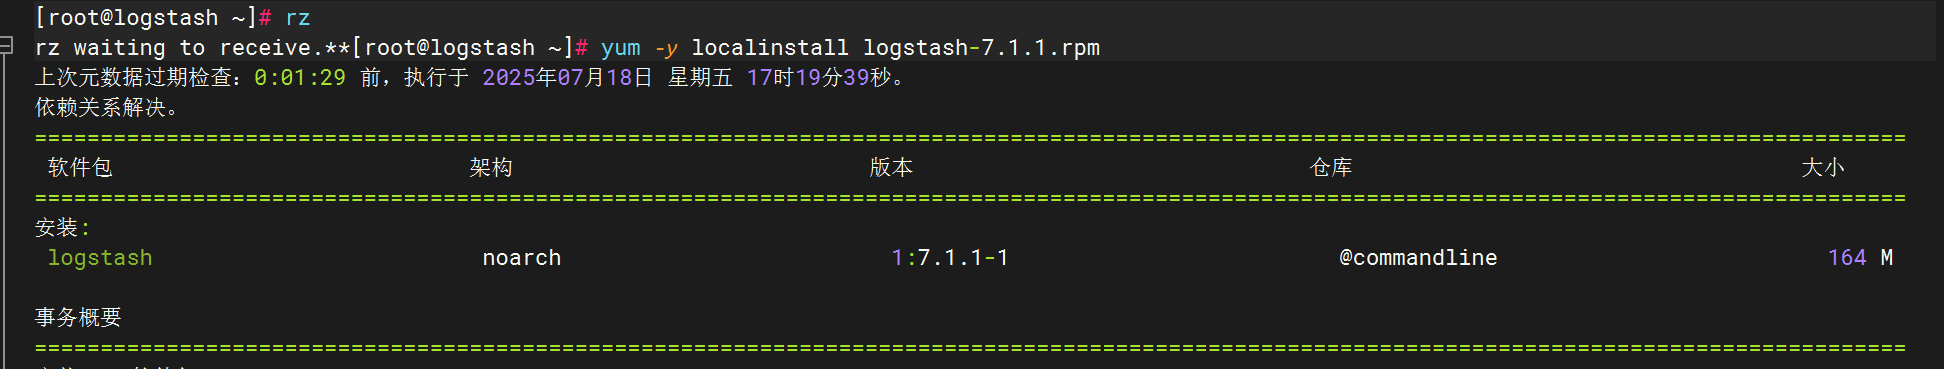
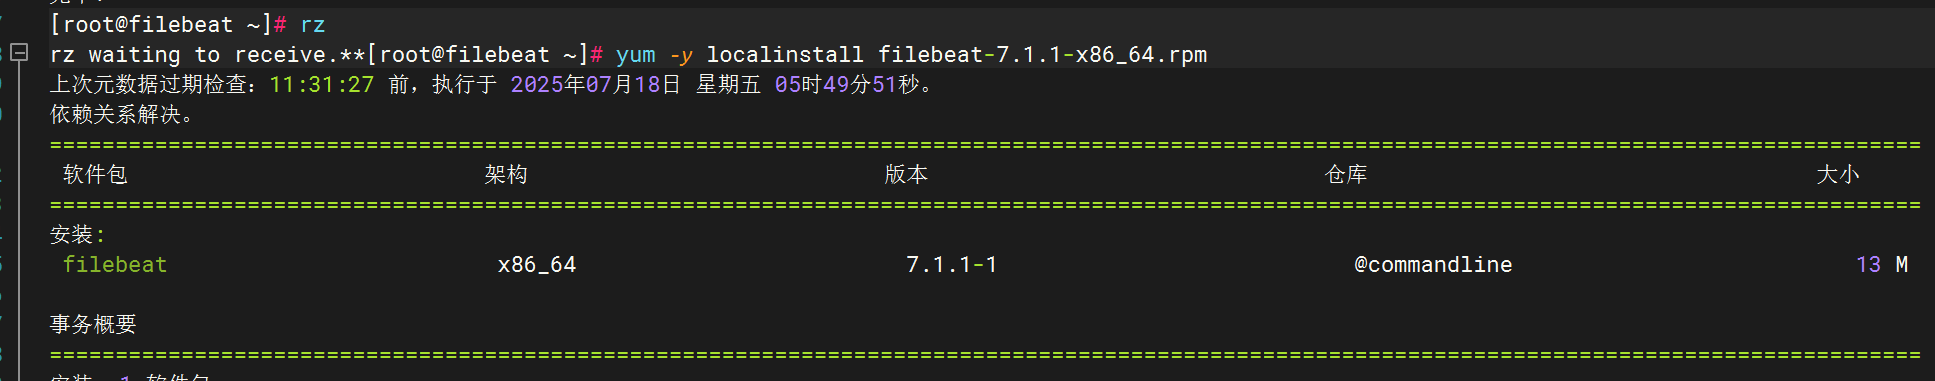
试验机安装
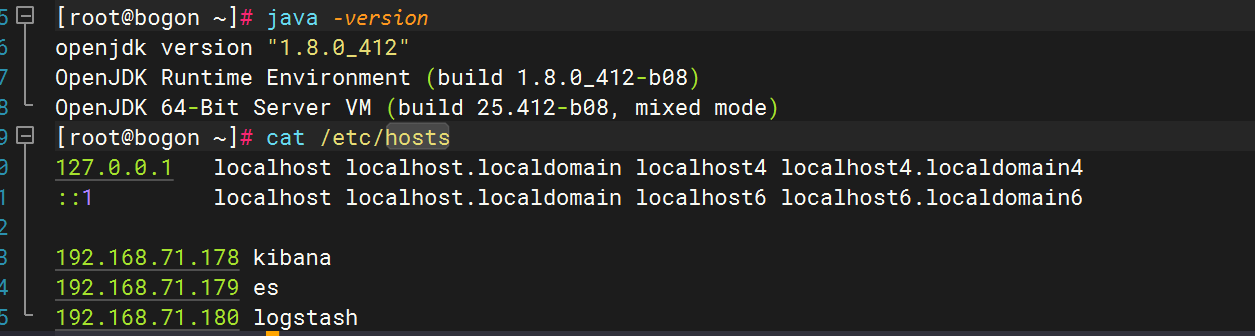
分别安装elasticsearch,logstash,kibana,filebeat
优化logstash命令
ln -s /usr/share/logstash/bin/logstash /usr/local/bin/
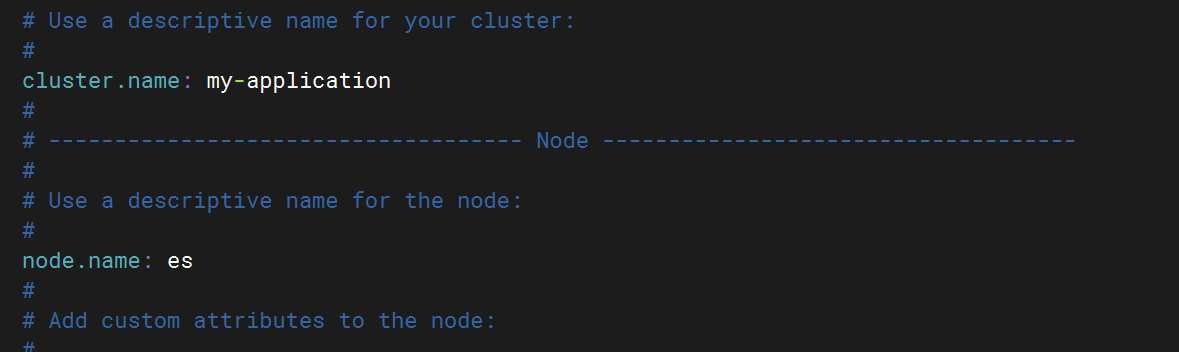
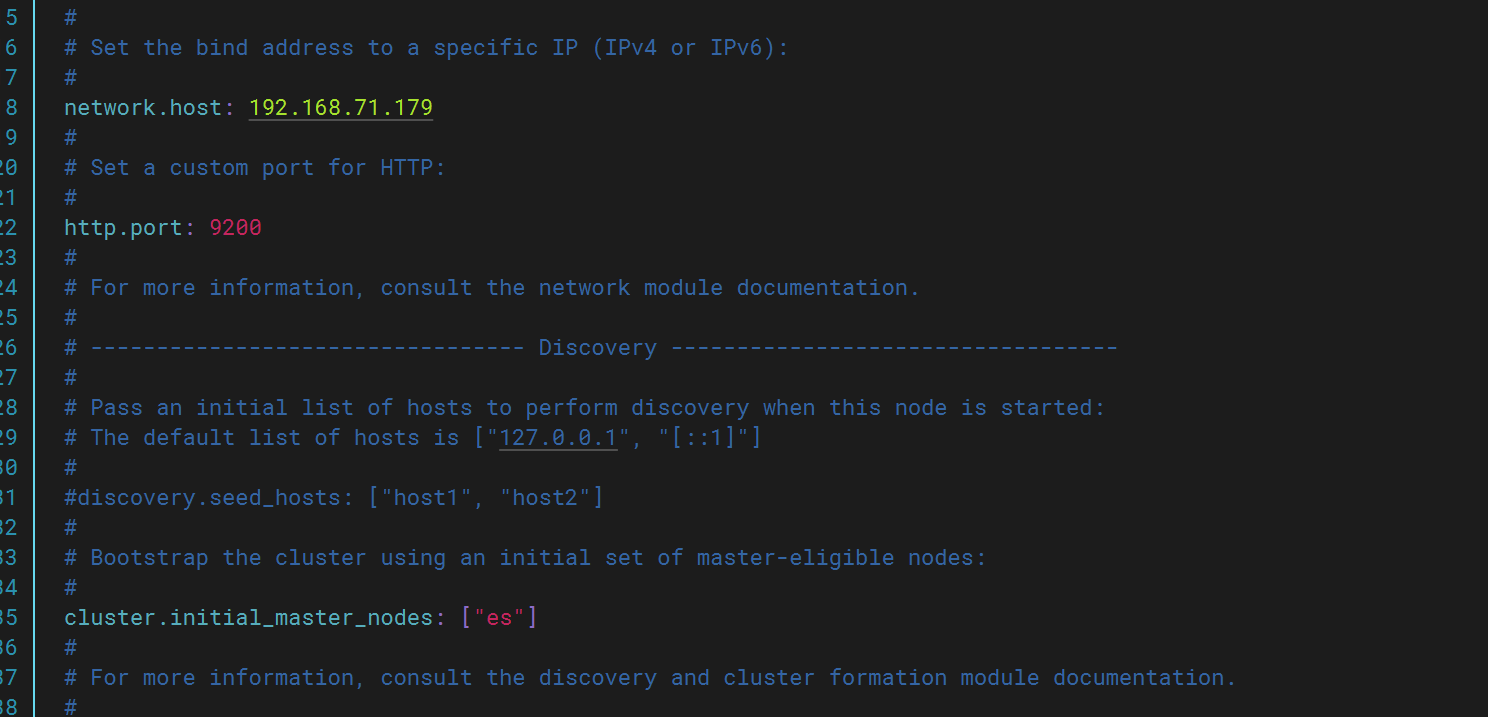
修改文件配置
elasticsearch:
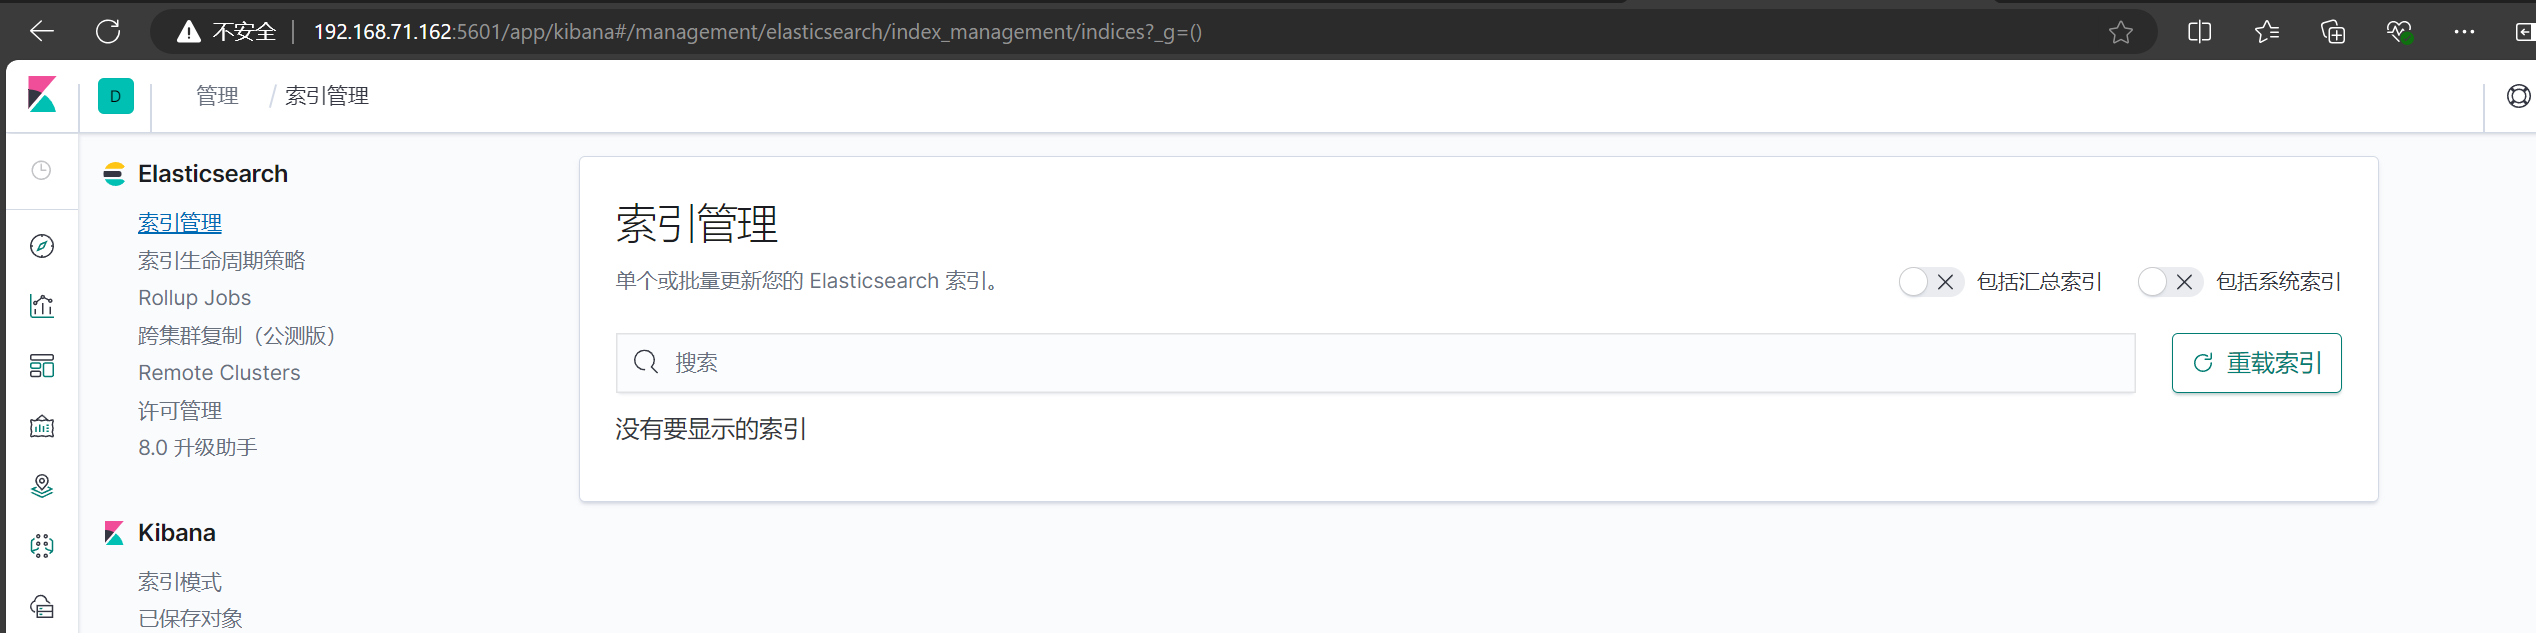
kibana:
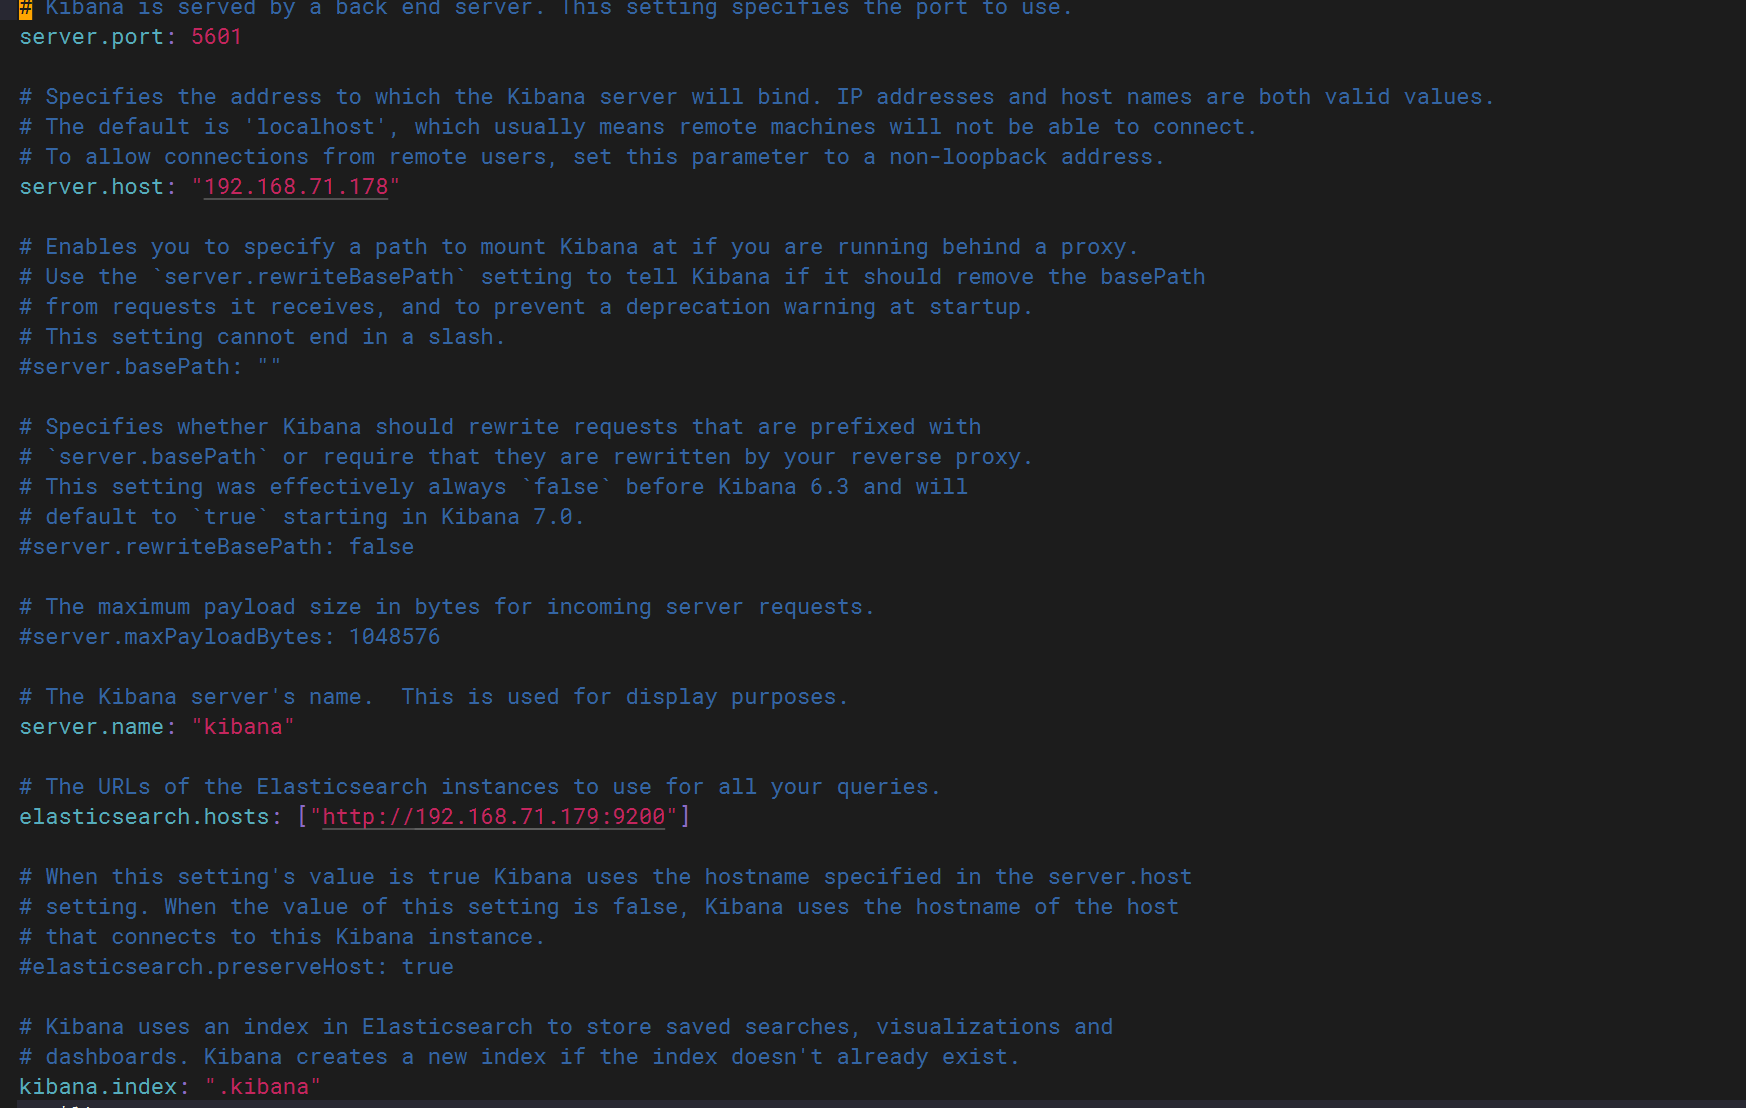

可以正常登录5601端口
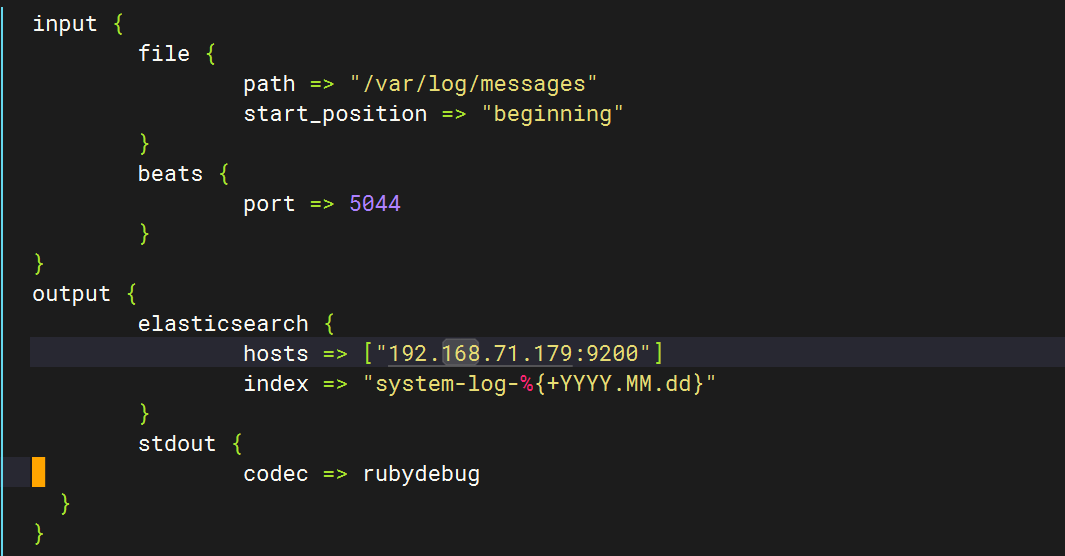
编写pipline文件
初始文件内容
input {file {path => "/var/log/messages"start_position => "beginning"}
}
output {elasticsearch {hosts => ["http://192.168.71.179:9200"]index => "system-log-%{+YYYY.MM.dd}"}stdout {codec => rubydebug}
}
运行logstash获取日志,并在kibana查看

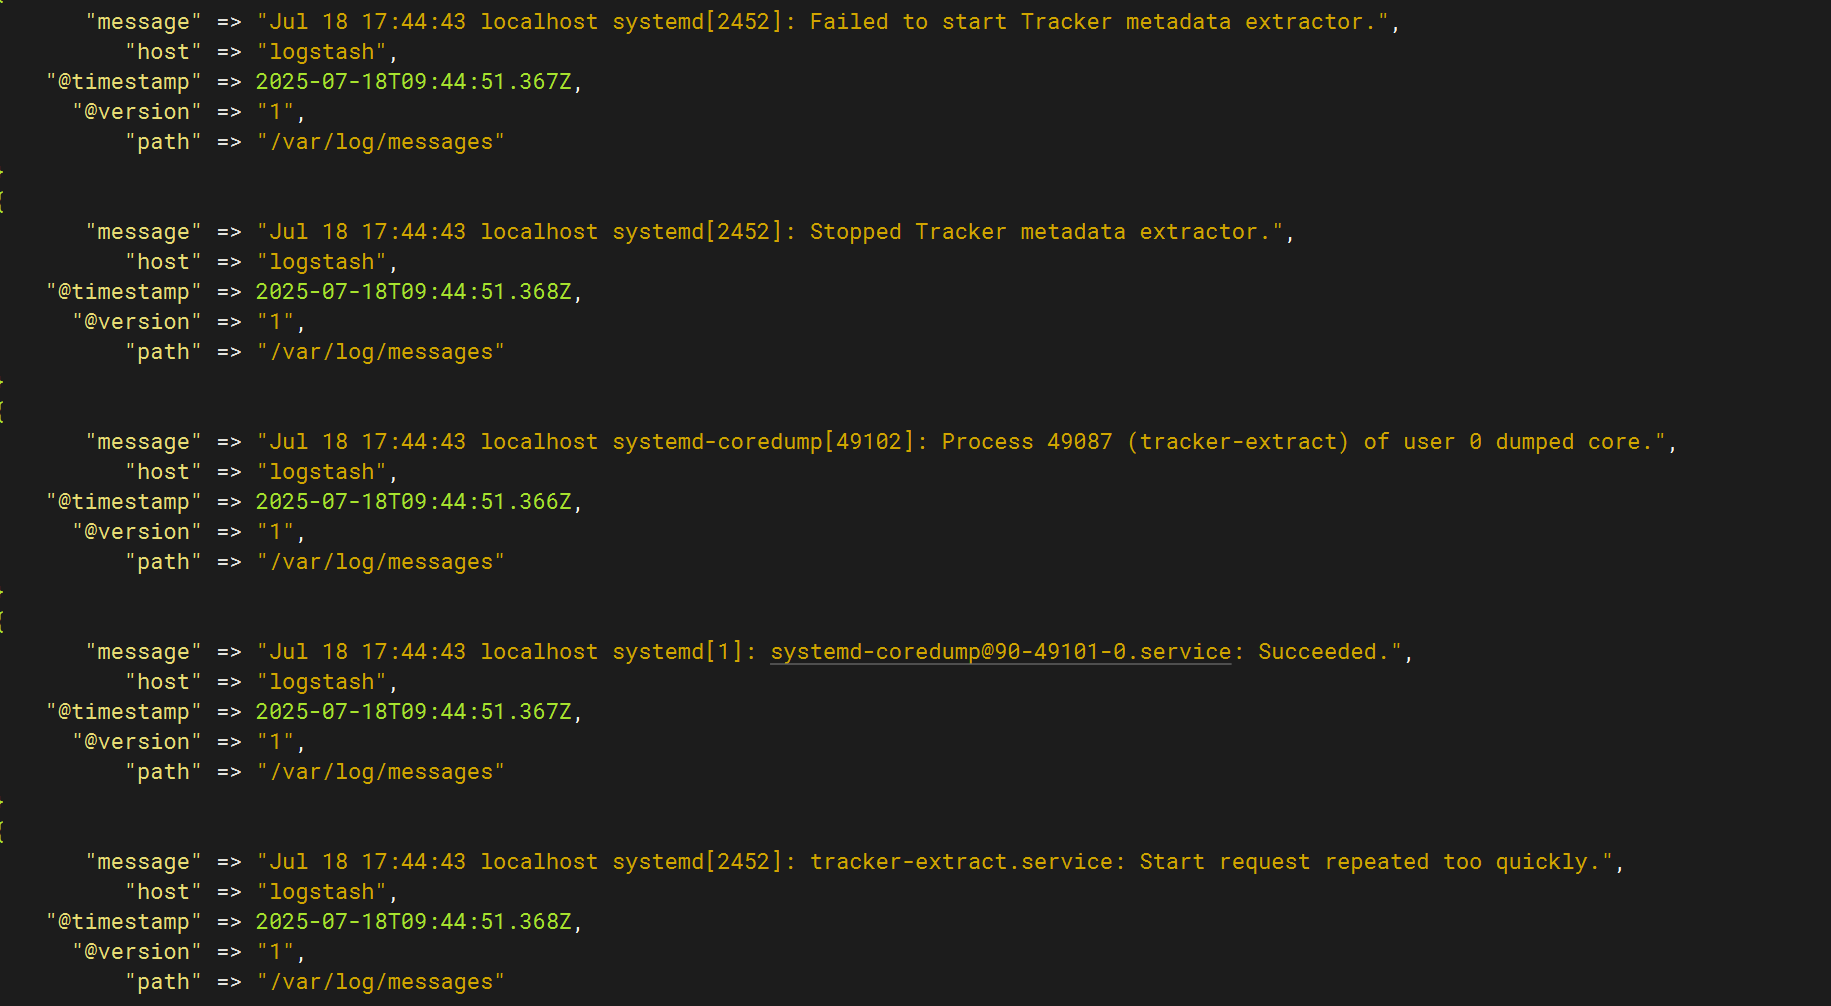
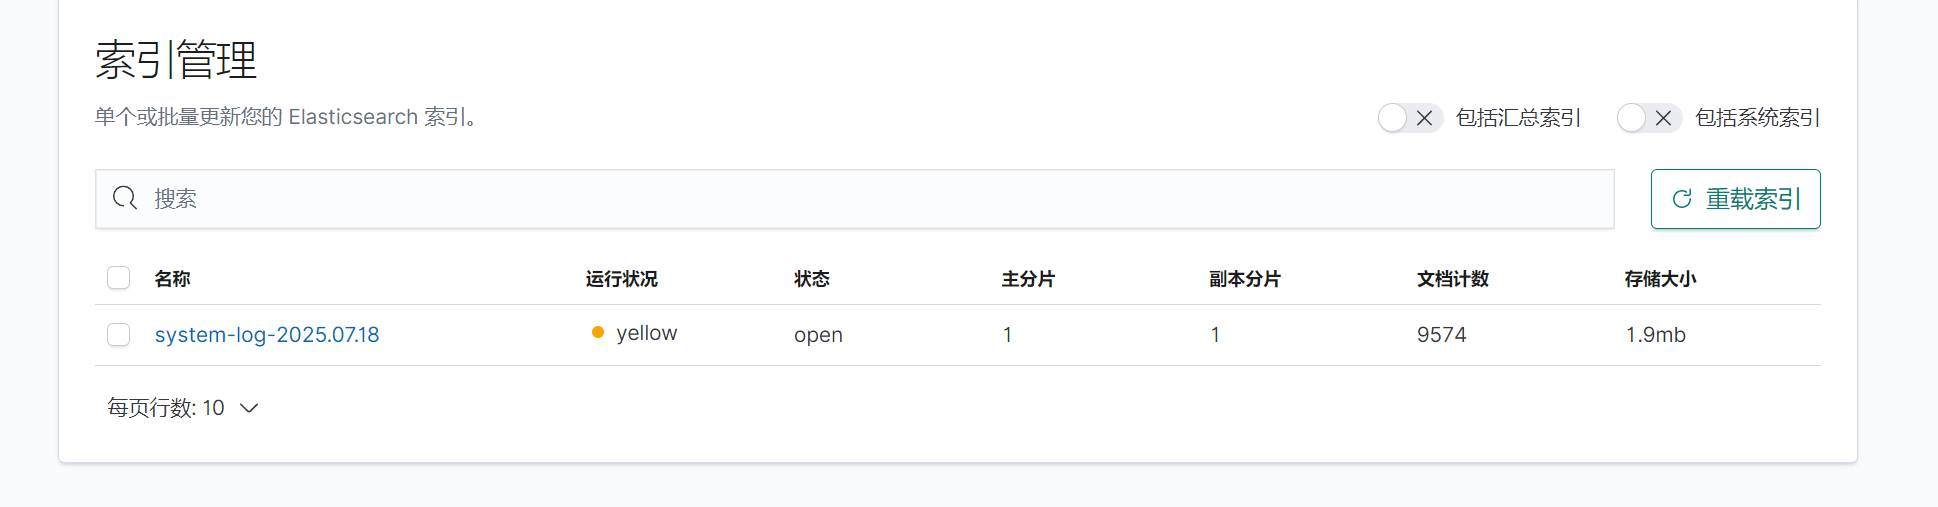
成功运行,并且成功获取日志
二.收集测试机(test)日志
配置pipline文件
新加一个端口(未使用的都可以)
input {file {path => "/var/log/messages"start_position => "beginning"}beats {port => 5044}
}
filter {if [host][name] {mutate { add_field => { "hostname" => "%{[host][name]}" } }}else if [agent][hostname] {mutate { add_field => { "hostname" => "%{[agent][hostname]}" } }}else {mutate { add_field => { "hostname" => "%{host}" } }}
}
output {if [hostname] == "logstash" {elasticsearch {hosts => ["192.168.71.179:9200"]index => "system-log-%{+YYYY.MM.dd}"}
}else if [hostname] == "test" {elasticsearch {hosts => ["192.168.71.179:9200"]index => "test-log-%{+YYYY.MM.dd}"}
}stdout {codec => rubydebug}
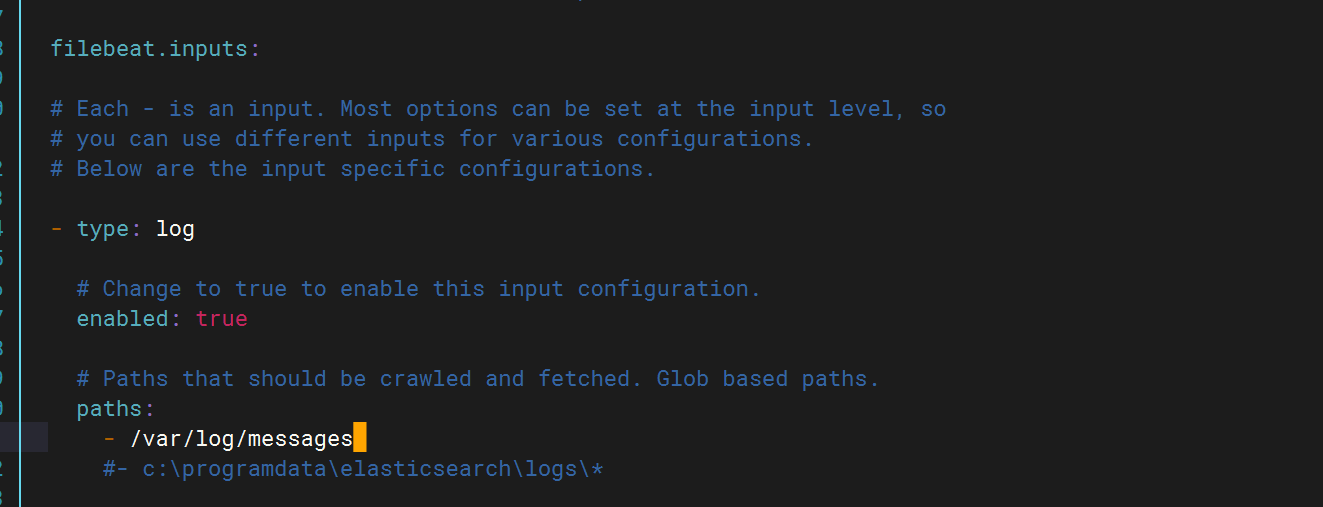
}配置filebeat配置文件
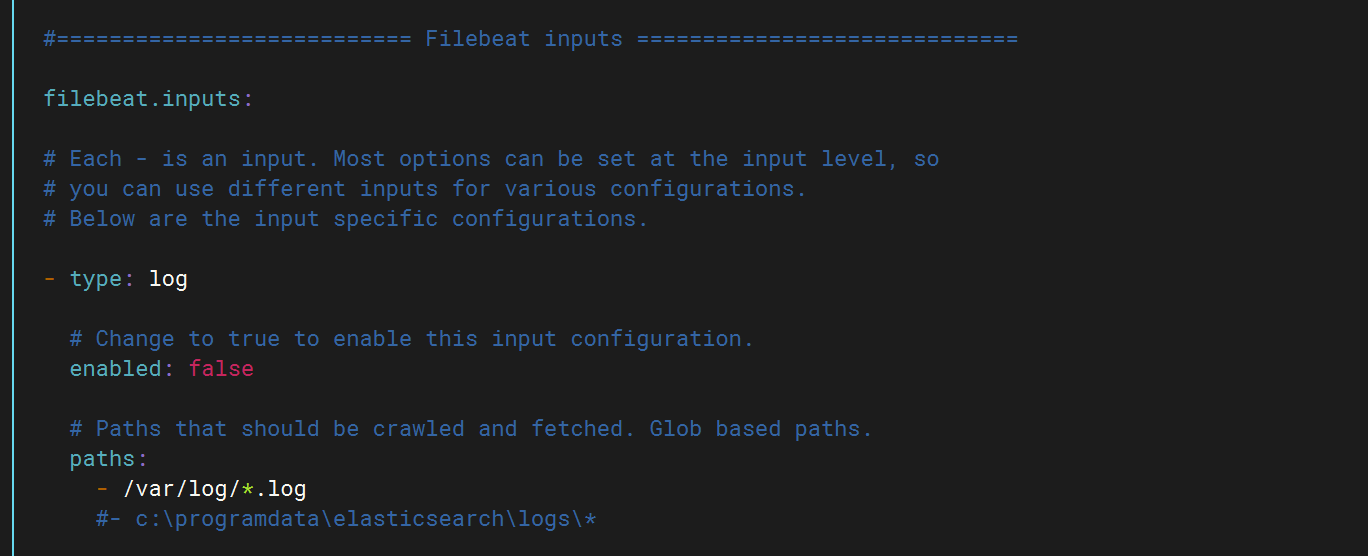
将false改为ture打开该功能,然后填写日志路径
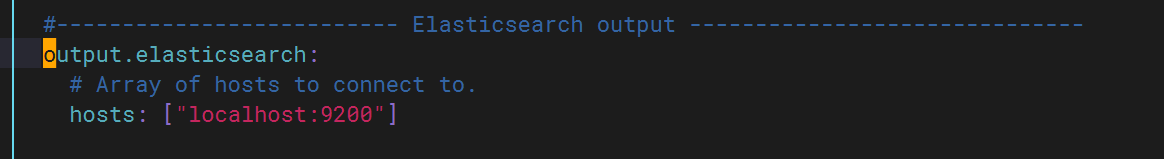
将ES注释掉并打开logstash
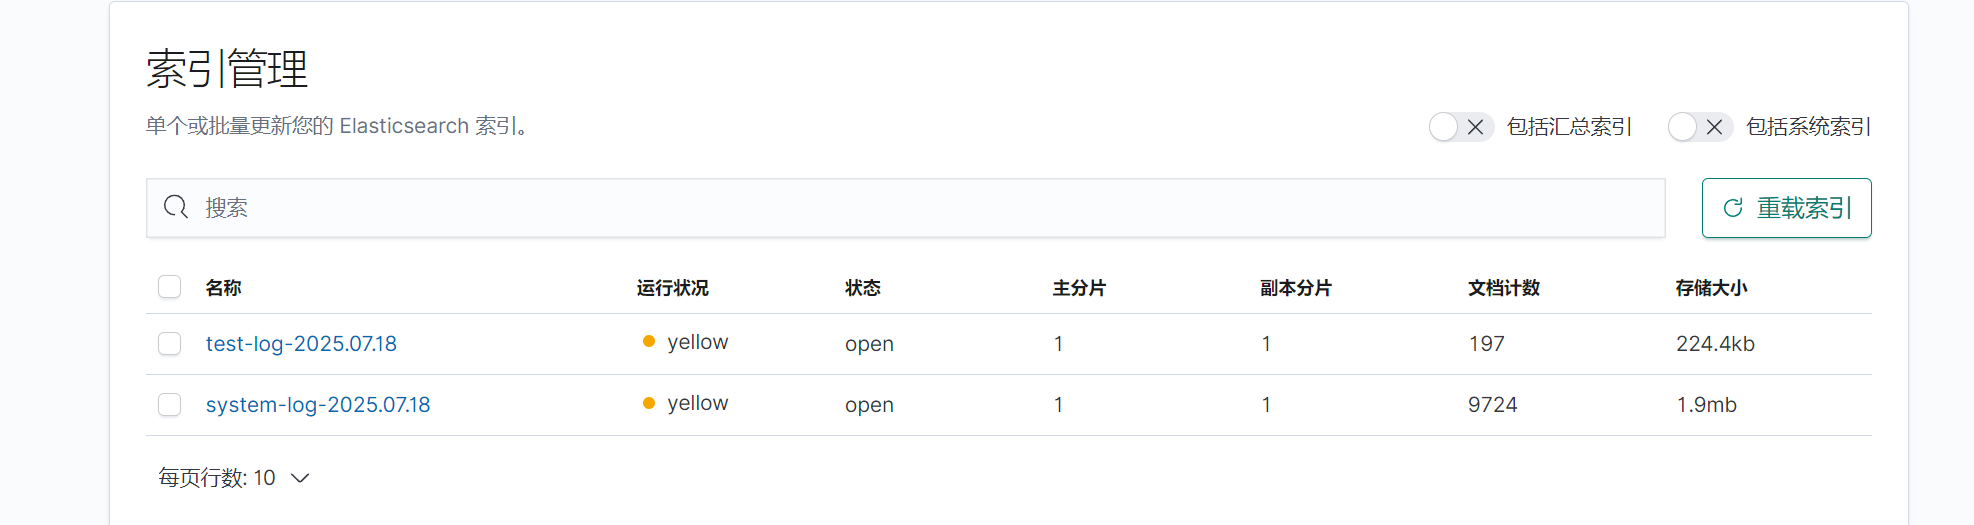
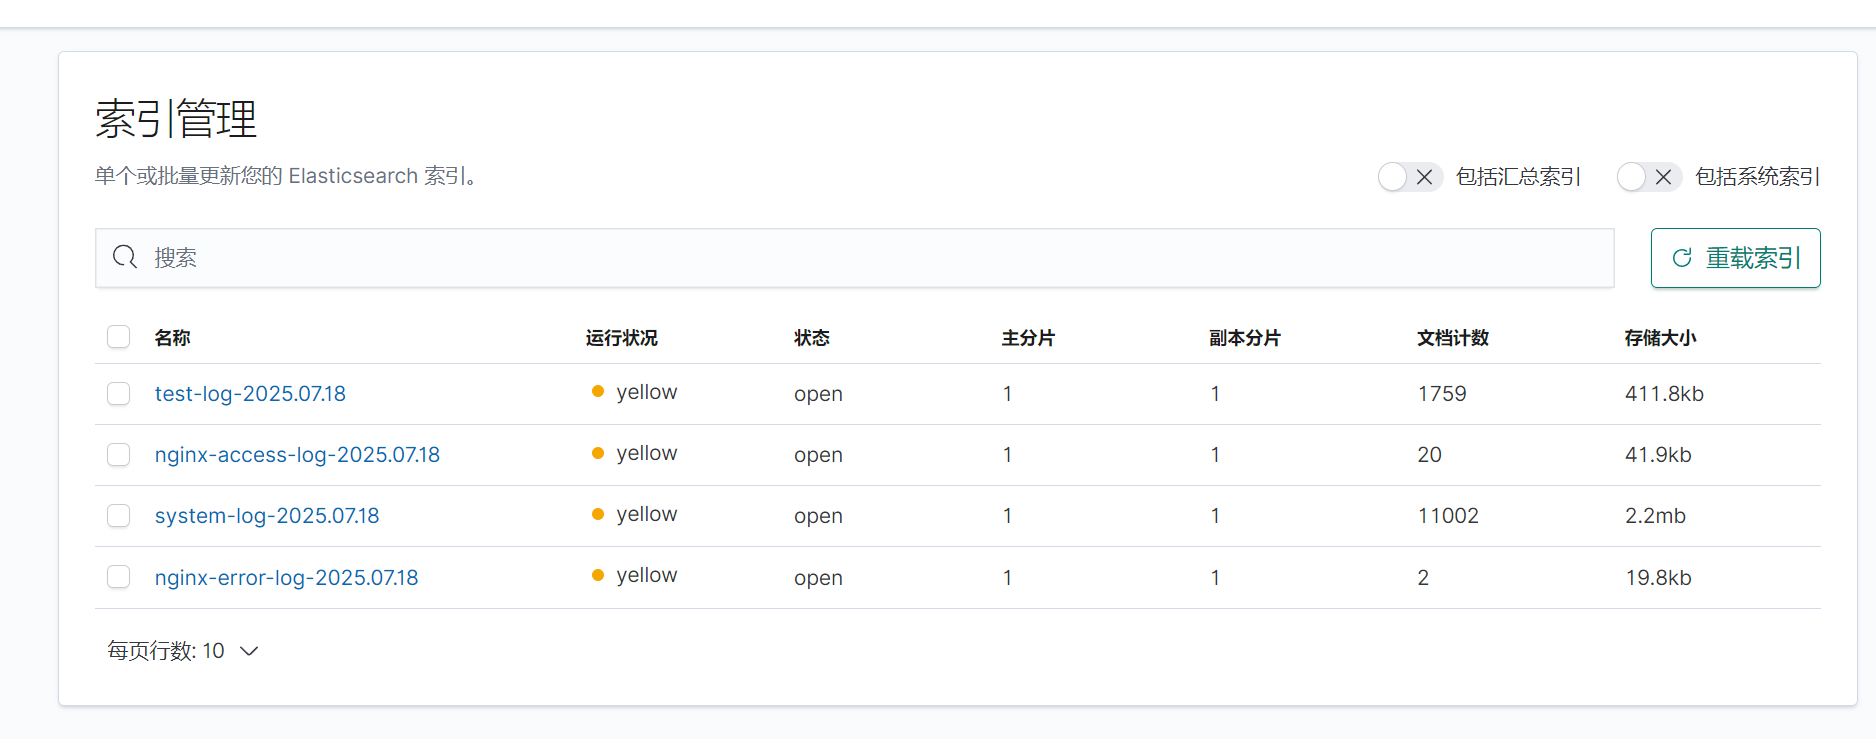
修改完成后启动logstash,此时再次查看kibana发现多出test上的日志文件。
三.收集测试机nginx日志
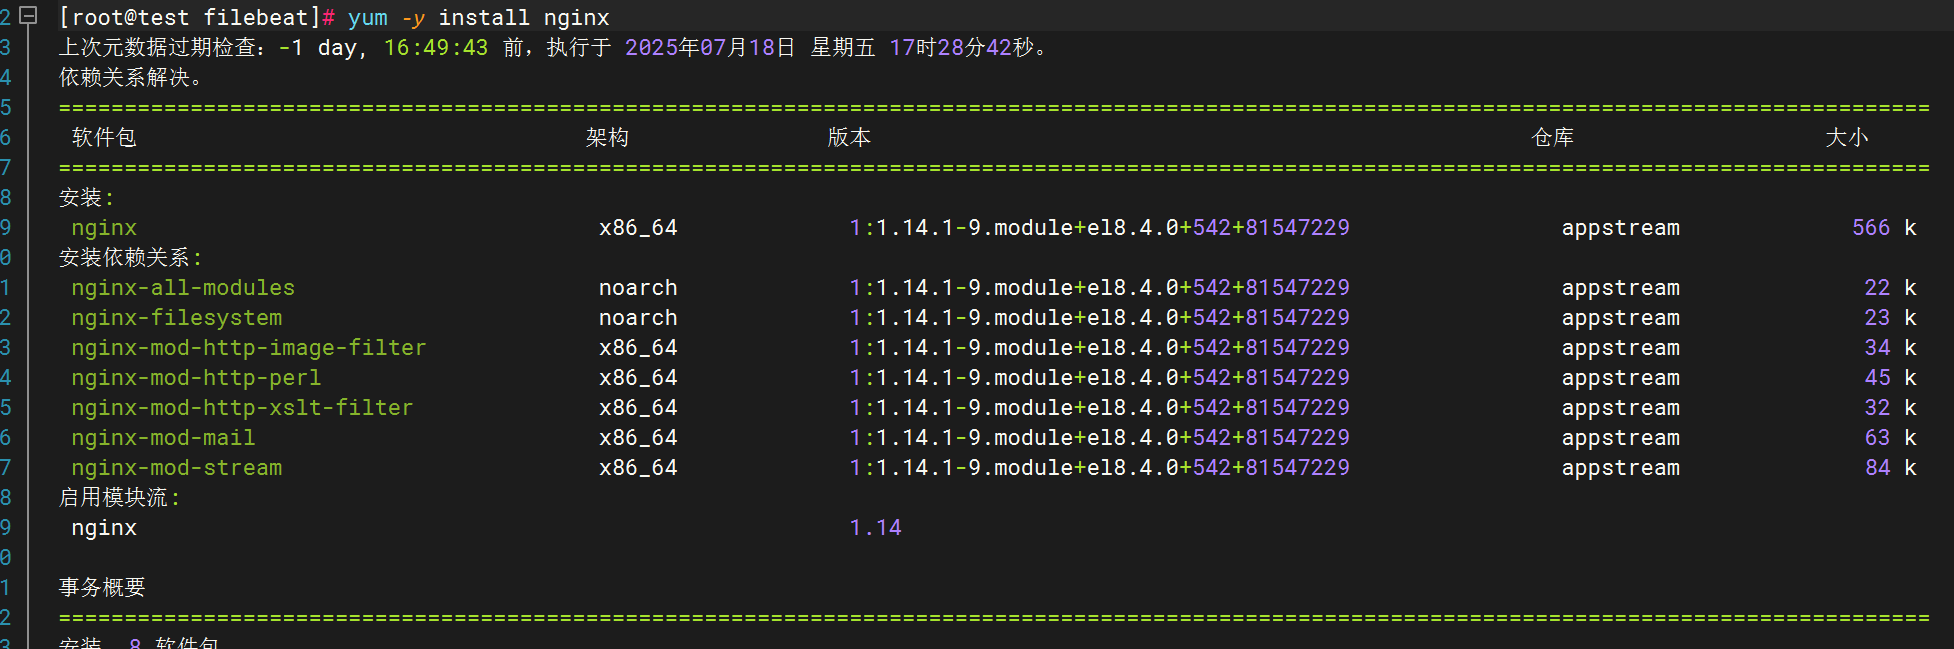
下载安装nginx
修改filebeat文件
修改pipline文件
在test下新增如下内容
登录nginx(不改主页会有一个错误日志)
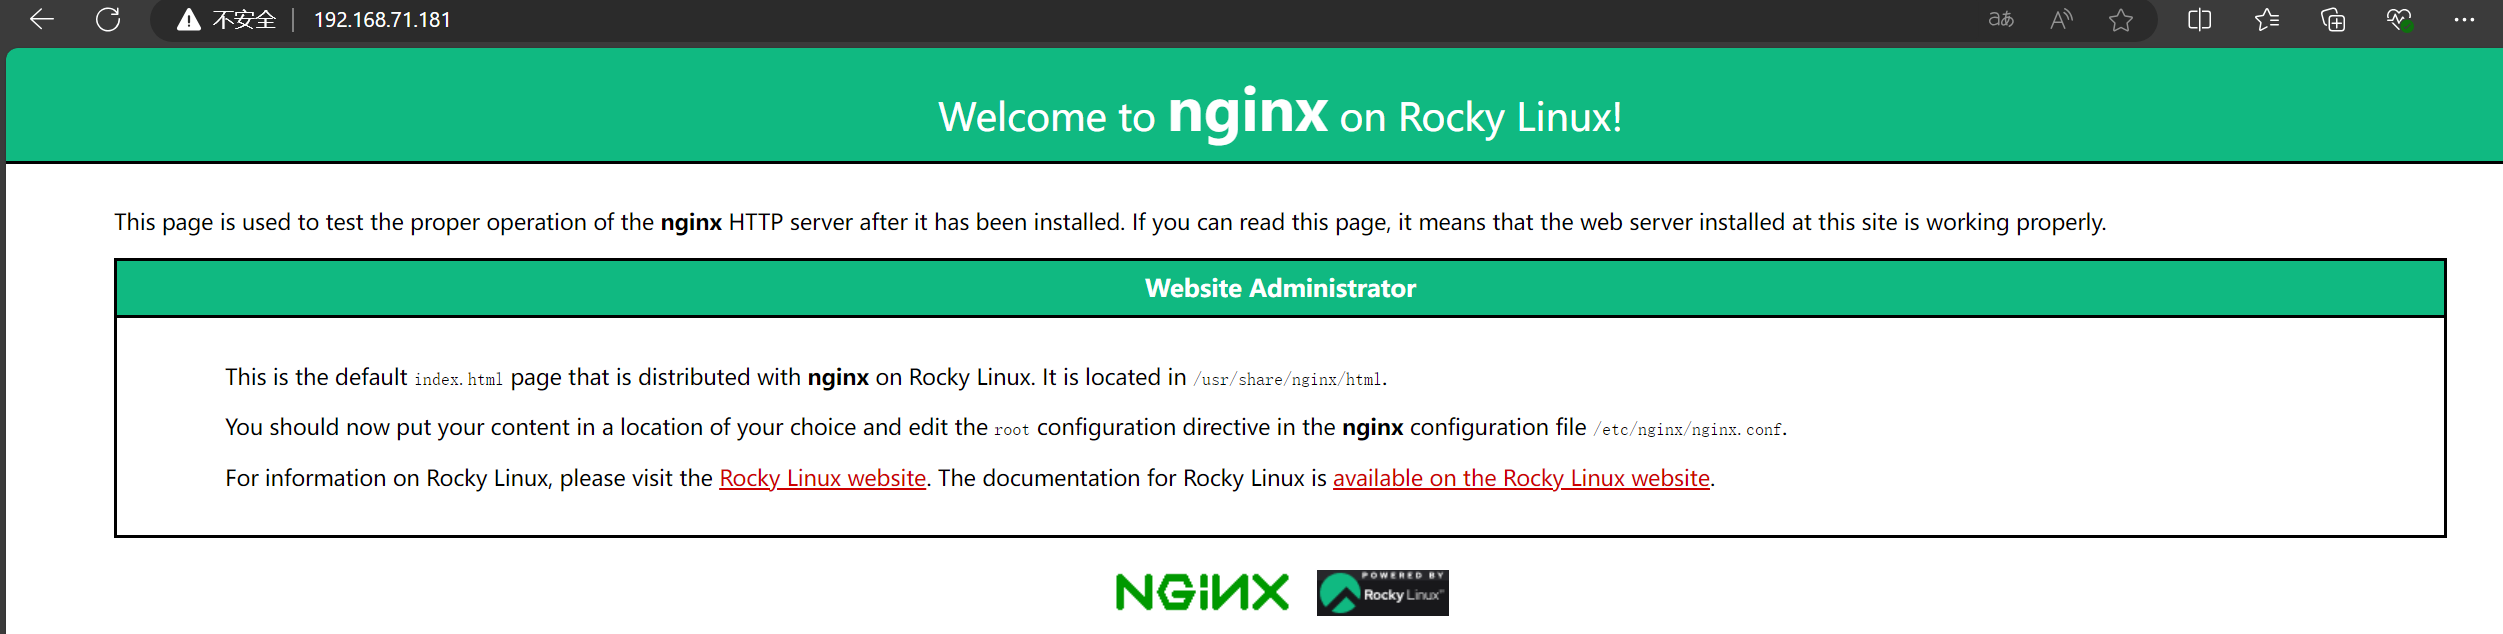
登录查看kibana,生成日志文件
四.收集网络服务模块日志
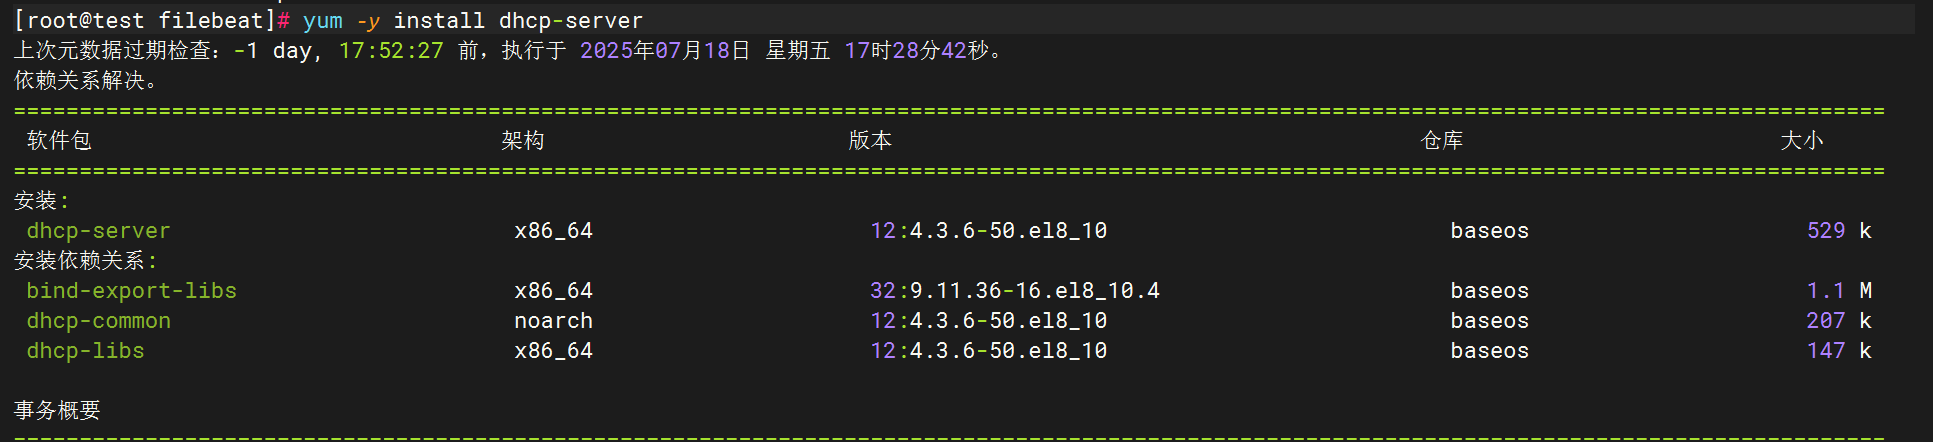
1.DHCP
下载dhcp
将完整dhcpd.conf文件复制过来
![]()

修改配置文件
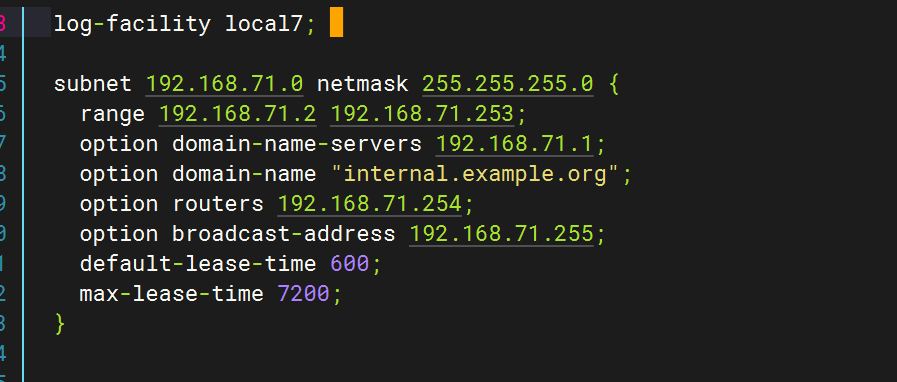
修改dhcp配置文件
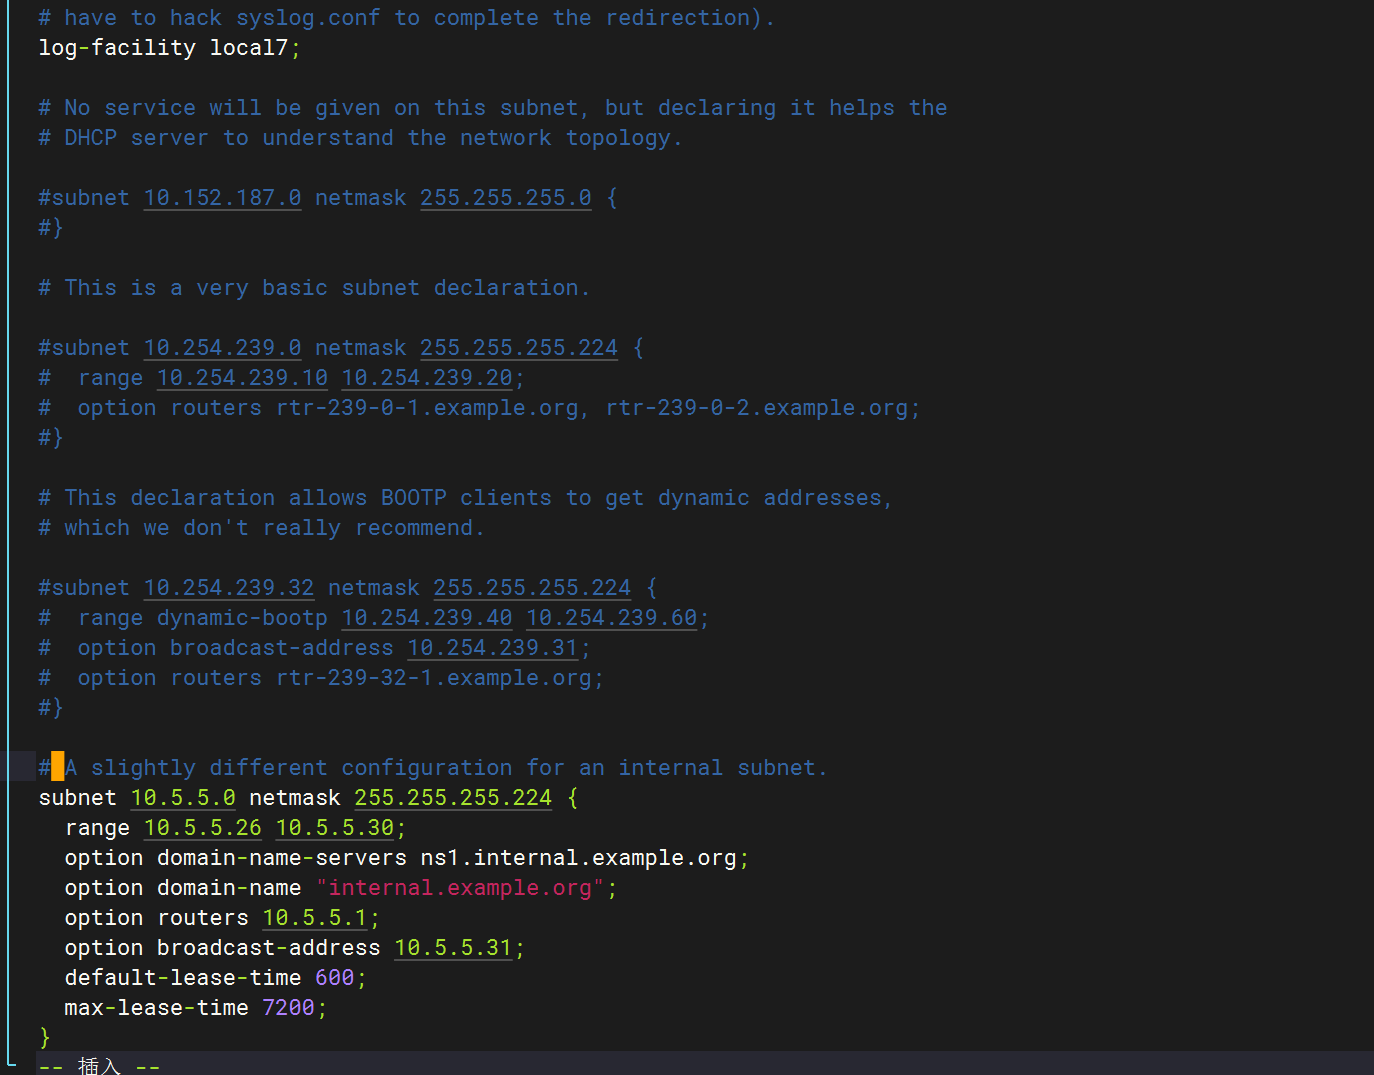
全部删除,只保留以下字段
修改/etc/rsyslog.conf,指向dhcpd.log(日志文件)

配置logstash文件
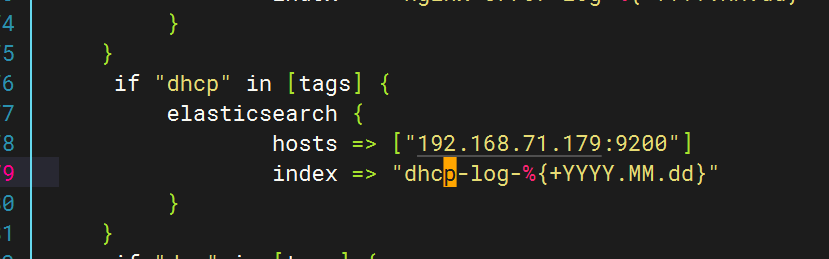
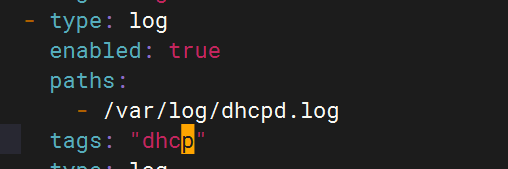
配置filebeat文件
重启应用查看kibana
2.DNS
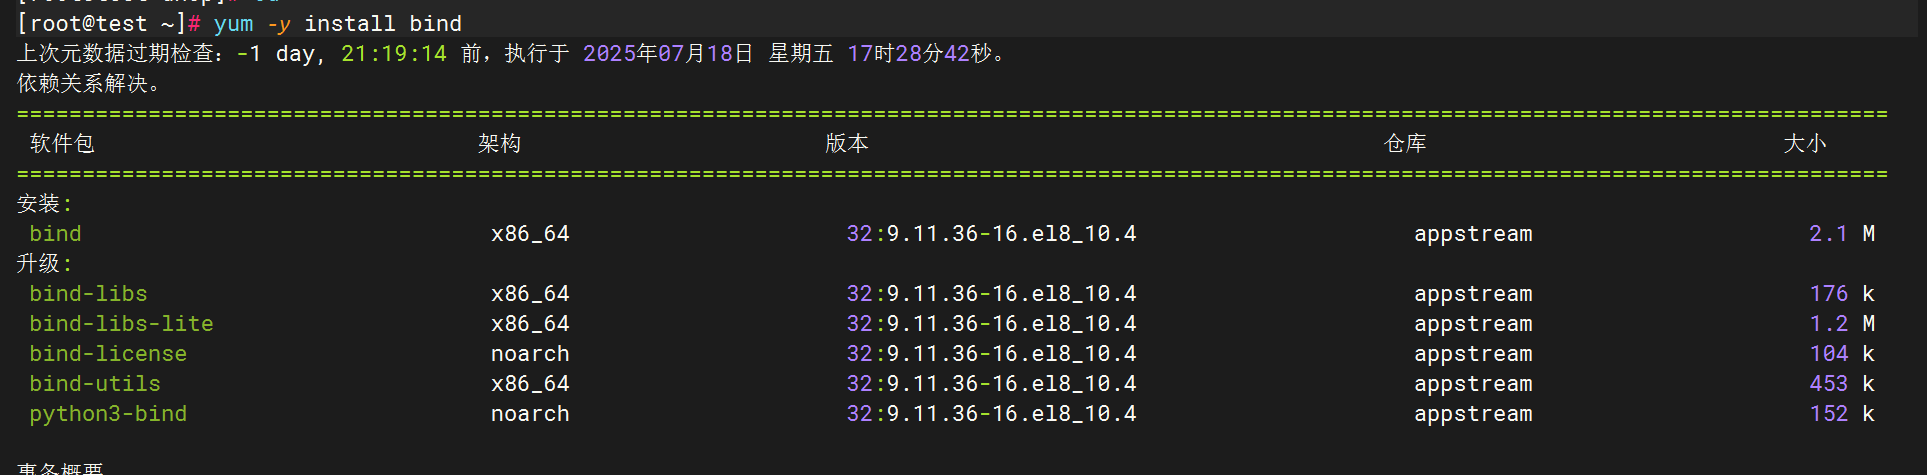
下载DNS(bind)
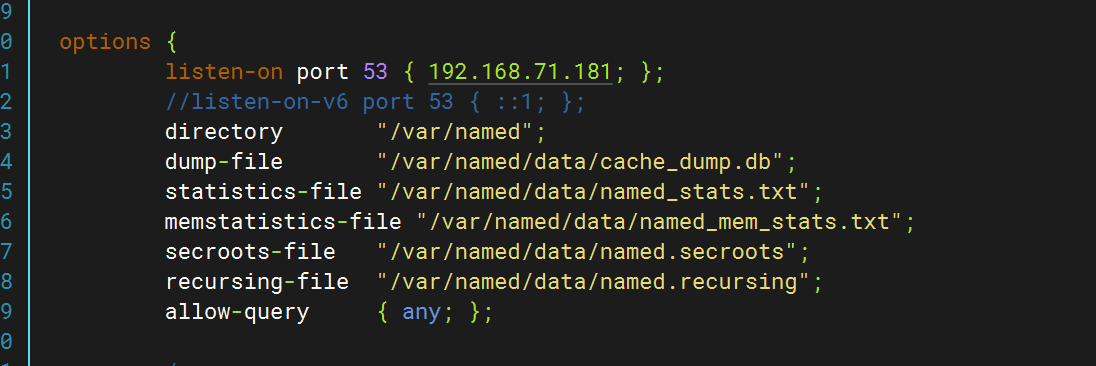
修改配置文件(/etc/named.conf)
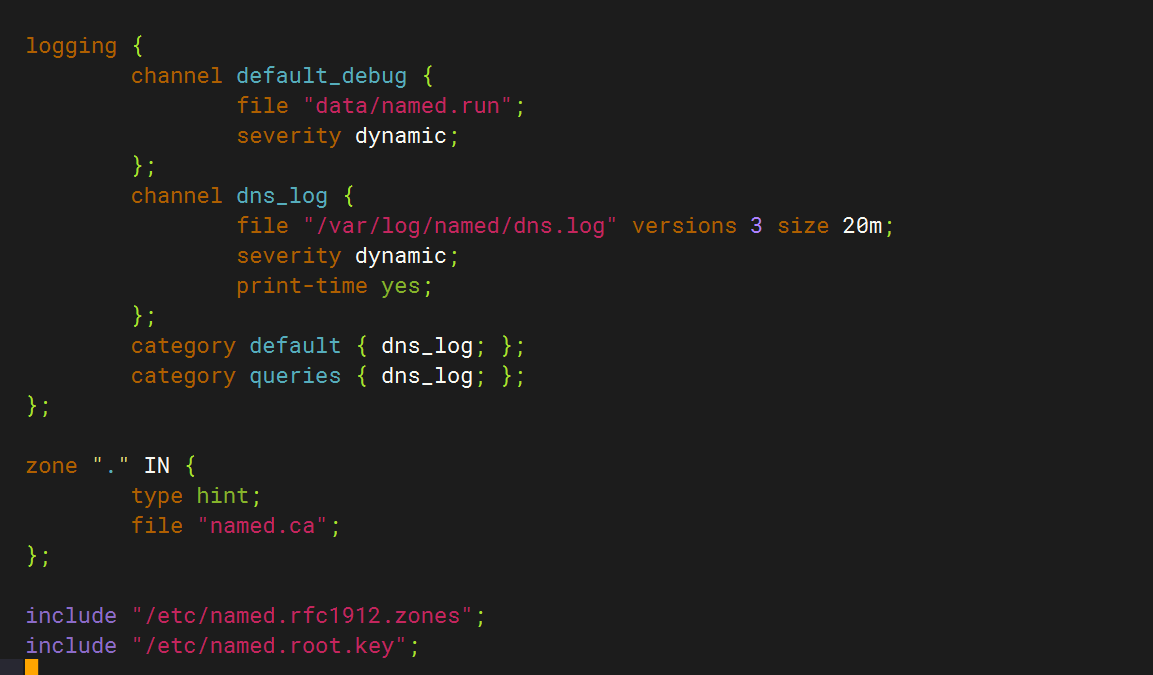
logging {channel default_debug {file "data/named.run";severity dynamic;};channel dns_log {file "/var/log/named/dns.log" versions 3 size 20m;severity dynamic;print-time yes;};category default { dns_log; };category queries { dns_log; };
};
创建日志目录并赋权
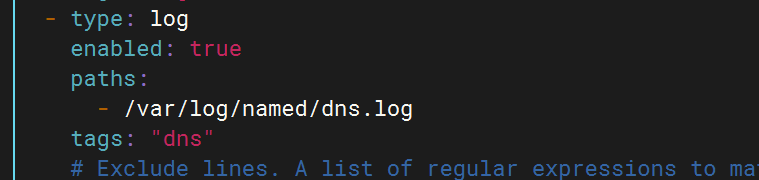
 配置filebeat文件
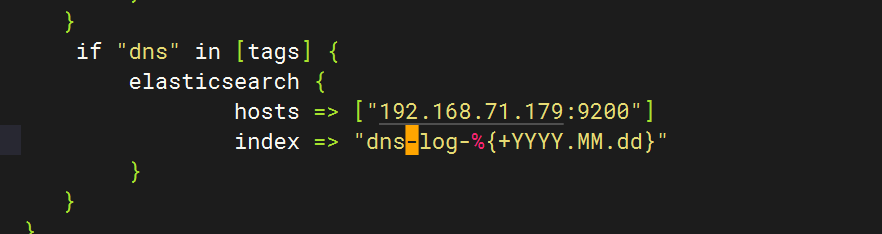
 配置logstash文件
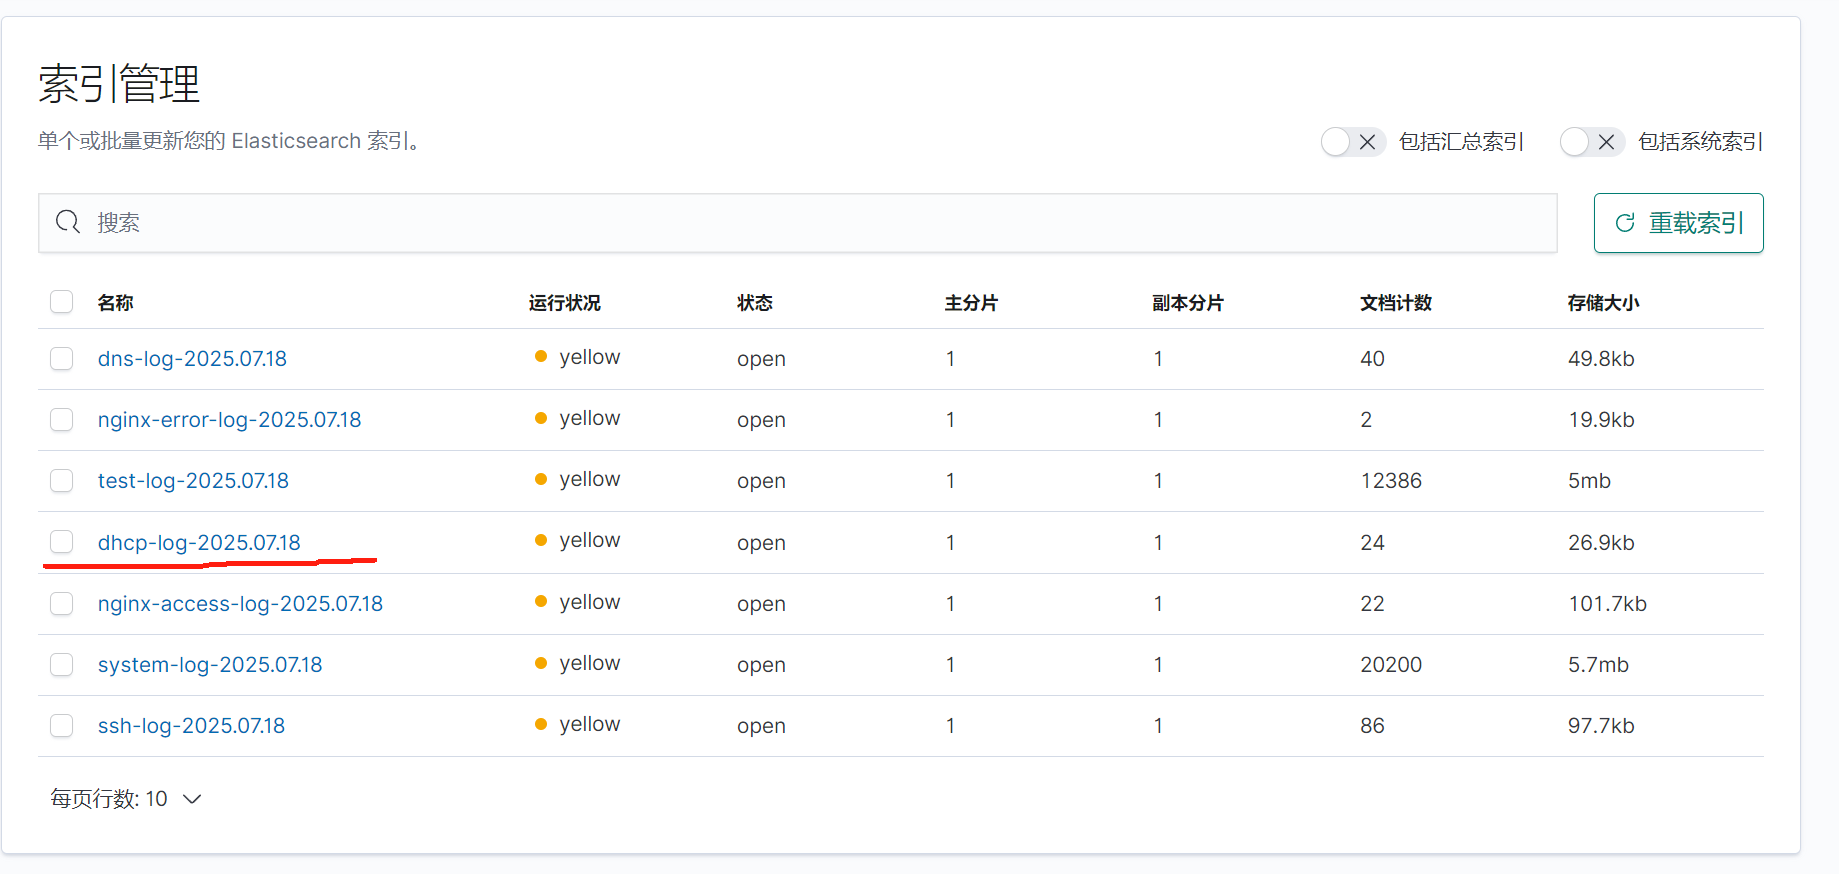
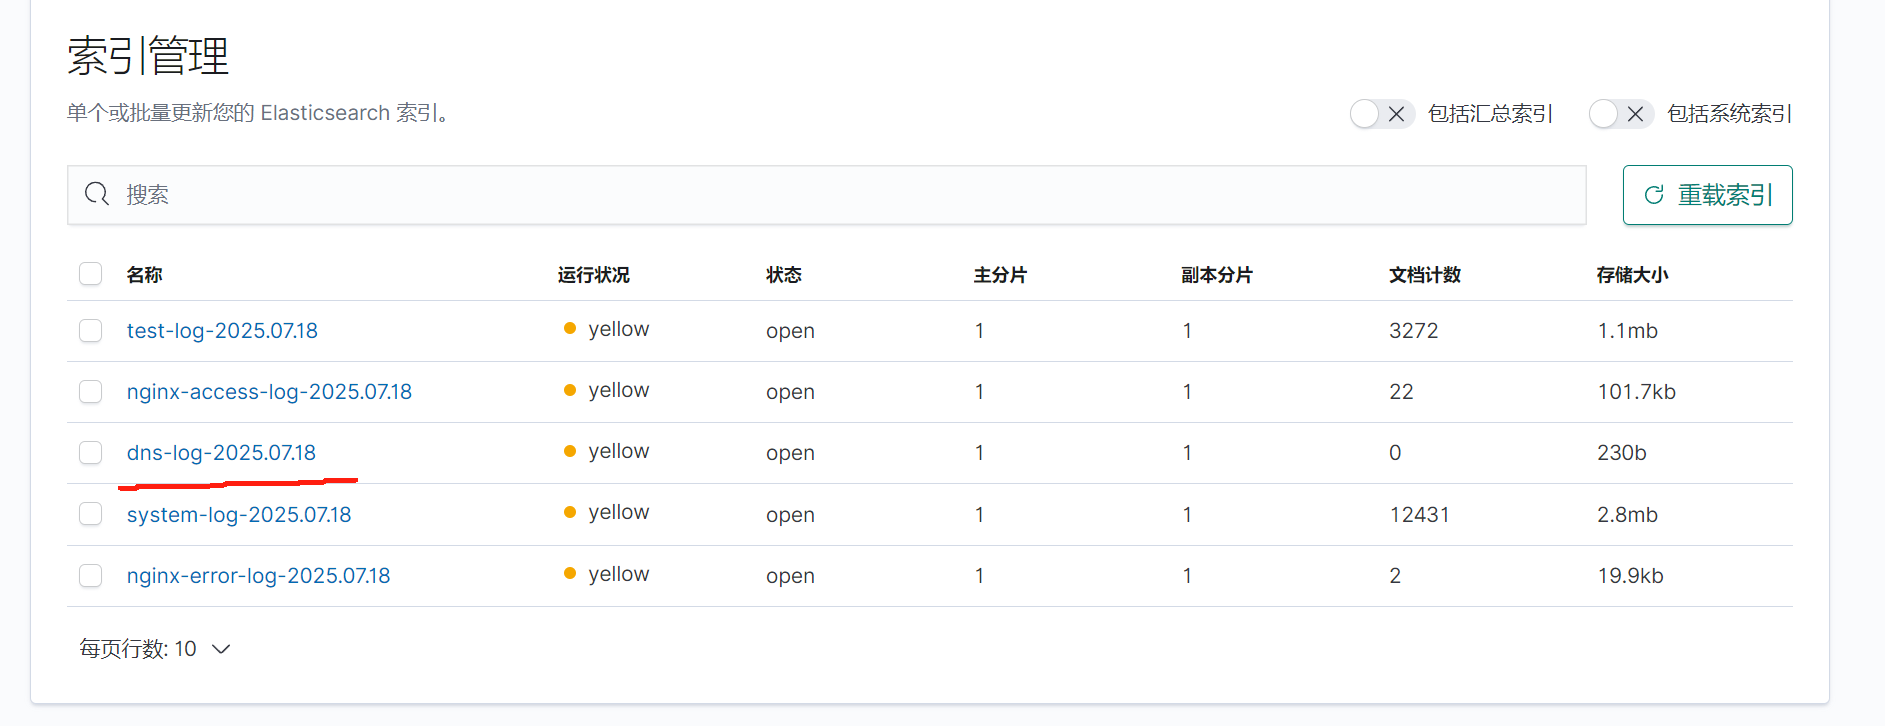
全部启动后在kibana查看日志
3.SSH
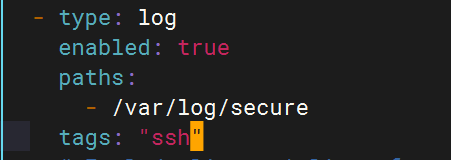
ssh的日志文件路径为/var/log/secure
配置文件
Filebeat配置
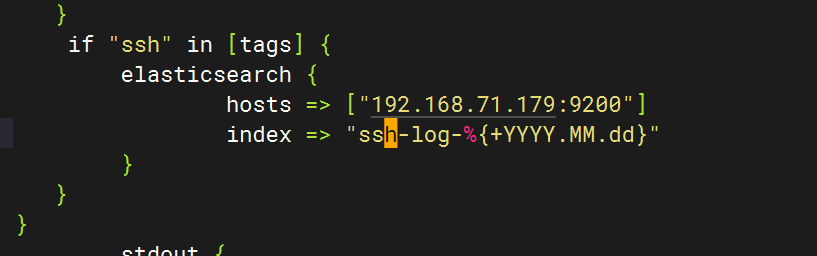
Logstash配置
重启应用

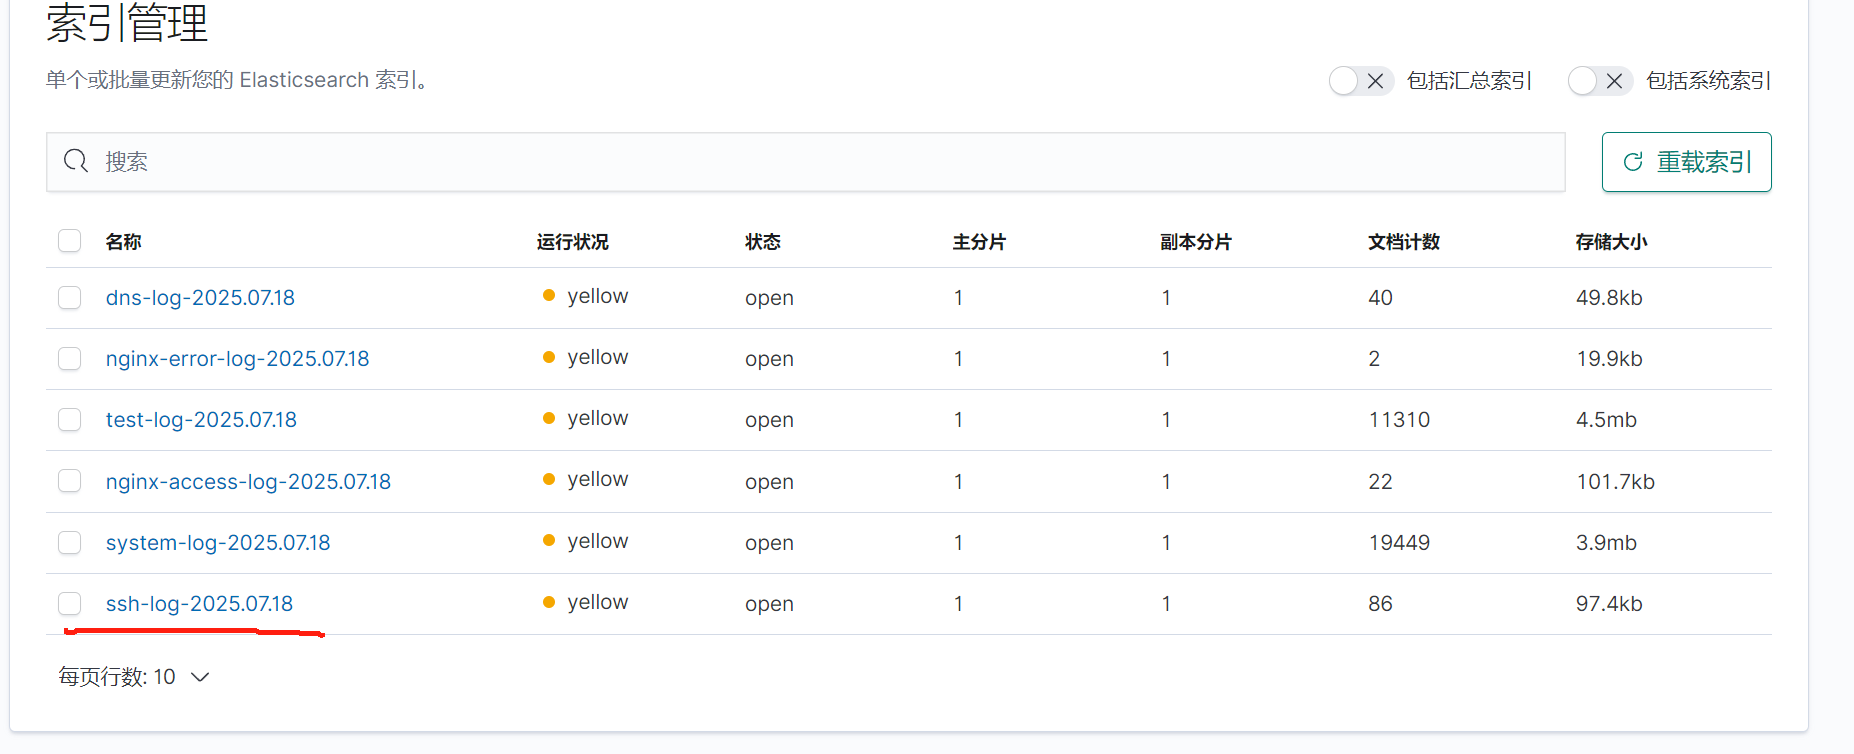
检查kibana
4.Rsync
配置rsync
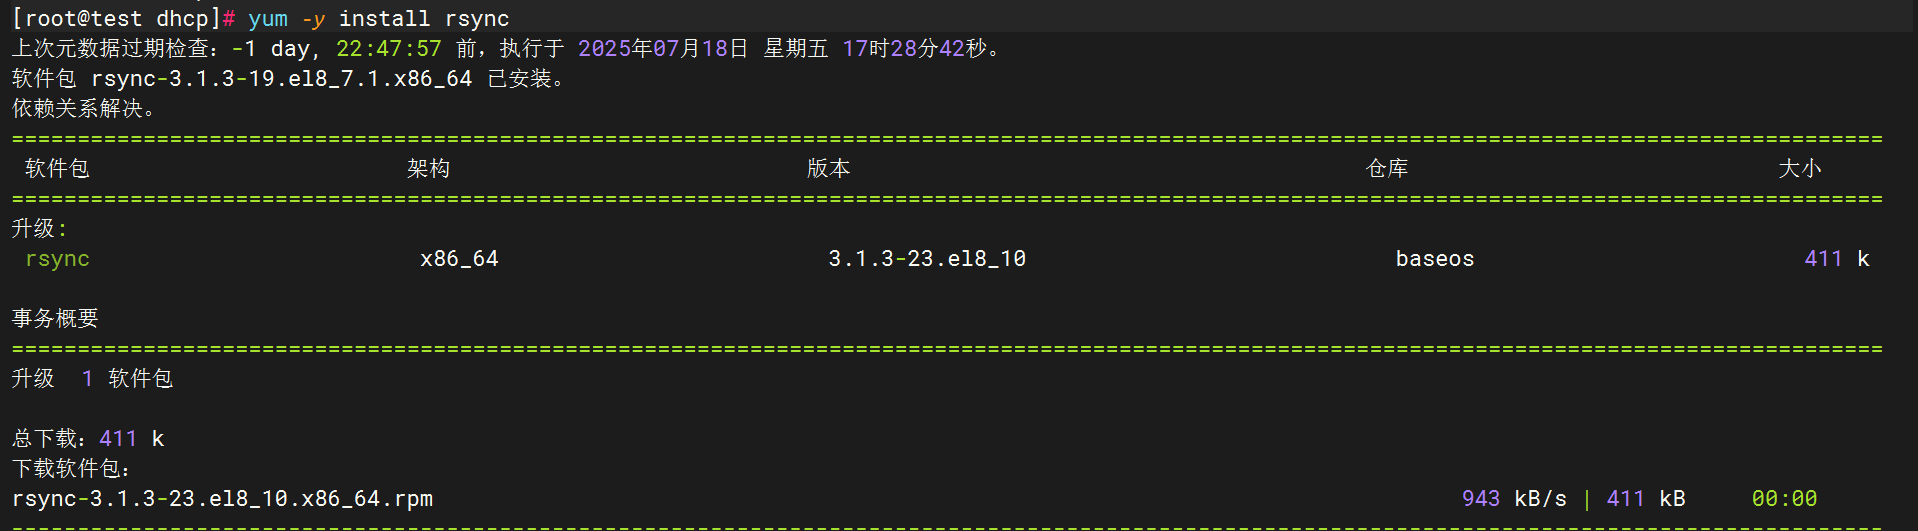
下载rsync
创建服务配置文件
sudo tee /usr/lib/systemd/system/rsyncd.service <<'EOF'
[Unit]
Description=fast remote file copy program daemon
Documentation=man:rsyncd(8)
After=network.target[Service]
EnvironmentFile=/etc/sysconfig/rsyncd
ExecStart=/usr/bin/rsync --daemon --no-detach $OPTIONS[Install]
WantedBy=multi-user.target
EOF
创建环境配置文件
sudo tee /etc/sysconfig/rsyncd <<'EOF'
# Options for rsync daemon
OPTIONS=""
EOF
创建主配置文件
sudo tee /etc/rsyncd.conf <<'EOF'
# 最小化配置示例
uid = root
gid = root
use chroot = yes
max connections = 4
pid file = /var/run/rsyncd.pid# 示例模块
[backup]path = /tmp/backupcomment = Backup Arearead only = no
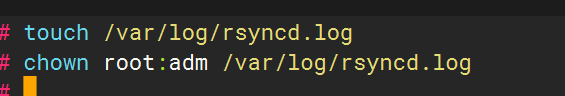
EOF创建日志文件并赋权:
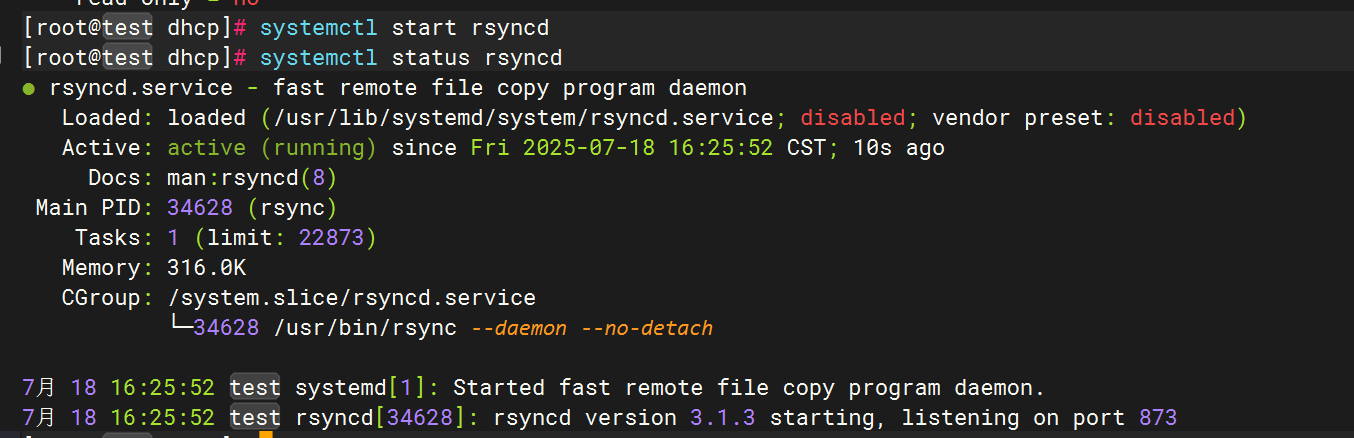
启动服务
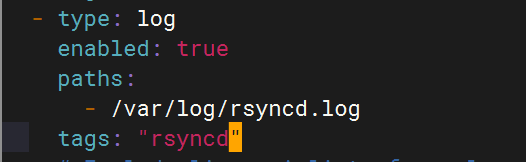
Filebeat配置
logstash配置
重启服务,使用rsync命令向目标主机传输文件以生成日志
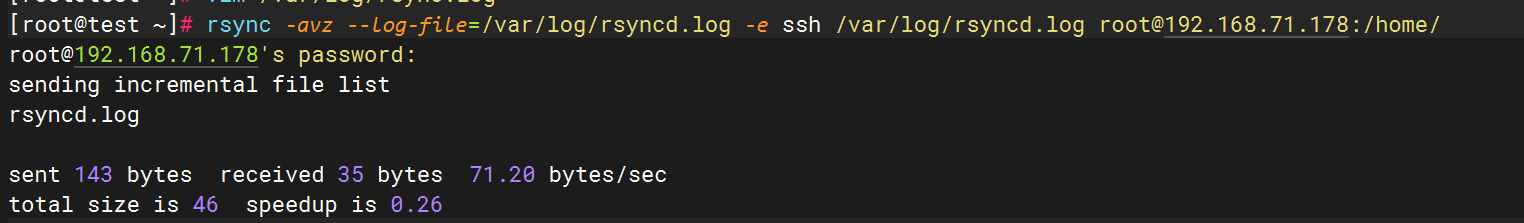
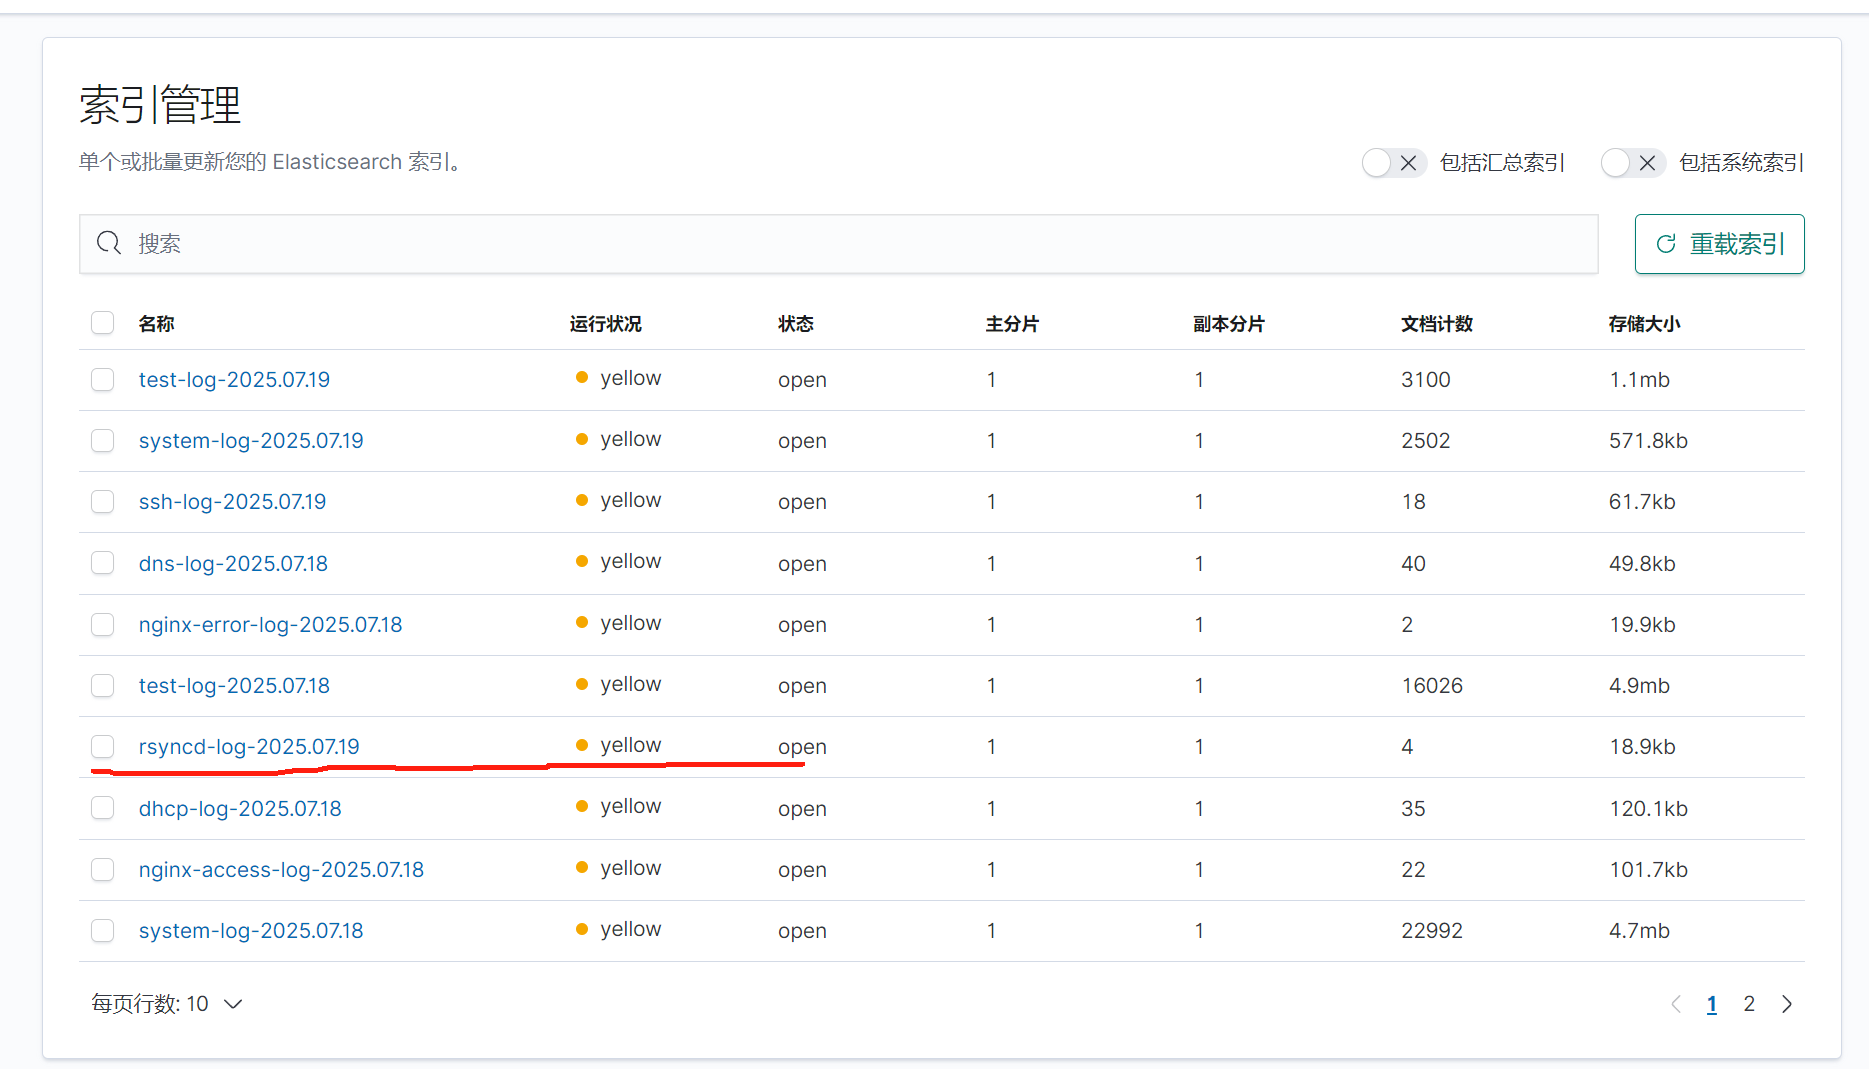
在kibana上查看
五.收集Tomcat服务日志
1.安装tomcat
解压安装包
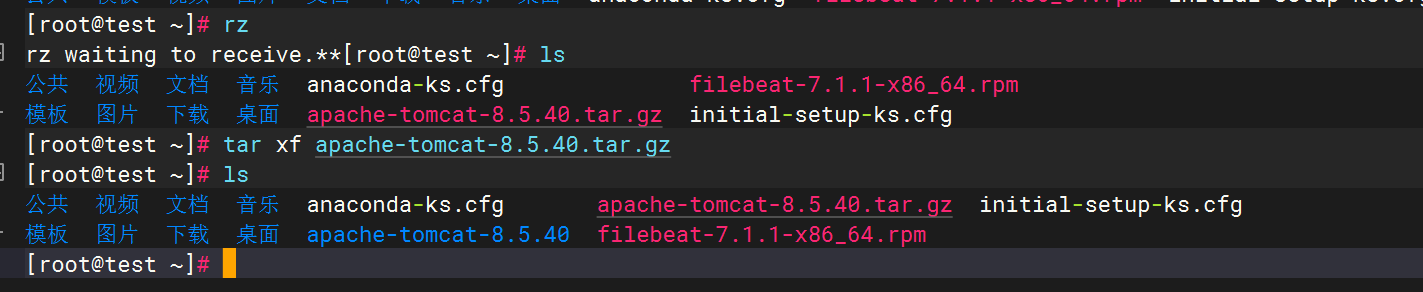
Tomcat安装
![]()
优化启动和关闭命令

2.Tomcat启动验证
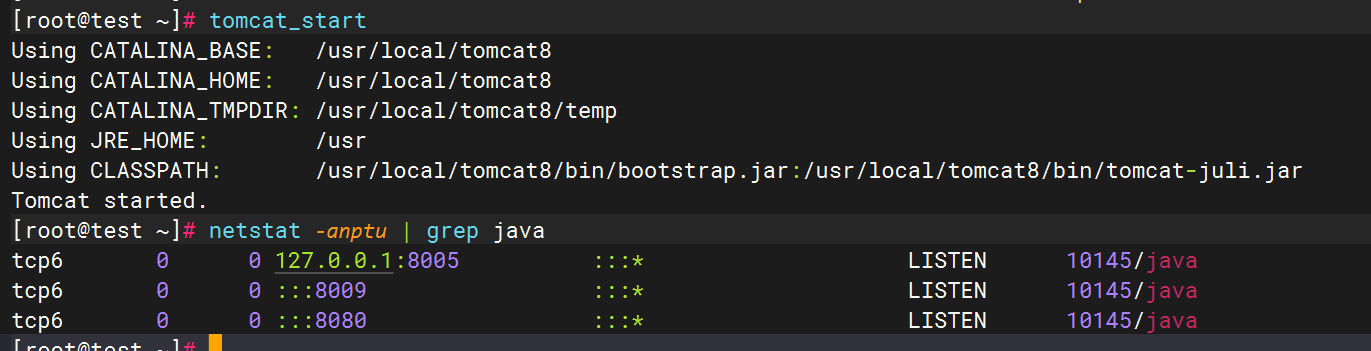
3.配置filebeat文件
4.配置logstash文件
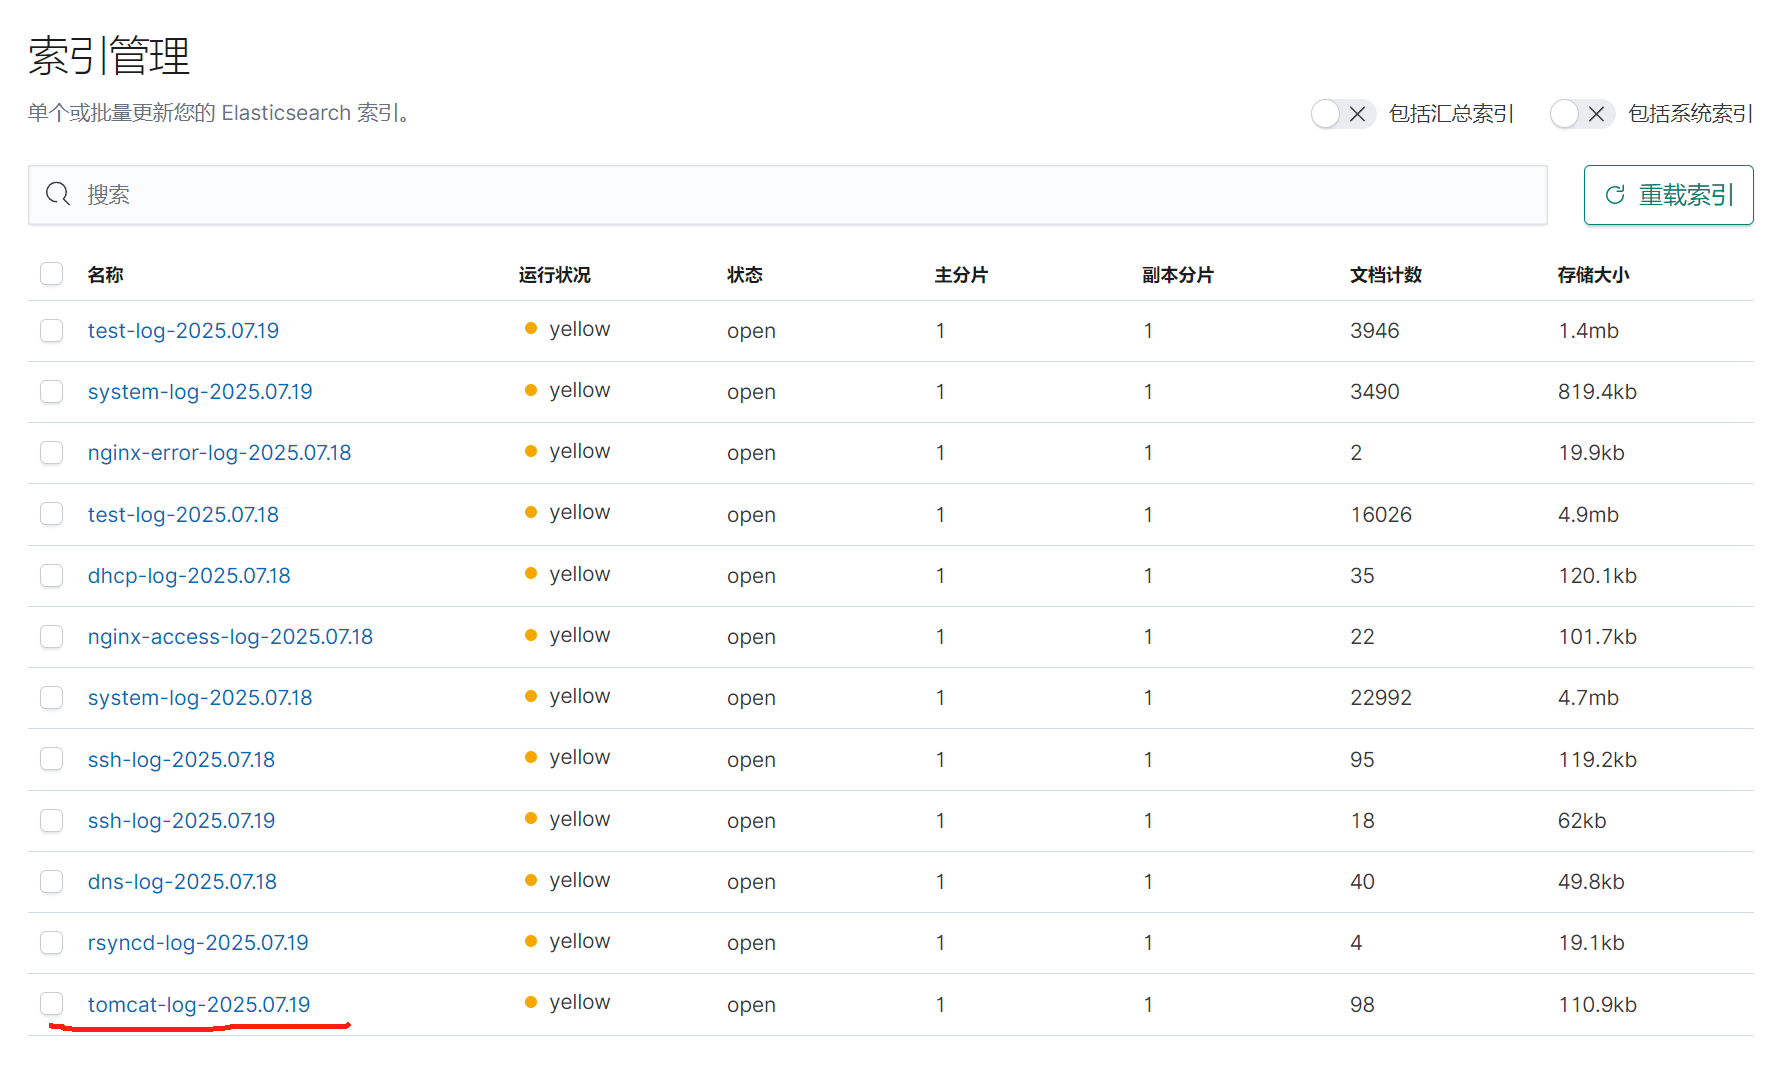
5.重启服务查看kibana
六.MySQL数据库日志收集
1.安装MySQL
2.编辑MySQL日志生成配置
编辑MySQL配置文件(/etc/my.cnf或/etc/mysql/mysql.conf.d/mysqld.cnf
[mysqld]
general_log = 1
general_log_file = /var/log/mysql/general.log
slow_query_log = 1
slow_query_log_file = /var/log/mysql/slow.log
long_query_time = 2  # 慢查询阈值(秒)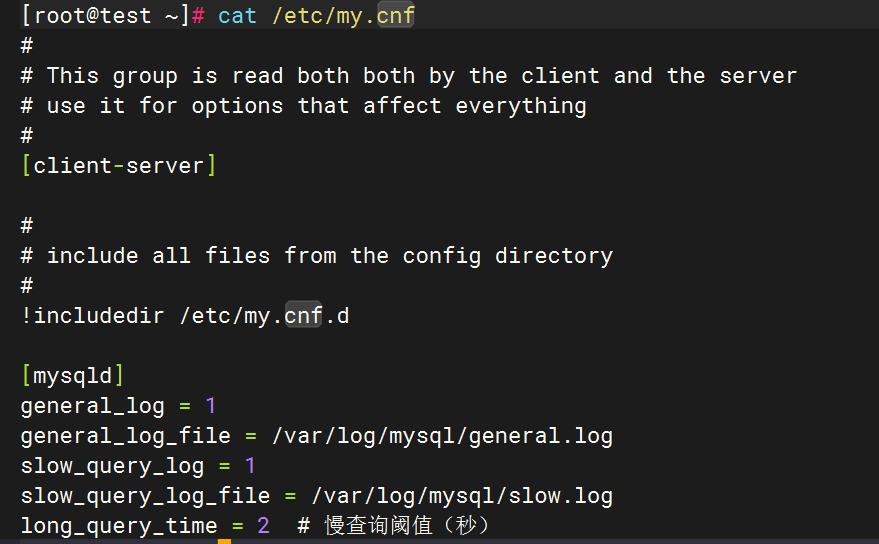
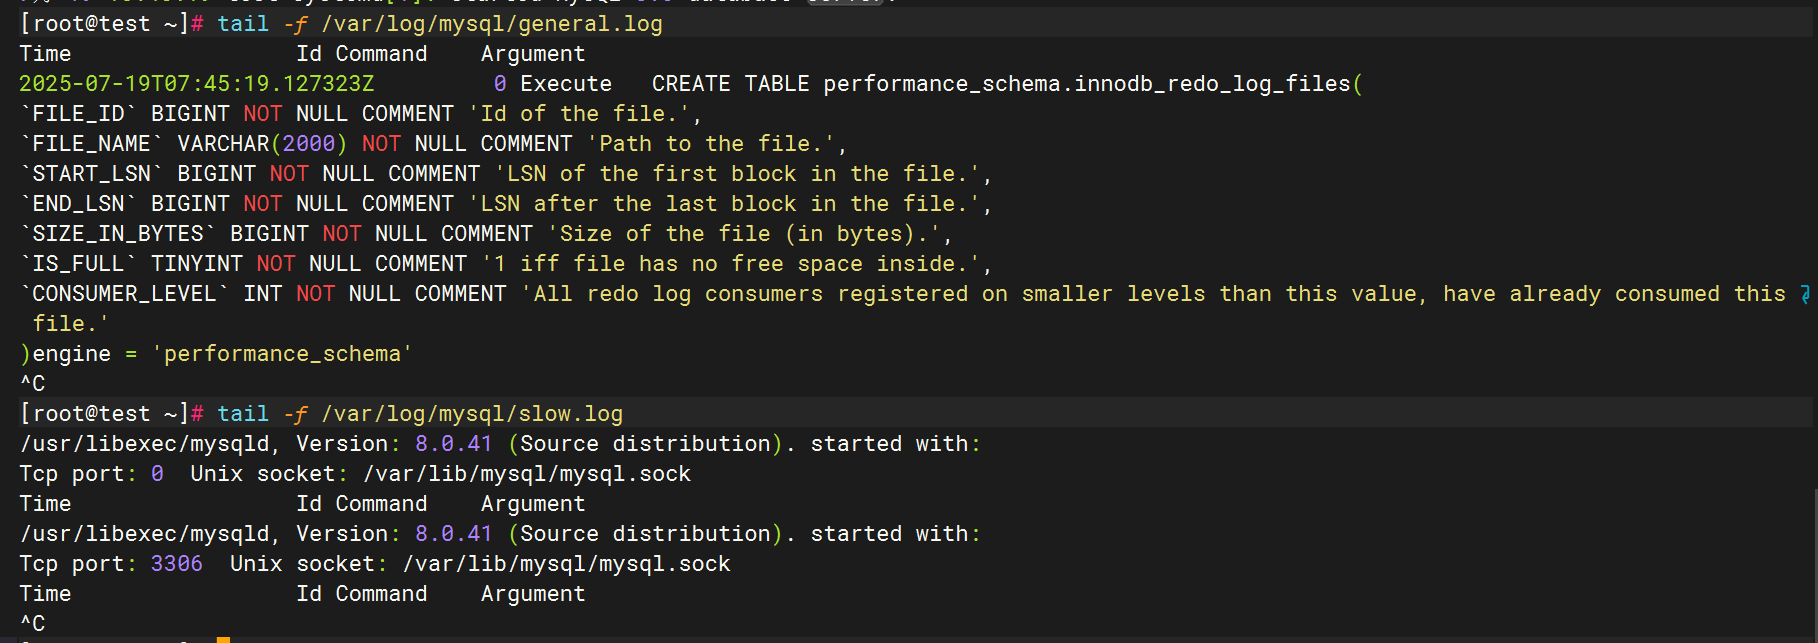
3.启动mysql并验证日志生成
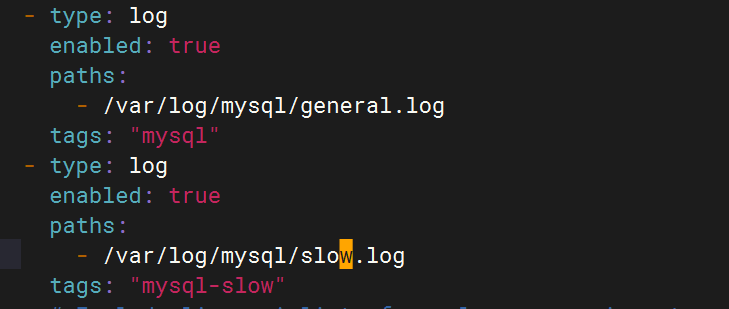
4.配置filebeat文件
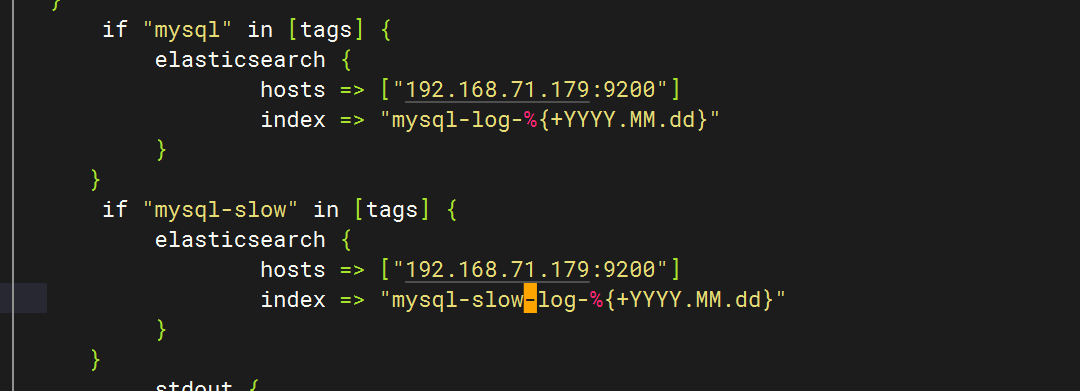
5.配置logstash文件
6.重启服务查看kibana
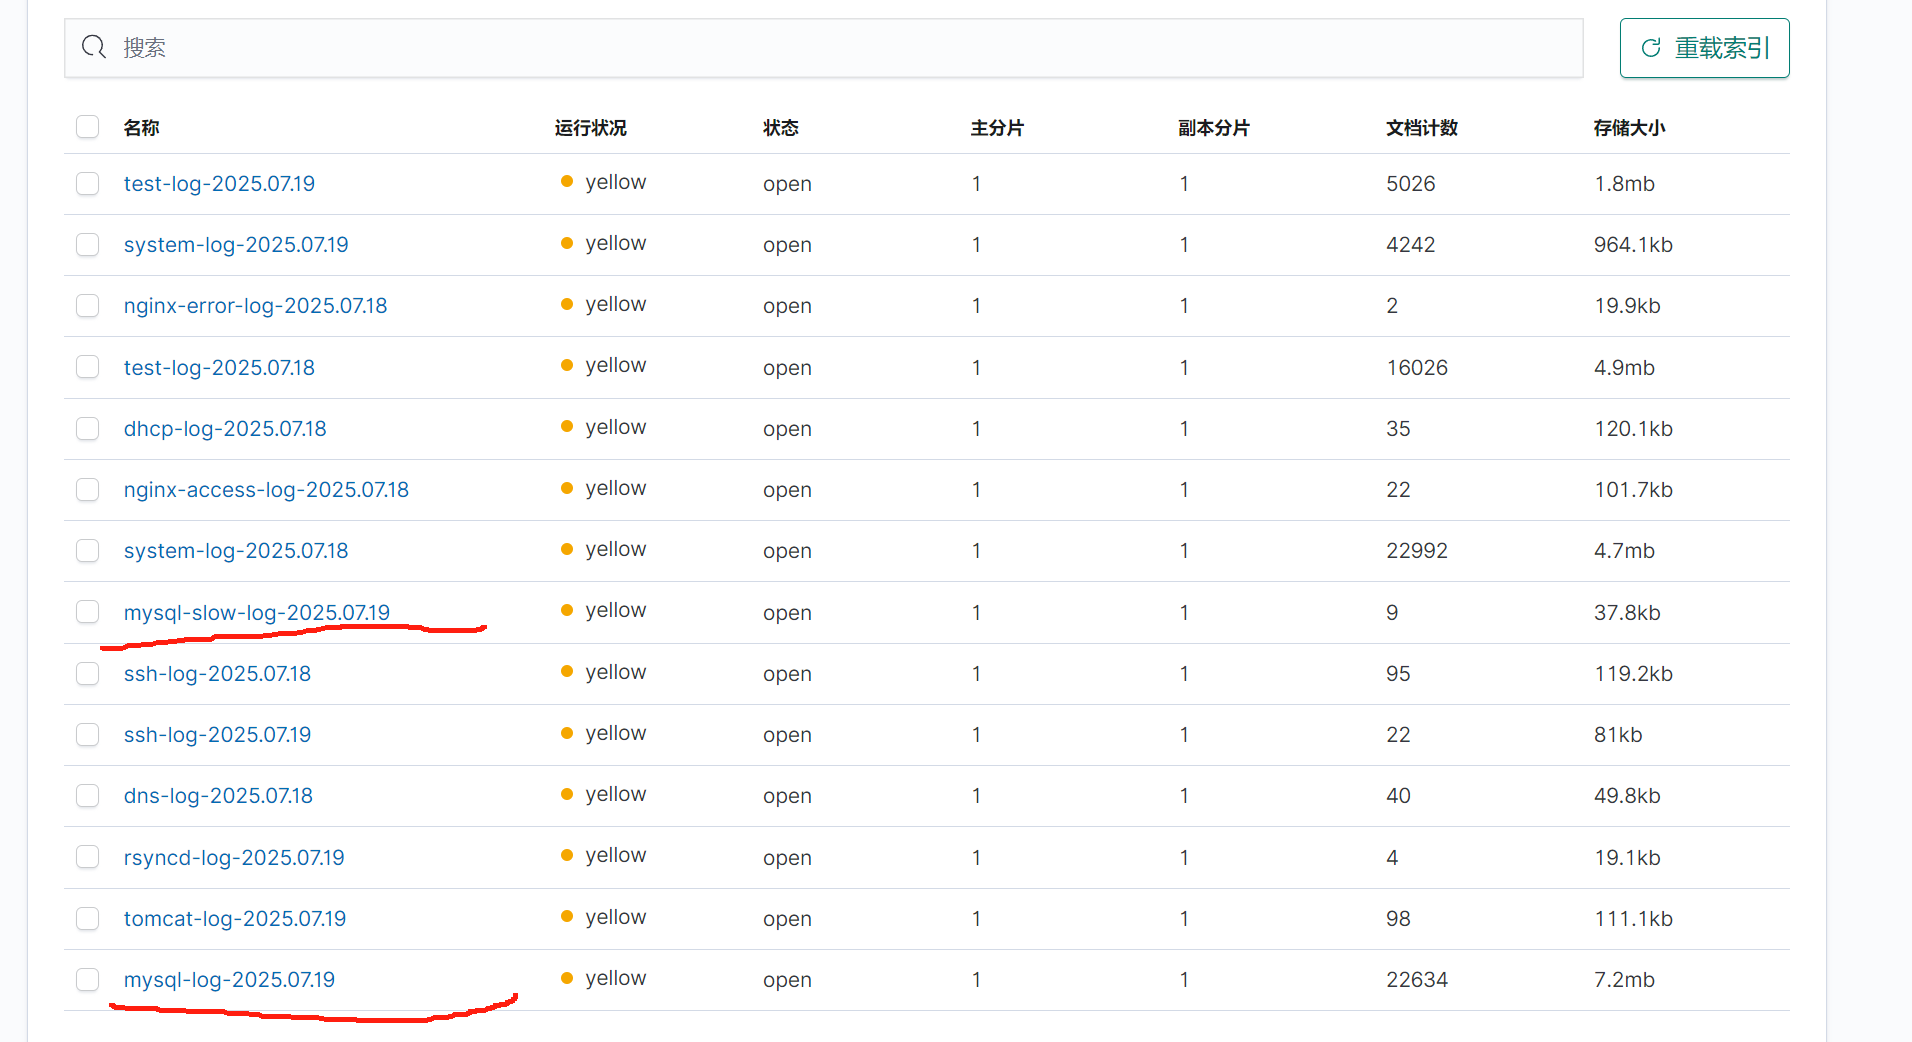
通用日志和慢日志
七.NFS日志收集
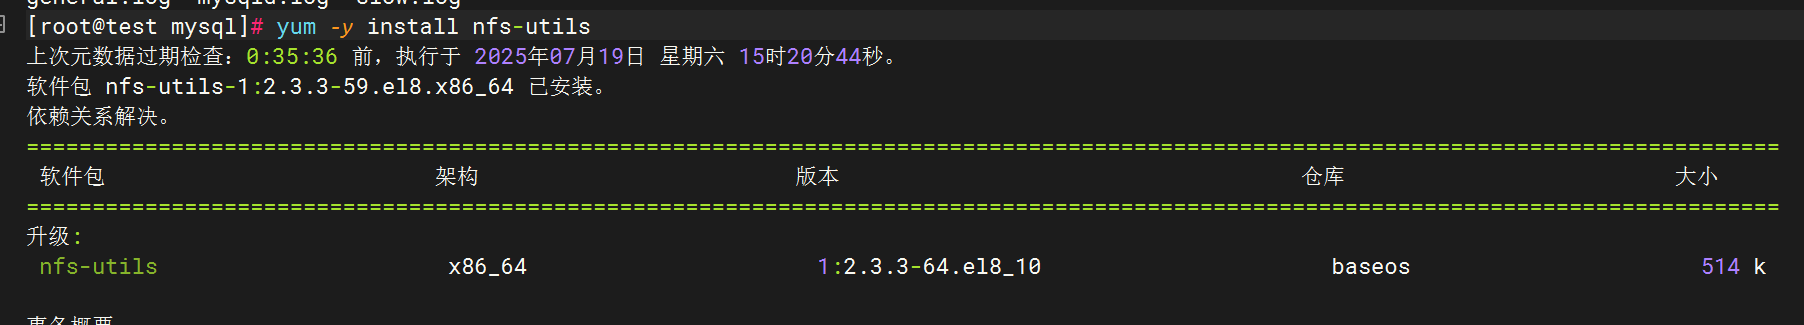
1.安装NFS
2.启用NFS日志
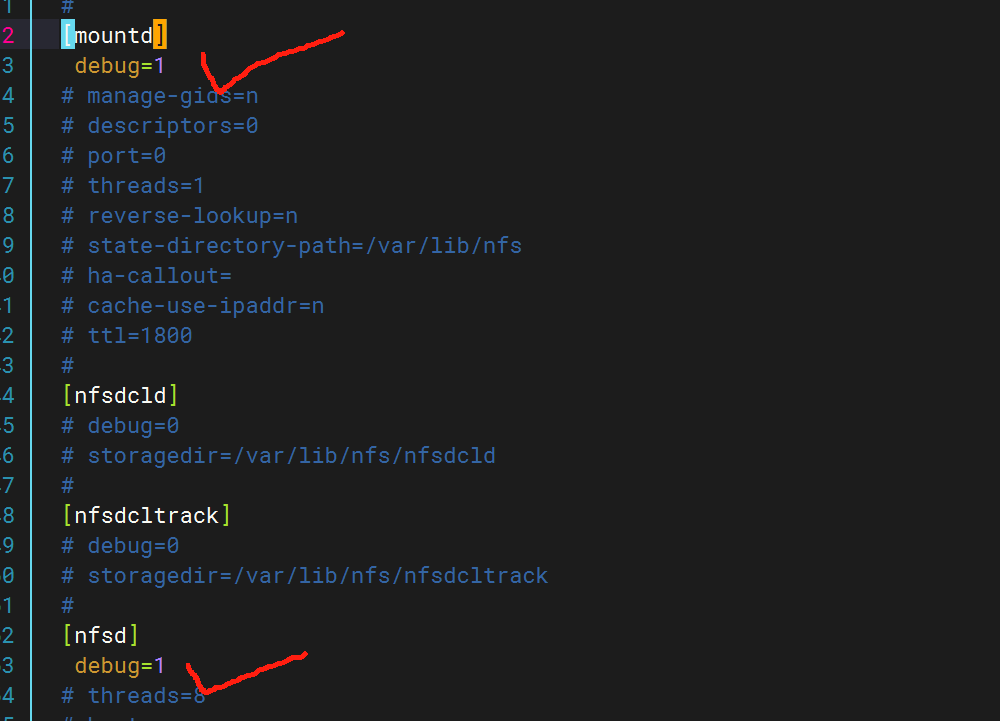
编辑NFS配置文件(通常为/etc/nfs.conf或/etc/sysconfig/nfs),确保日志模块启用并指定路径
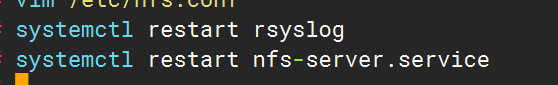
配置rsyslog.log文件,为nfs增加日志路径

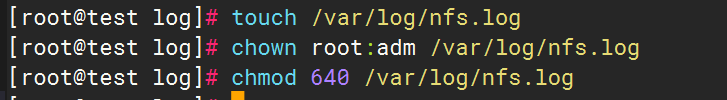
创建日志文件
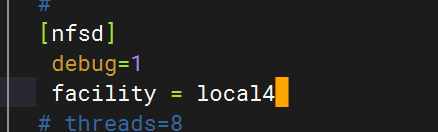
在NFS配置中指定facility
重启rsyslog服务
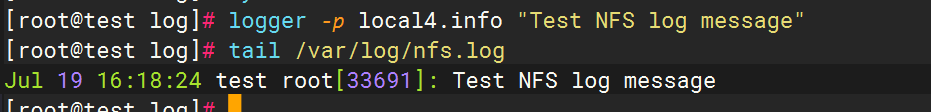
验证配置:
发送测试日志(使用local4 facility),检查日志是否生成
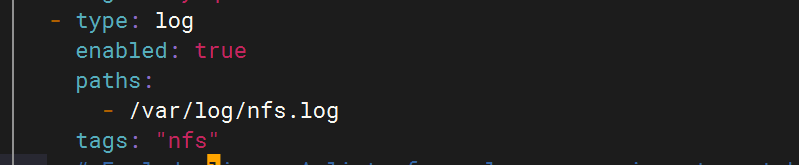
3.配置filebeat文件
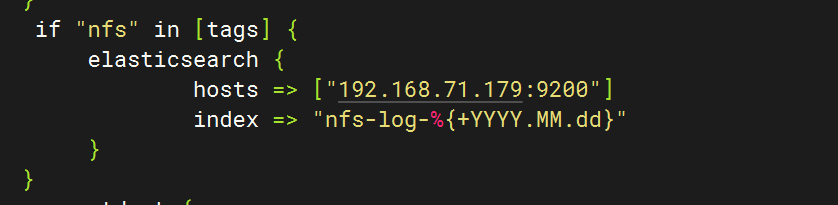
4.配置logstash文件
5.重启服务查看kibana

八.Redis数据库日志收集
1.安装redis数据库
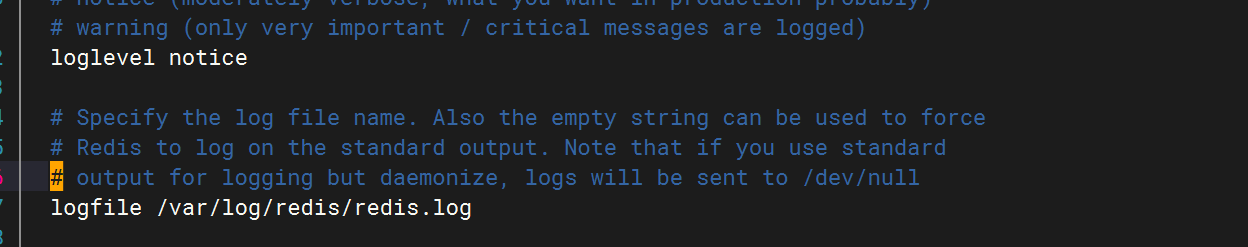
2.Redis日志生成配置
修改Redis配置文件
编辑/etc/redis.conf,启用日志并指定路径:
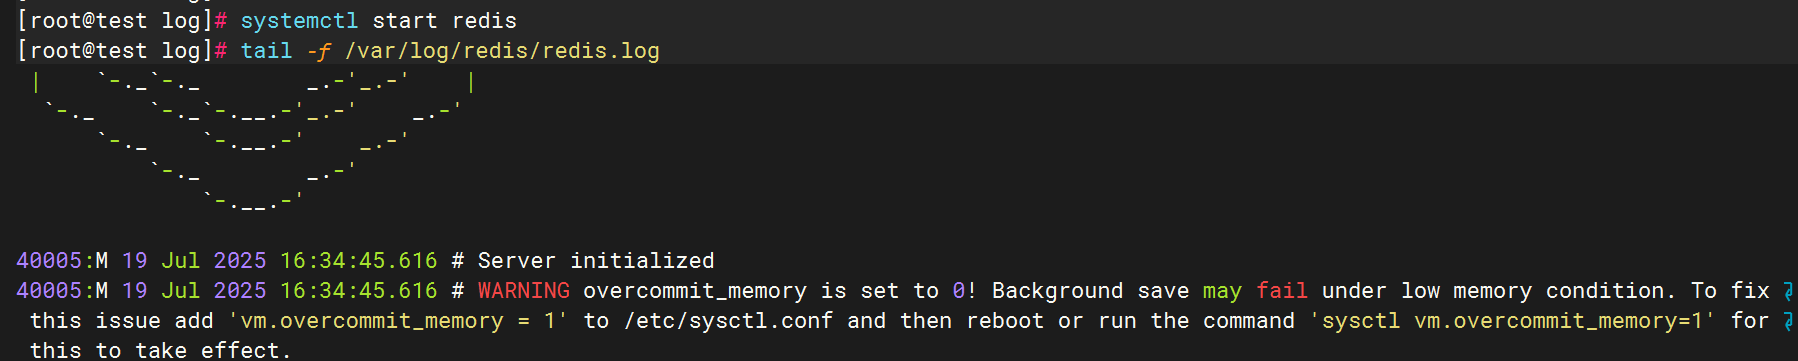
验证日志生成
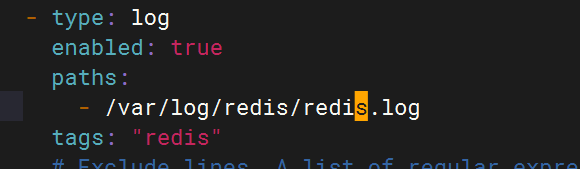
3.配置filebeat文件
4.配置logstash文件
5.重启服务查看kibana

九.LVS日志收集
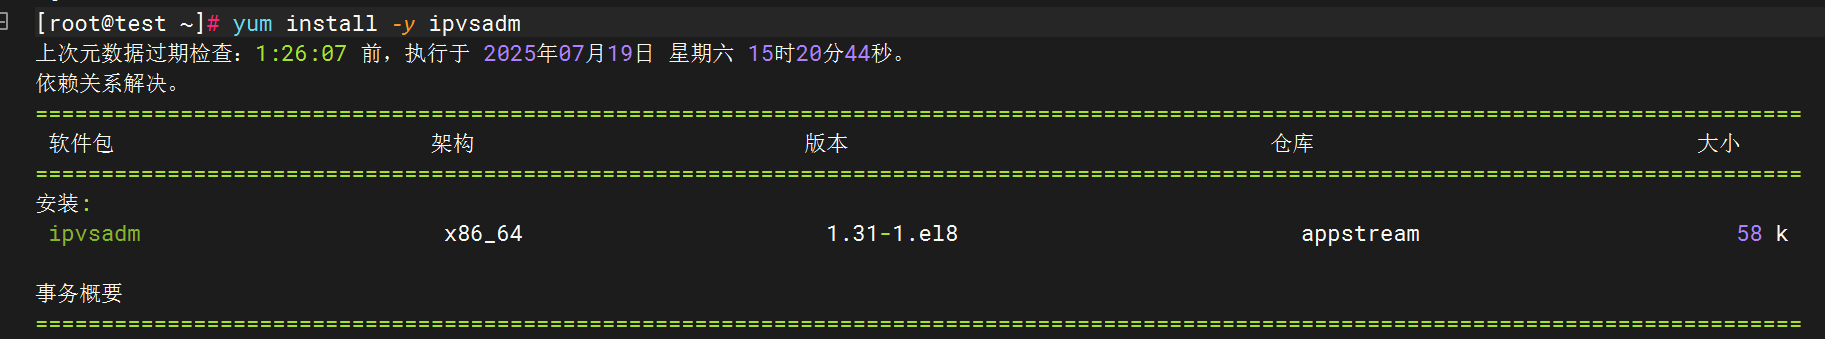
1.下载安装ipvsadm
2.配置rsyslog文件
在/etc/rsyslog.conf内加入
kern.* /var/log/lvs.log
手动触发LVS日志生成
通过模拟请求触发LVS转发,使系统产生日志:
curl http://<VIP> # 替换为你的虚拟IP(VIP)或在另一台机器访问VIP服务。
或者可以手动添加规则使日志内容增加
ifconfig ens34:0 192.168.71.200/24 #生成临时网址ipvsadm -a -t 192.168.71.200:80 -s rr
ipvsadm -E -t 192.168.71.200:80 -s rr -p 60
ipvsadm -a -t 192.168.71.200:80 -r 192.168.1.101:80 -g
ipvsadm -a -t 192.168.71.200:80 -r 192.168.1.102:80 -g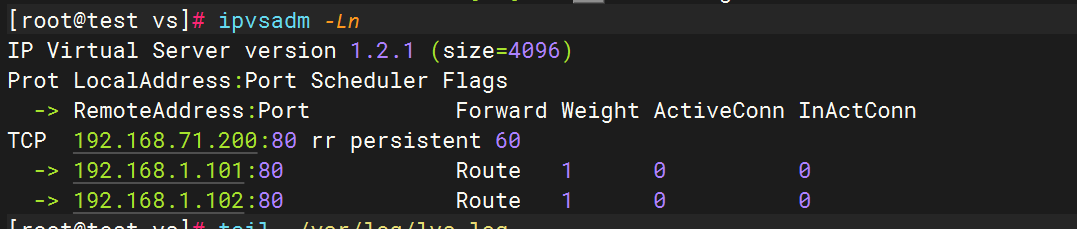
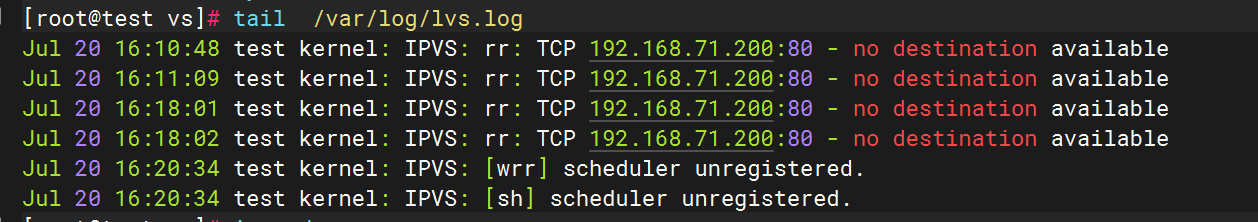
查看日志内容是否生成
2.配置filebeat文件
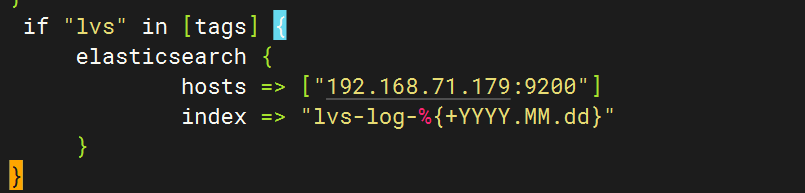
3.配置logstash文件
4.重启服务后查看kibana

十.Haproxy日志收集
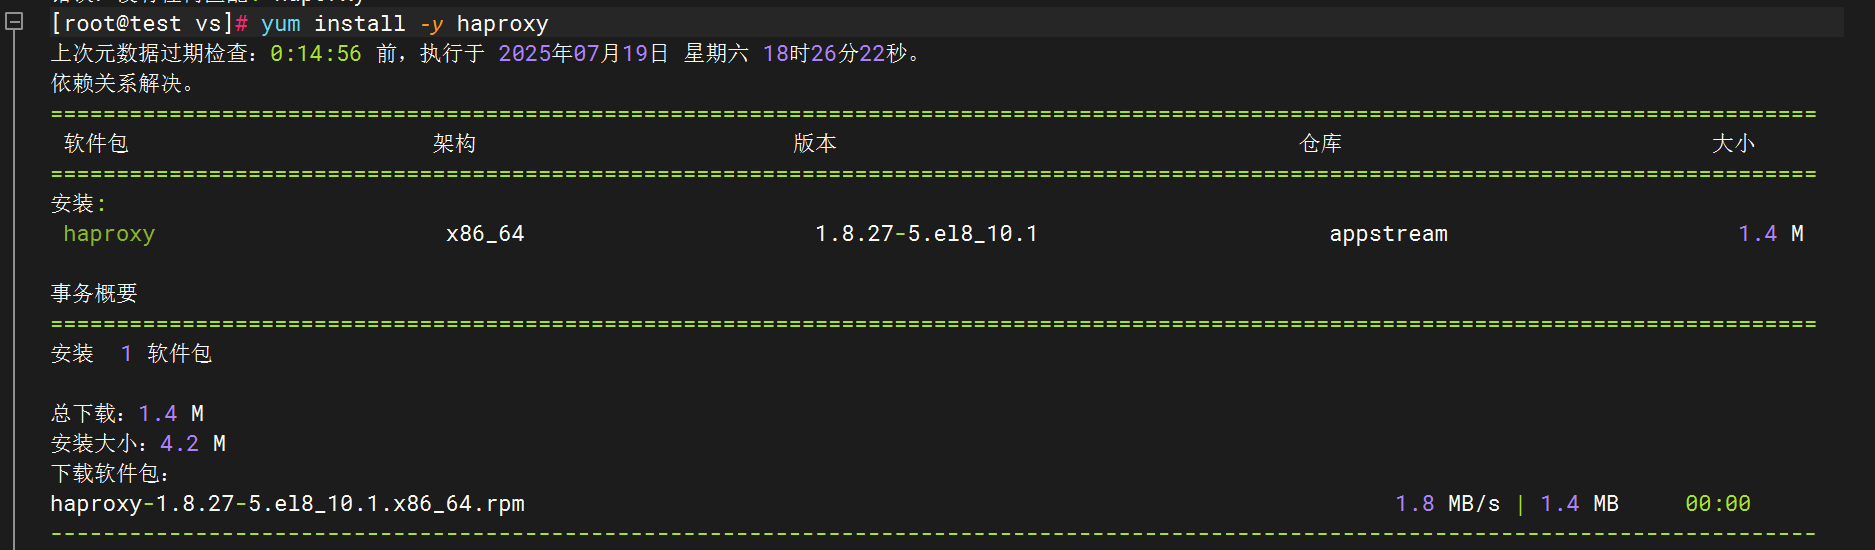
1.安装haproxy
2.配置haproxy文件
cat > /etc/haproxy/haproxy.cfg <<'EOF'
globallog 127.0.0.1 local0 info  # 重要:使用local0设备defaultslog     globalmode    httpoption  httplogoption  dontlognulltimeout connect 5000timeout client  50000timeout server  50000# 添加您的具体frontend/backend配置
# frontend示例:
frontend http-inbind *:80default_backend serversbackend serversserver server1 192.168.1.100:80 check
EOF
3.配置Rsyslog收集HAProxy日志
创建文件 /etc/rsyslog.d/haproxy.conf
$ModLoad imudp
$UDPServerRun 514
local0.* /var/log/haproxy.log  # 本地存储
local0.* @logstash_ip:5140     # 转发到Logstash
4.修改filebeat文件
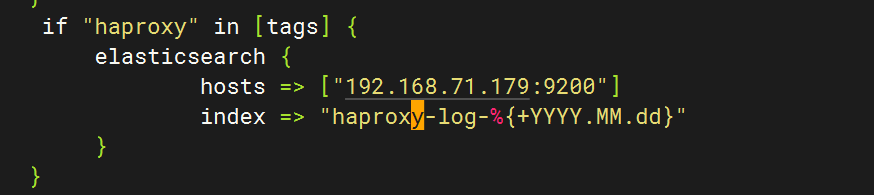
5.修改logstash文件
6.重启全部服务,登录kibana查看日志

十一.Keepalived日志收集
1.安装keepalived
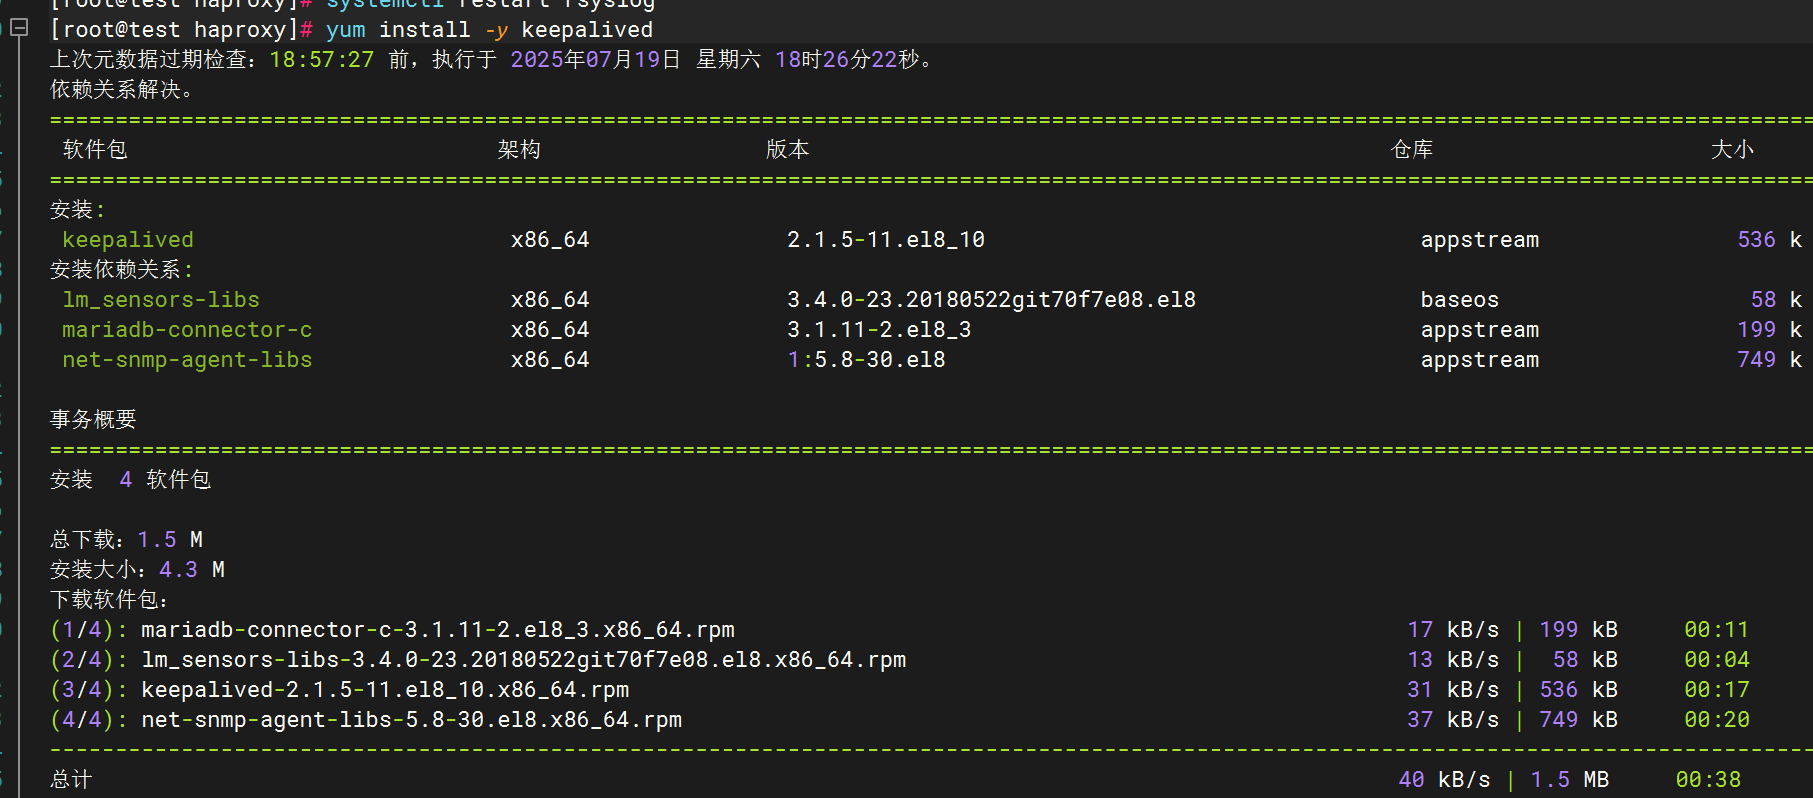
2.配置keepalived日志输出
创建日志目录
sudo mkdir -p /var/log/keepalived
sudo touch /var/log/keepalived/keepalived.log
sudo chown -R root:keepalived /var/log/keepalived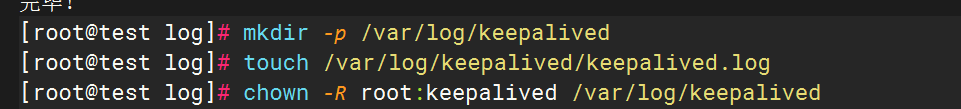
编辑keepalived配置文件,
vim /etc/sysconfig/keepalived添加以下行
KEEPALIVED_OPTIONS="-D -d -S 0"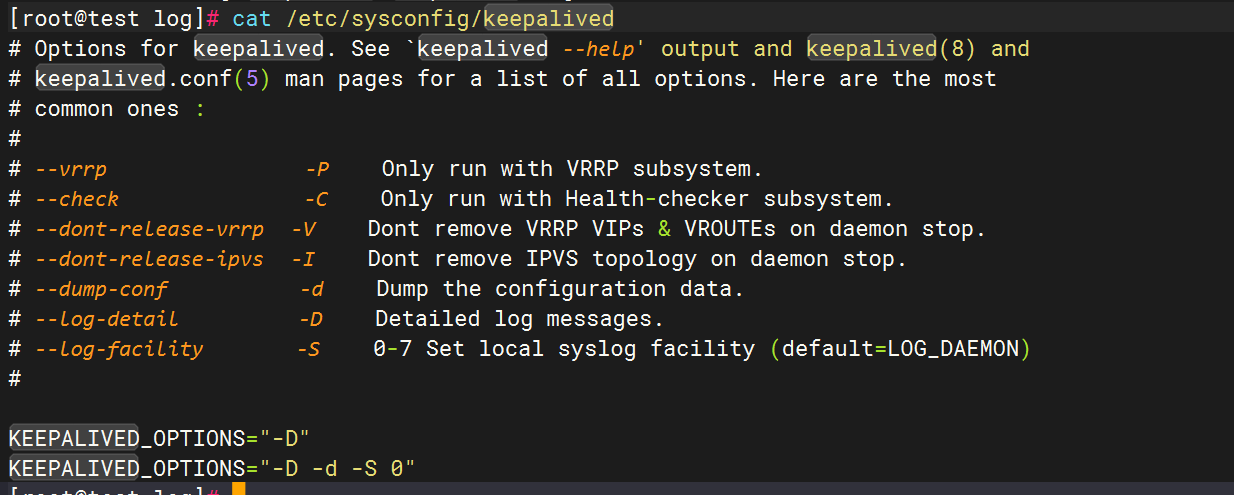
配置rsyslog,在文件末尾添加
local0.* /var/log/keepalived/keepalived.log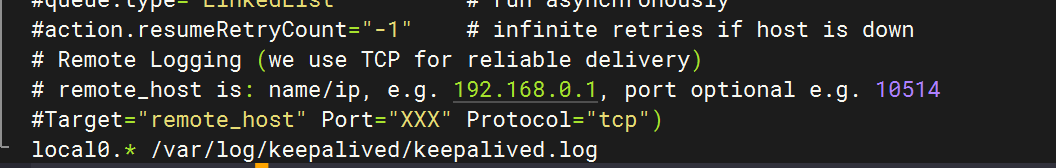
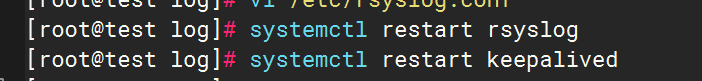
重启服务
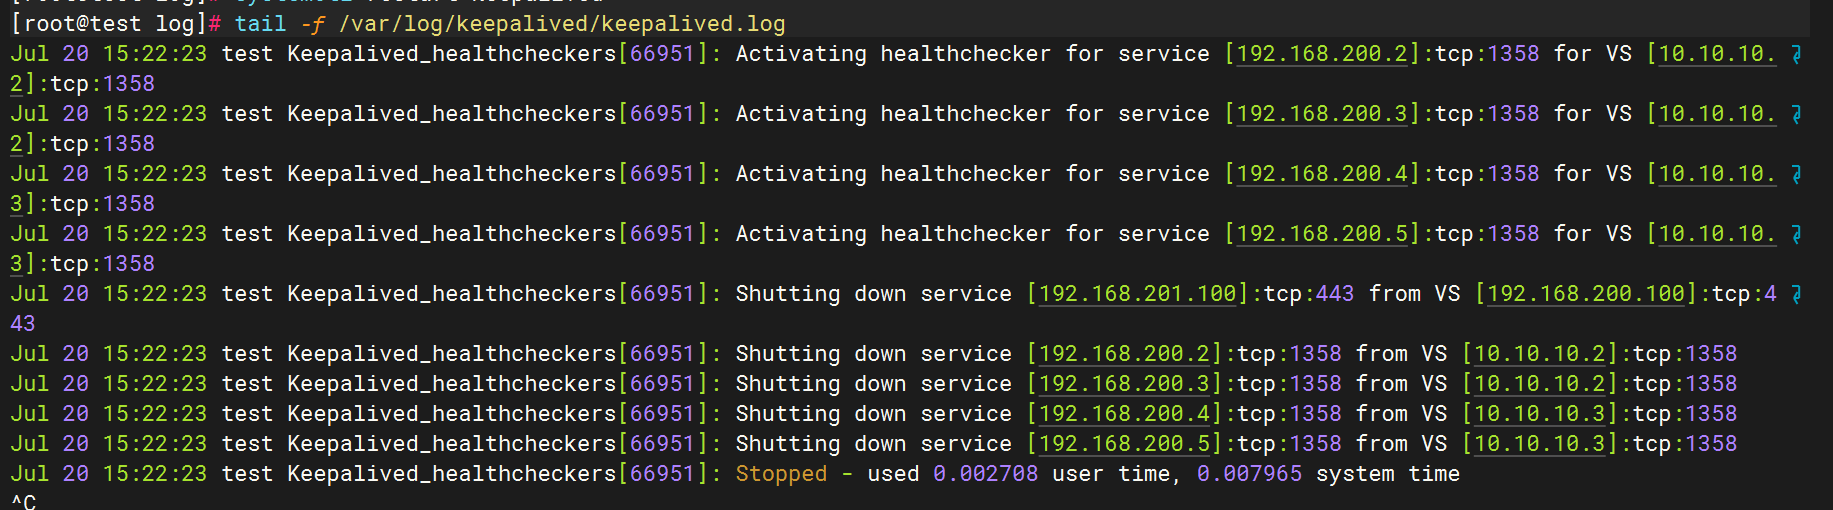
3.测试日志生成
4.修改filebeat文件
5.修改logstash文件
6.重启全部服务,检查kibana

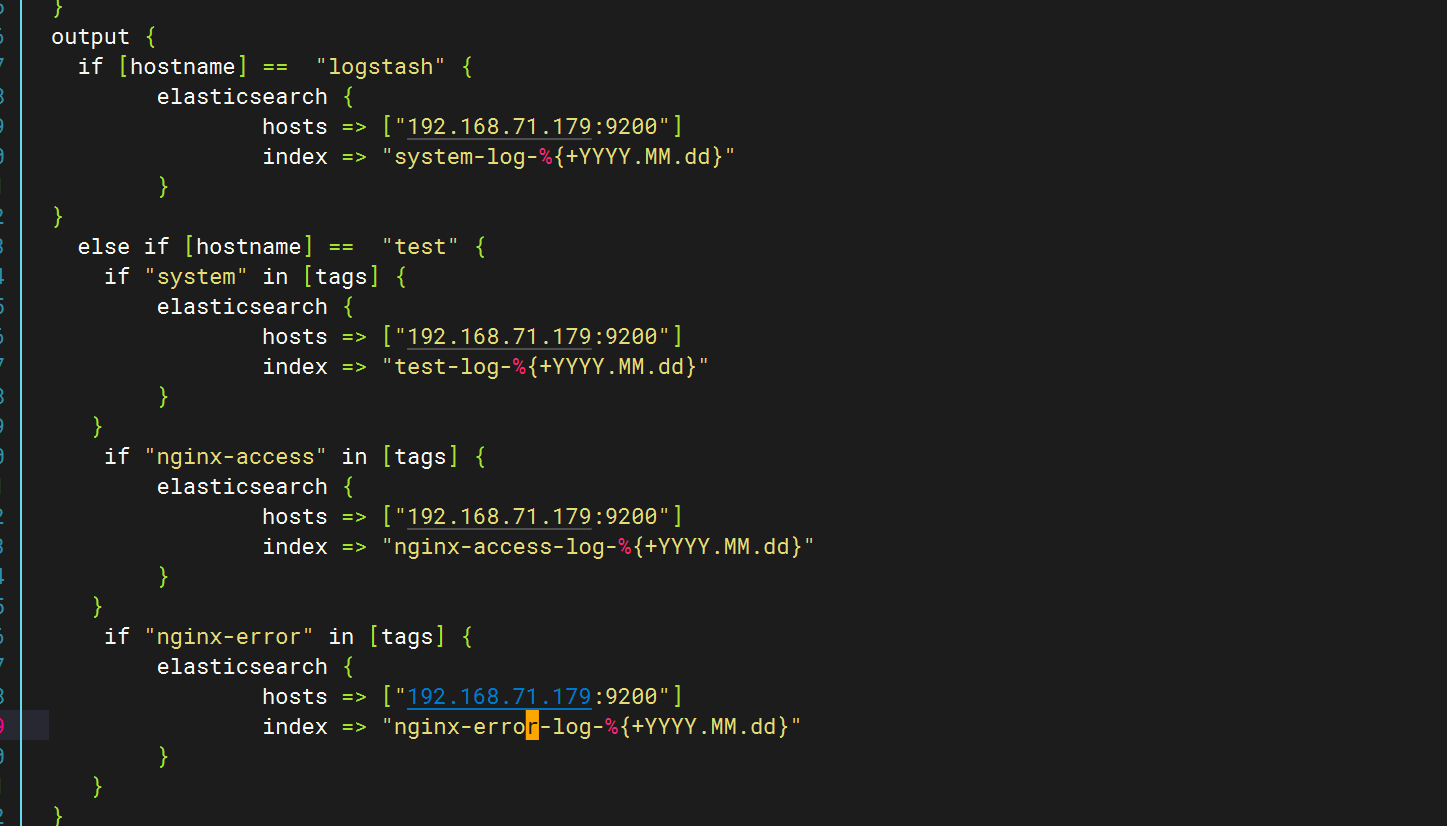
十二.汇总
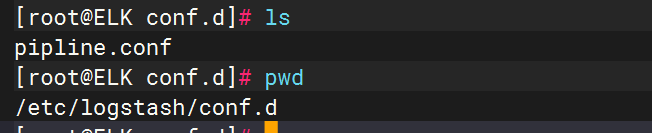
logstash
经过全部配置后,logstash上的pipline.conf全部内容如下
input {file {path => "/var/log/messages"start_position => "beginning"}beats {port => 5044}
}
filter {if [host][name] {mutate { add_field => { "hostname" => "%{[host][name]}" } }}else if [agent][hostname] {mutate { add_field => { "hostname" => "%{[agent][hostname]}" } }}else {mutate { add_field => { "hostname" => "%{host}" } }}
}
output {if [hostname] == "logstash" {elasticsearch {hosts => ["192.168.71.179:9200"]index => "system-log-%{+YYYY.MM.dd}"}
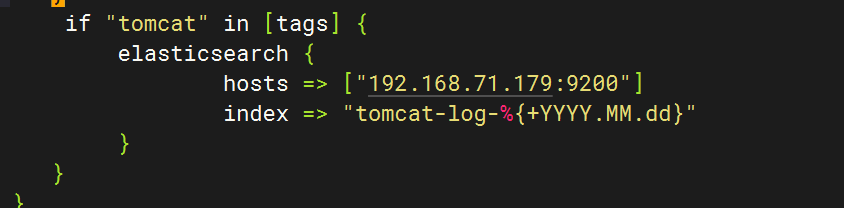
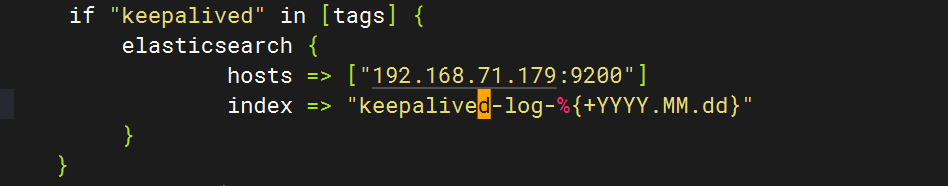
}else if [hostname] == "test" {if "system" in [tags] {elasticsearch {hosts => ["192.168.71.179:9200"]index => "test-log-%{+YYYY.MM.dd}"}}if "nginx-access" in [tags] {elasticsearch {hosts => ["192.168.71.179:9200"]index => "nginx-access-log-%{+YYYY.MM.dd}"}}if "nginx-error" in [tags] {elasticsearch {hosts => ["192.168.71.179:9200"]index => "nginx-error-log-%{+YYYY.MM.dd}"}}if "dhcp" in [tags] {elasticsearch {hosts => ["192.168.71.179:9200"]index => "dhcp-log-%{+YYYY.MM.dd}"}}if "dns" in [tags] {elasticsearch {hosts => ["192.168.71.179:9200"]index => "dns-log-%{+YYYY.MM.dd}"}}if "ssh" in [tags] {elasticsearch {hosts => ["192.168.71.179:9200"]index => "ssh-log-%{+YYYY.MM.dd}"}}if "rsyncd" in [tags] {elasticsearch {hosts => ["192.168.71.179:9200"]index => "rsyncd-log-%{+YYYY.MM.dd}"}}if "tomcat" in [tags] {elasticsearch {hosts => ["192.168.71.179:9200"]index => "tomcat-log-%{+YYYY.MM.dd}"}}
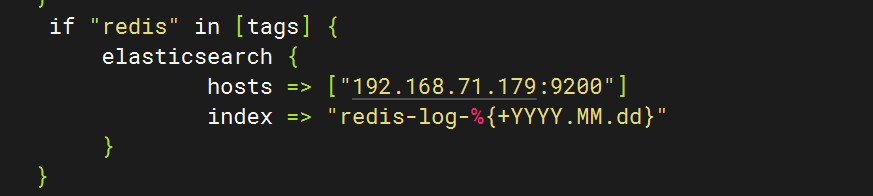
}if "mysql" in [tags] {elasticsearch {hosts => ["192.168.71.179:9200"]index => "mysql-log-%{+YYYY.MM.dd}"}}if "mysql-slow" in [tags] {elasticsearch {hosts => ["192.168.71.179:9200"]index => "mysql-slow-log-%{+YYYY.MM.dd}"}}if "nfs" in [tags] {elasticsearch {hosts => ["192.168.71.179:9200"]index => "nfs-log-%{+YYYY.MM.dd}"}}if "redis" in [tags] {elasticsearch {hosts => ["192.168.71.179:9200"]index => "redis-log-%{+YYYY.MM.dd}"}}if "lvs" in [tags] {elasticsearch {hosts => ["192.168.71.179:9200"]index => "lvs-log-%{+YYYY.MM.dd}"}}if "haproxy" in [tags] {elasticsearch {hosts => ["192.168.71.179:9200"]index => "haproxy-log-%{+YYYY.MM.dd}"}}if "keepalived" in [tags] {elasticsearch {hosts => ["192.168.71.179:9200"]index => "keepalived-log-%{+YYYY.MM.dd}"}}stdout {codec => rubydebug}
}filebeat
filebeat上的filebeat.yml内容如下
###################### Filebeat Configuration Example ########################## This file is an example configuration file highlighting only the most common
# options. The filebeat.reference.yml file from the same directory contains all the
# supported options with more comments. You can use it as a reference.
#
# You can find the full configuration reference here:
# https://www.elastic.co/guide/en/beats/filebeat/index.html# For more available modules and options, please see the filebeat.reference.yml sample
# configuration file.#=========================== Filebeat inputs =============================filebeat.inputs:# Each - is an input. Most options can be set at the input level, so
# you can use different inputs for various configurations.
# Below are the input specific configurations.
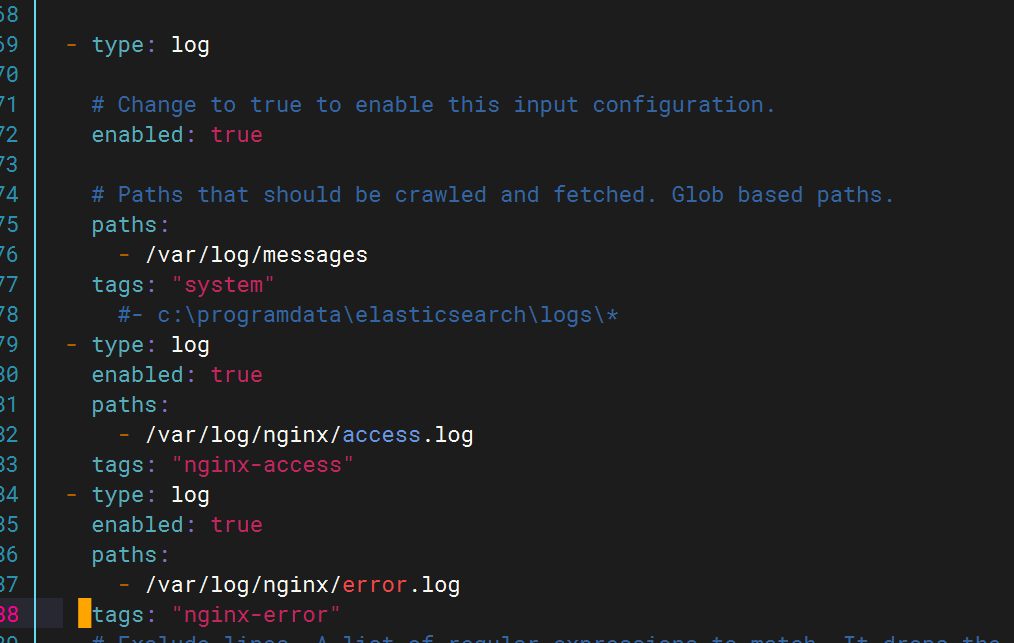
- type: log# Change to true to enable this input configuration.enabled: true# Paths that should be crawled and fetched. Glob based paths.paths:- /var/log/messages#tags: "system" #- c:\programdata\elasticsearch\logs\*
- type: logenabled: truepaths:- /var/log/nginx/access.logtags: "nginx-access"
- type: logenabled: truepaths:- /var/log/nginx/error.logtags: "nginx-error"
- type: logenabled: truepaths:- /var/log/dhcpd.logtags: "dhcp"
- type: logenabled: truepaths:- /var/log/named/dns.logtags: "dns"
- type: logenabled: truepaths:- /var/log/securetags: "ssh"
- type: logenabled: truepaths:- /var/log/rsyncd.logtags: "rsyncd"
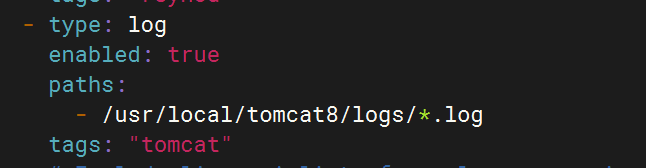
- type: logenabled: truepaths:- /usr/local/tomcat8/logs/*.logtags: "tomcat"
- type: logenabled: truepaths:- /var/log/mysql/general.logtags: "mysql"
- type: logenabled: truepaths:- /var/log/mysql/slow.logtags: "mysql-slow"
- type: logenabled: truepaths:- /var/log/nfs.logtags: "nfs"
- type: logenabled: truepaths:- /var/log/redis/redis.logtags: "redis"
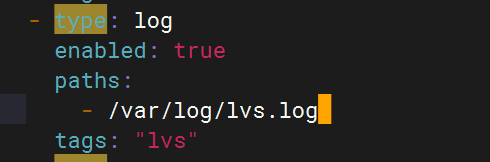
- type: logenabled: truepaths:- /var/log/lvs.logtags: "lvs"
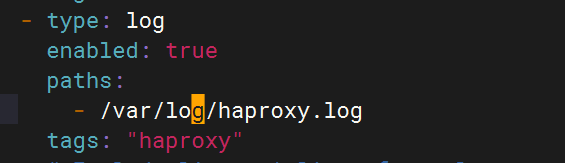
- type: logenabled: truepaths:- /var/log/haproxy.logtags: "haproxy"
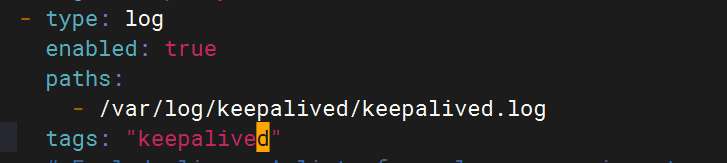
- type: logenabled: truepaths:- /var/log/keepalived/keepalived.logtags: "keepalived" # Exclude lines. A list of regular expressions to match. It drops the lines that are# matching any regular expression from the list.#exclude_lines: ['^DBG']# Include lines. A list of regular expressions to match. It exports the lines that are# matching any regular expression from the list.#include_lines: ['^ERR', '^WARN']# Exclude files. A list of regular expressions to match. Filebeat drops the files that# are matching any regular expression from the list. By default, no files are dropped.#exclude_files: ['.gz$']# Optional additional fields. These fields can be freely picked# to add additional information to the crawled log files for filtering#fields:# level: debug# review: 1### Multiline options# Multiline can be used for log messages spanning multiple lines. This is common# for Java Stack Traces or C-Line Continuation# The regexp Pattern that has to be matched. The example pattern matches all lines starting with [#multiline.pattern: ^\[# Defines if the pattern set under pattern should be negated or not. Default is false.#multiline.negate: false# Match can be set to "after" or "before". It is used to define if lines should be append to a pattern# that was (not) matched before or after or as long as a pattern is not matched based on negate.# Note: After is the equivalent to previous and before is the equivalent to to next in Logstash#multiline.match: after#============================= Filebeat modules ===============================filebeat.config.modules:# Glob pattern for configuration loadingpath: ${path.config}/modules.d/*.yml# Set to true to enable config reloadingreload.enabled: false# Period on which files under path should be checked for changes#reload.period: 10s#==================== Elasticsearch template setting ==========================setup.template.settings:index.number_of_shards: 1#index.codec: best_compression#_source.enabled: false#================================ General =====================================# The name of the shipper that publishes the network data. It can be used to group
# all the transactions sent by a single shipper in the web interface.
#name:# The tags of the shipper are included in their own field with each
# transaction published.
#tags: ["service-X", "web-tier"]# Optional fields that you can specify to add additional information to the
# output.
#fields:
# env: staging#============================== Dashboards =====================================
# These settings control loading the sample dashboards to the Kibana index. Loading
# the dashboards is disabled by default and can be enabled either by setting the
# options here or by using the `setup` command.
#setup.dashboards.enabled: false# The URL from where to download the dashboards archive. By default this URL
# has a value which is computed based on the Beat name and version. For released
# versions, this URL points to the dashboard archive on the artifacts.elastic.co
# website.
#setup.dashboards.url:#============================== Kibana =====================================# Starting with Beats version 6.0.0, the dashboards are loaded via the Kibana API.
# This requires a Kibana endpoint configuration.
setup.kibana:# Kibana Host# Scheme and port can be left out and will be set to the default (http and 5601)# In case you specify and additional path, the scheme is required: http://localhost:5601/path# IPv6 addresses should always be defined as: https://[2001:db8::1]:5601#host: "localhost:5601"# Kibana Space ID# ID of the Kibana Space into which the dashboards should be loaded. By default,# the Default Space will be used.#space.id:#============================= Elastic Cloud ==================================# These settings simplify using filebeat with the Elastic Cloud (https://cloud.elastic.co/).# The cloud.id setting overwrites the `output.elasticsearch.hosts` and
# `setup.kibana.host` options.
# You can find the `cloud.id` in the Elastic Cloud web UI.
#cloud.id:# The cloud.auth setting overwrites the `output.elasticsearch.username` and
# `output.elasticsearch.password` settings. The format is `<user>:<pass>`.
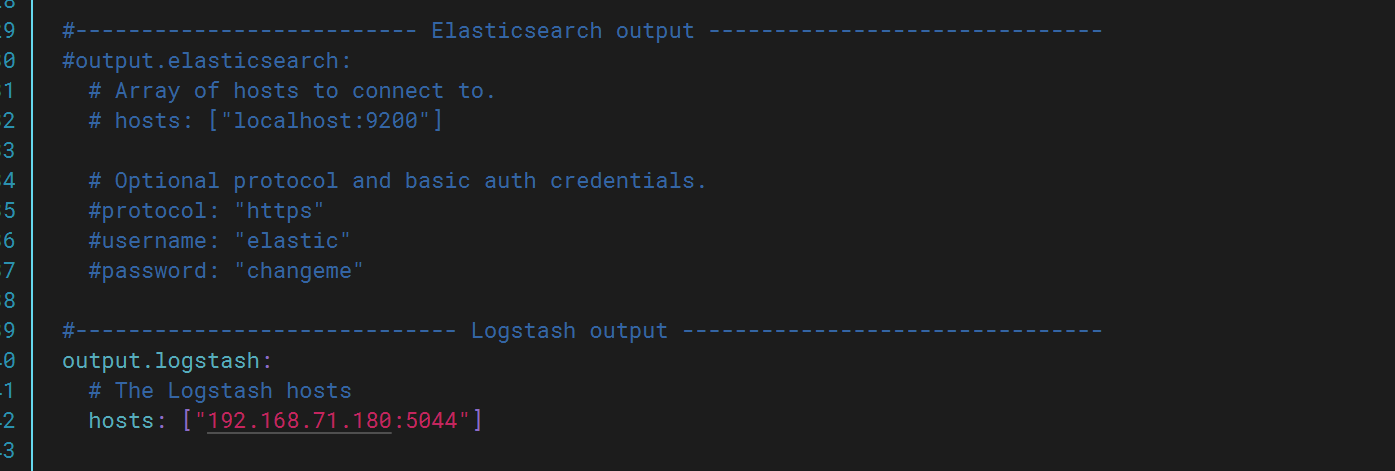
#cloud.auth:#================================ Outputs =====================================# Configure what output to use when sending the data collected by the beat.#-------------------------- Elasticsearch output ------------------------------
#output.elasticsearch:
# # Array of hosts to connect to.
# # hosts: ["localhost:9200"]
# hosts: ["192.168.71.179:9200"]
# indices:
# - index: "LVS-logs"
# when:
# contains:
# { "message": "ipvs"}
#setup.ilm.enabled: false
#setup.template.name: "LVS"
#setup.template.pattern: "LVS-*"# Optional protocol and basic auth credentials.#protocol: "https"#username: "elastic"#password: "changeme"#----------------------------- Logstash output --------------------------------
output.logstash:# The Logstash hostshosts: ["192.168.71.180:5044"]# Optional SSL. By default is off.# List of root certificates for HTTPS server verifications#ssl.certificate_authorities: ["/etc/pki/root/ca.pem"]# Certificate for SSL client authentication#ssl.certificate: "/etc/pki/client/cert.pem"# Client Certificate Key#ssl.key: "/etc/pki/client/cert.key"#================================ Processors =====================================# Configure processors to enhance or manipulate events generated by the beat.processors:- add_host_metadata: ~- add_cloud_metadata: ~#================================ Logging =====================================# Sets log level. The default log level is info.
# Available log levels are: error, warning, info, debug
#logging.level: debug# At debug level, you can selectively enable logging only for some components.
# To enable all selectors use ["*"]. Examples of other selectors are "beat",
# "publish", "service".
#logging.selectors: ["*"]#============================== Xpack Monitoring ===============================
# filebeat can export internal metrics to a central Elasticsearch monitoring
# cluster. This requires xpack monitoring to be enabled in Elasticsearch. The
# reporting is disabled by default.# Set to true to enable the monitoring reporter.
#xpack.monitoring.enabled: false# Uncomment to send the metrics to Elasticsearch. Most settings from the
# Elasticsearch output are accepted here as well. Any setting that is not set is
# automatically inherited from the Elasticsearch output configuration, so if you
# have the Elasticsearch output configured, you can simply uncomment the
# following line.
#xpack.monitoring.elasticsearch:#================================= Migration ==================================# This allows to enable 6.7 migration aliases
#migration.6_to_7.enabled: truekibana
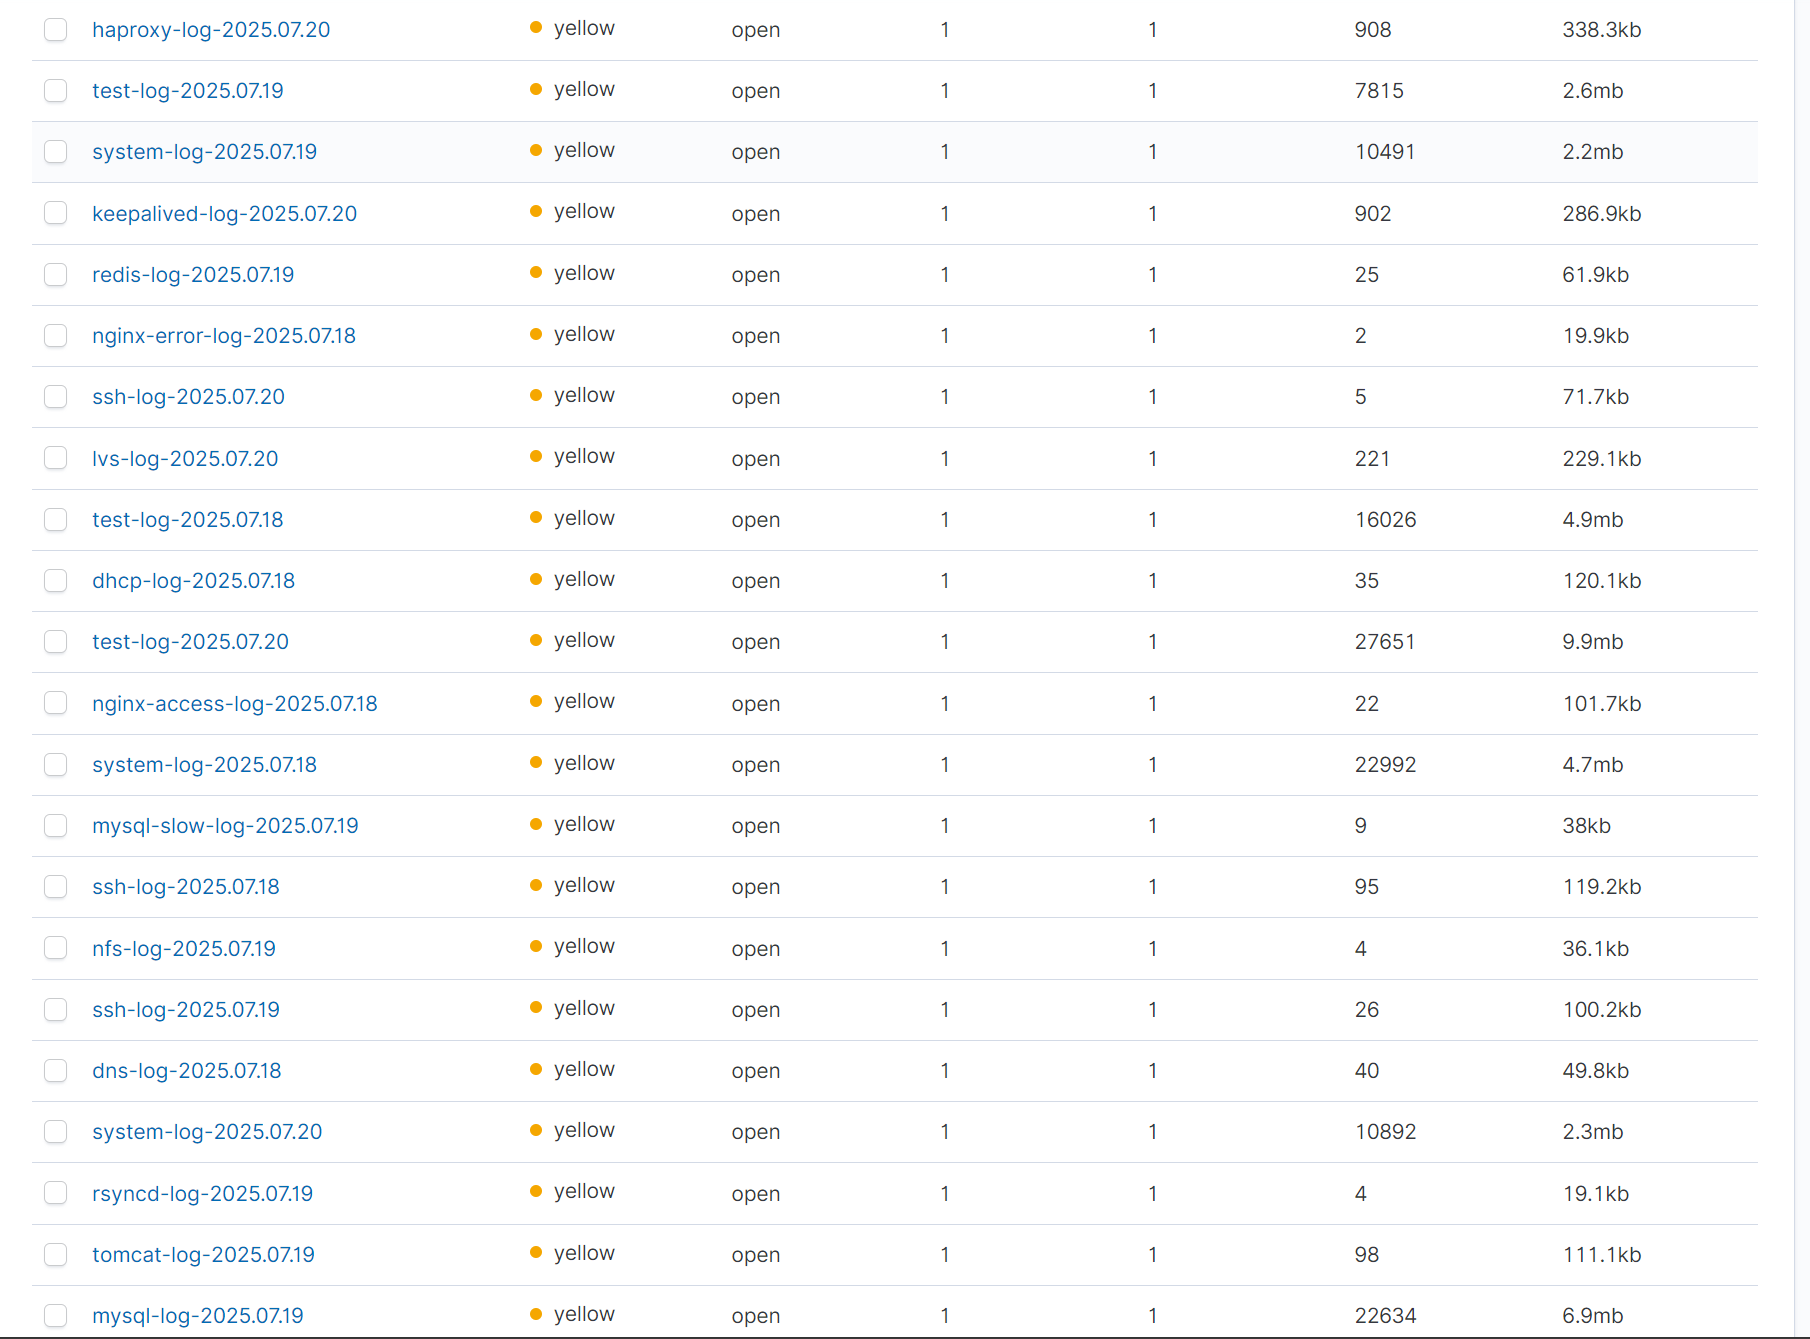
kibana总览


![[2025CVPR-目标检测方向]FSHNet:一种用于3D物体检测的全稀疏混合网络。](http://pic.xiahunao.cn/[2025CVPR-目标检测方向]FSHNet:一种用于3D物体检测的全稀疏混合网络。)


 视频教程 - 主页-微博点赞量Top6实现)

机器学习小白入门YOLOv:YOLOv8-cls 模型微调实操)


)
——链接预测在社交网络分析中的应用)