[root@node-exporter41 /usr/local/alertmanager-0.28.1.linux-amd64]# pwd
/usr/local/alertmanager-0.28.1.linux-amd64[root@node-exporter41 /usr/local/alertmanager-0.28.1.linux-amd64]# cat alertmanager.yml
# 通用配置
global:resolve_timeout: 5msmtp_from: '914XXXXXX@qq.com'smtp_smarthost: 'smtp.qq.com:465'smtp_auth_username: '914XXXXXX@qq.com'smtp_auth_password: 'aalXXXjXXbXa'smtp_require_tls: falsesmtp_hello: 'qq.com'
# 定义路由信息
route:group_by: ['alertname']group_wait: 5sgroup_interval: 5srepeat_interval: 5mreceiver: 'sre_system'# 配置子路由routes:- receiver: 'sre_ops'match_re:job: linux96_ops_exporter# 建议将continue的值设置为true,表示当前的条件是否匹配,都将继续向下匹配规则# 这样做的目的是将消息发给最后的系统组(sre_system)continue: true- receiver: 'sre_k8s'match_re:job: linux96_k8s_exporter continue: true- receiver: 'sre_system'match_re:job: .*continue: true
# 定义接受者
receivers:
- name: 'sre_ops'email_configs:- to: '914XXXXX@qq.com'send_resolved: true- to: '914XXXXX@qq.com'send_resolved: true
- name: 'sre_k8s'email_configs:- to: '568XXXX@qq.com'send_resolved: true- to: '56XXXX@qq.com'send_resolved: true
- name: 'sre_system'email_configs:- to: '914XXXXX@qq.com'send_resolved: true- to: '56XXXXXX@qq.com'send_resolved: true
引言
在深入探索 Prometheus 的过程中,我们往往会对其核心组件有较为深入的了解,但与此同时,一些辅助组件也发挥着不可或缺的作用,它们就像是为整个监控系统增添羽翼的利器,让监控功能得以进一步拓展和完善。今天,我们就来聚焦于 Prometheus 生态系统中的两个重要组件 ——Pushgateway 和 Alertmanager,深入剖析它们的工作原理、应用场景以及与整个 Prometheus 监控体系的协同合作方式,一同揭开它们在监控领域所蕴含的巨大潜力和价值,为你的技术监控之旅增添新的助力和洞察。
一、背景
随着互联网行业的蓬勃发展,各种复杂的应用系统和微服务架构层出不穷,这些系统的正常运转对于企业的业务运营至关重要。为了确保这些系统能够以最佳状态持续运行,及时发现和解决潜在的问题,监控系统成为了不可或缺的基础设施。
Prometheus 作为一款开源的监控告警系统,以其强大的数据模型、灵活的查询语言(PromQL)以及高效的时序数据库等优势,在众多监控解决方案中脱颖而出。它采用拉取(Pull)模式来收集被监控目标的指标数据,这种模式在大多数场景下能够很好地工作,但在某些特殊场景,例如需要监控短生命周期的批处理任务、临时性的任务或者在防火墙受限的环境中等,仅仅依靠 Prometheus 的拉取模式就显得有些力不从心了,这就促使了 Pushgateway 这样一个组件的诞生,它允许客户端将指标数据推送到 Prometheus 中,从而弥补了拉取模式在这些特殊场景下的不足。
而另一方面,在监控过程中,当发现指标数据出现异常时,及时准确地发出告警通知对于快速响应和处理问题是至关重要的。虽然 Prometheus 自身具备一定的告警规则配置功能,但当涉及到复杂的告警通知策略、告警分组、抑制以及与多种通知渠道的集成等场景时,单独使用 Prometheus 的告警功能就会显得较为复杂和局限,此时 Alertmanager 便应运而生。它作为 Prometheus 的告警管理组件,专门负责处理来自 Prometheus Server 的告警信息,对告警进行分组、去重、抑制等处理,并能够根据预设的规则将告警通过多种方式(如邮件、Slack、PagerDuty 等)发送给相应的接收者,从而构建起一个完善且高效的告警通知体系。
通过对 Pushgateway 和 Alertmanager 这两个组件的深入学习和应用,我们能够使 Prometheus 监控系统在更多复杂多变的场景下发挥出更大的威力,为系统的稳定运行提供更加坚实可靠的保障。在接下来的博客内容中,我们将分别对这两个组件进行详细讲解,包括它们的安装部署、配置使用、实际案例分析等多个方面,希望能帮助你更好地掌握和运用这些强大的监控工具。
二、 Pushgateway组件部署
1. 下载软件包
部署pushgateway
[root@node-exporter41 ~]# wget https://github.com/prometheus/pushgateway/releases/download/v1.11.0/pushgateway-1.11.0.linux-amd64.tar.gz解压软件包
[root@node-exporter41 ~]# tar xf pushgateway-1.11.0.linux-amd64.tar.gz -C /usr/local/bin/ pushgateway-1.11.0.linux-amd64/pushgateway --strip-components=1
[root@node-exporter41 ~]#
[root@node-exporter41 ~]# ll /usr/local/bin/pushgateway
-rwxr-xr-x 1 1001 1002 20656129 Jan  9 22:36 /usr/local/bin/pushgateway*
[root@node-exporter41 ~]#
2. 运行pushgateway
[root@node-exporter41 ~]# pushgateway --web.telemetry-path="/metrics" --web.listen-address=:9091 --persistence.file=/data/pushgateway.data访问pushgateway的WebUI
http://10.0.0.41:9091/#
3. 使用pushgateway监控TCP的12种状态
[root@elk93 ~]# cat /usr/local/bin/tcp_status2.sh
#!/bin/bashpushgateway_url="http://10.0.0.41:9091/metrics/job/tcp_status"
time=$(date +%Y-%m-%d+%H:%M:%S)state="SYN-SENT SYN-RECV FIN-WAIT-1 FIN-WAIT-2 TIME-WAIT CLOSE CLOSE-WAIT LAST-ACK LISTEN CLOSING ESTAB"
for i in  $statedot=`ss -tan |grep $i |wc -l`echo tcp_connections{state=\""$i"\"} $t >>/tmp/tcp.txt
done;cat /tmp/tcp.txt | curl --data-binary @- $pushgateway_url
rm -rf  /tmp/tcp.txt
[root@elk93 ~]# 2.调用脚本
[root@elk93 ~]# bash /usr/local/bin/tcp_status2.sh
三、Alertmanager单机环境部署
1. 下载软件包
2.下载Alertmanager
wget https://github.com/prometheus/alertmanager/releases/download/v0.28.1/alertmanager-0.28.1.linux-amd64.tar.gz3.解压安装包
[root@node-exporter43 ~]# tar xf alertmanager-0.28.1.linux-amd64.tar.gz  -C /usr/local/
[root@node-exporter43 ~]#
2. 修改Alertmanager的配置文件
[root@node-exporter41 /usr/local/alertmanager-0.28.1.linux-amd64]# pwd
/usr/local/alertmanager-0.28.1.linux-amd64[root@node-exporter41 /usr/local/alertmanager-0.28.1.linux-amd64]# cat alertmanager.yml
# 通用配置
global:resolve_timeout: 5msmtp_from: '914@qq.com'smtp_smarthost: 'smtp.qq.com:465'smtp_auth_username: '914@qq.com'smtp_auth_password: 'ahjplbbja'smtp_require_tls: falsesmtp_hello: 'qq.com'
# 定义路由信息
route:group_by: ['alertname']group_wait: 5sgroup_interval: 5srepeat_interval: 5mreceiver: 'sre_system'# 配置子路由routes:- receiver: 'sre_ops'match_re:job: linux96_ops_exporter# 建议将continue的值设置为true,表示当前的条件是否匹配,都将继续向下匹配规则# 这样做的目的是将消息发给最后的系统组(sre_system)continue: true- receiver: 'sre_k8s'match_re:job: linux96_k8s_exporter continue: true- receiver: 'sre_system'match_re:job: .*continue: true
# 定义接受者
receivers:
- name: 'sre_ops'email_configs:- to: '914@qq.com'send_resolved: true- to: '914@qq.com'send_resolved: true
- name: 'sre_k8s'email_configs:- to: '5@qq.com'send_resolved: true- to: '5689@qq.com'send_resolved: true
- name: 'sre_system'email_configs:- to: '914@qq.com'send_resolved: true- to: '56@qq.com'send_resolved: true
3. 检查配置是否正确
[root@node-exporter41 /usr/local/alertmanager-0.28.1.linux-amd64]# ./amtool check-config alertmanager.yml
Checking 'alertmanager.yml'  SUCCESS
Found:- global config- route- 0 inhibit rules- 3 receivers- 0 templates
4. 启动Alertmanager服务并测试
[root@node-exporter43 alertmanager-0.28.1.linux-amd64]# ./alertmanager # 访问webUI测试
http://10.0.0.41:9093/#/status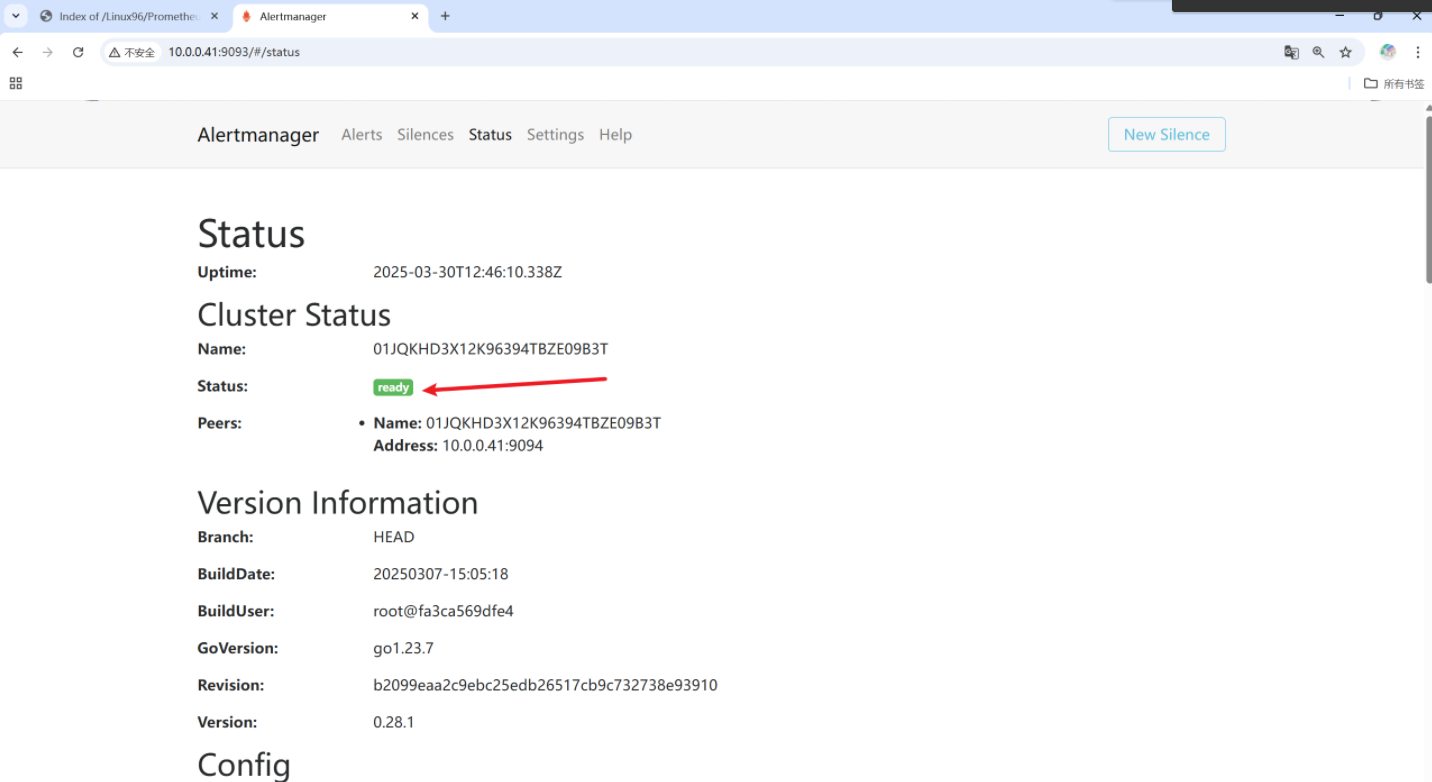
四、Prometheus server集成Alertmanager实现告警功能
1. 修改Prometheus配置文件,打开告警功能
[root@prometheus-server31 /softwares/prometheus-2.53.4.linux-amd64]# cat prometheus.yml
# my global config
global:scrape_interval: 3s # Set the scrape interval to every 15 seconds. Default is every 1 minute.evaluation_interval: 15s # Evaluate rules every 15 seconds. The default is every 1 minute.# scrape_timeout is set to the global default (10s).# Alertmanager configuration   ------------------->打开此alter的配置信息~~
alerting:alertmanagers:- static_configs:- targets:- 10.0.0.41:9093# Load rules once and periodically evaluate them according to the global 'evaluation_interval'.
rule_files:                   ------------------> 此配置是告警规则可以自定义# - "first_rules.yml"# - "second_rules.yml"- "linux96-rules.yml"# A scrape configuration containing exactly one endpoint to scrape:
# Here it's Prometheus itself.
scrape_configs:# The job name is added as a label `job=<job_name>` to any timeseries scraped from this config.- job_name: "prometheus"# metrics_path defaults to '/metrics'# scheme defaults to 'http'.static_configs:- targets: ["localhost:9090"]# 这里就是静态配置- job_name: "linux96_ops_exporter"static_configs:- targets:- 10.0.0.41:9100- job_name: "linux96_k8s_exporter"static_configs:- targets:- 10.0.0.42:9100- job_name: "whatever_job_exporter"static_configs:- targets:- 10.0.0.43:9100
2. 编写告警配置
[root@prometheus-server31 /softwares/prometheus-2.53.4.linux-amd64]# cat linux96-rules.yml
groups:
- name: linux96-rules-alertrules:- alert: linux96-rules-ops-alertexpr: up{job="linux96_ops_exporter"} == 0for: 3slabels:address: Shanghai class: linux96apps: opsannotations:summary: "{{ $labels.instance }} 服务器已经停止运行超过 3s!!!!!"- alert: linux96-rules-k8s-alterexpr: up{job="linux96_k8s_exporter"} == 0for: 3slabels:school: Beijingclass: linux96apps: k8sannotations:summary: "{{ $labels.instance }} K8S服务器已停止运行超过 3s!"- alert: othersServer-rules-system-alterexpr: up{job="whatever_job_exporter"} == 0for: 5slabels:school: Shenzhenclass: linux96apps: bigdataannotations:summary: "{{ $labels.instance }} 大数据服务器已停止运行超过 5s!"
3. 检查配置文件语法并重新加载配置
[root@prometheus-server31 /softwares/prometheus-2.53.4.linux-amd64]# ./promtool check config prometheus.yml
Checking prometheus.ymlSUCCESS: 1 rule files foundSUCCESS: prometheus.yml is valid prometheus config file syntaxChecking linux96-rules.ymlSUCCESS: 3 rules found[root@prometheus-server31 /softwares/prometheus-2.53.4.linux-amd64]# ### 重新加载prometheus的配置
curl -X POST http://10.0.0.31:9090/-/reload
4. 触发告警功能
[root@node-exporter41 ~]# systemctl stop node-exporter.service
[root@node-exporter41 ~]# ss -ntl | grep 9100
[root@node-exporter41 ~]# [root@node-exporter42 ~]# systemctl stop  node-exporter.service
[root@node-exporter42 ~]#
[root@node-exporter42 ~]# ss -ntl | grep 9100
[root@node-exporter42 ~]# [root@node-exporter43 ~]# systemctl stop node-exporter.service
[root@node-exporter43 ~]#
[root@node-exporter43 ~]# ss -ntl | grep 9100
5. 查看alermanager的WebUI及邮箱接受者
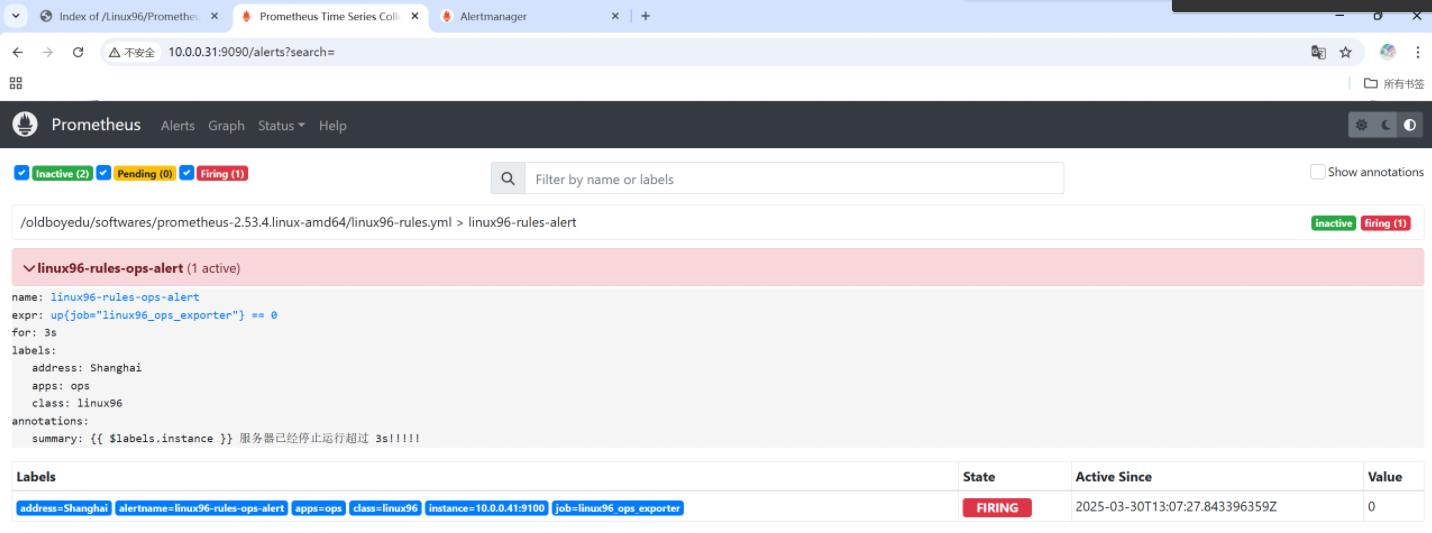
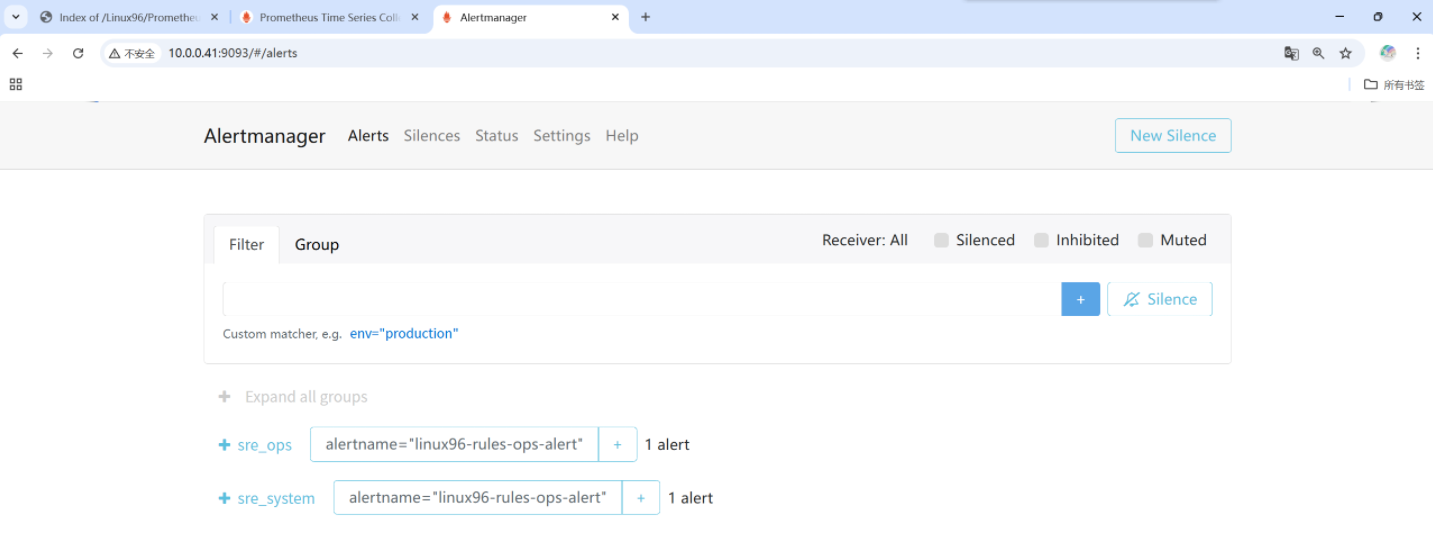

由此webUI可以发现我们的ops模块异常了
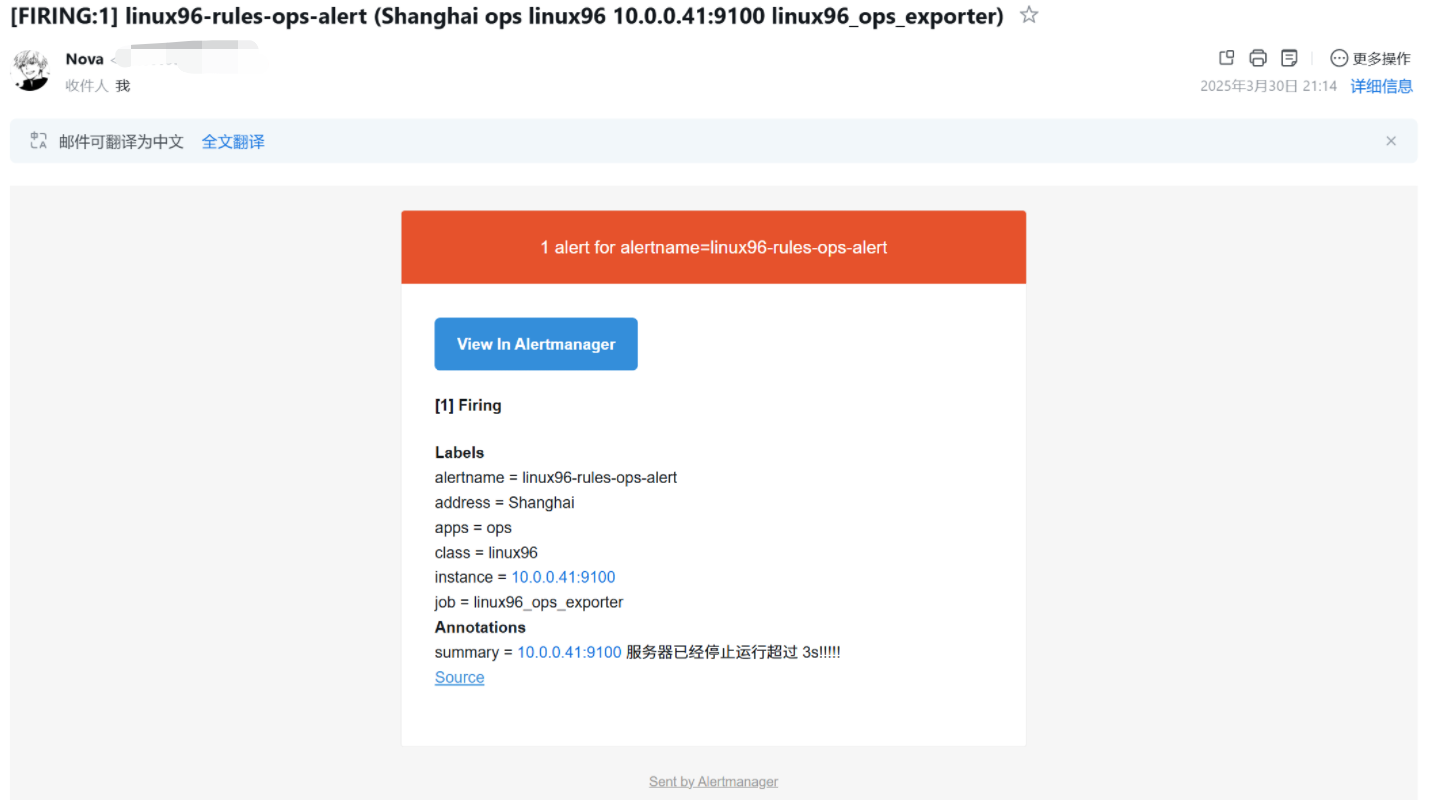
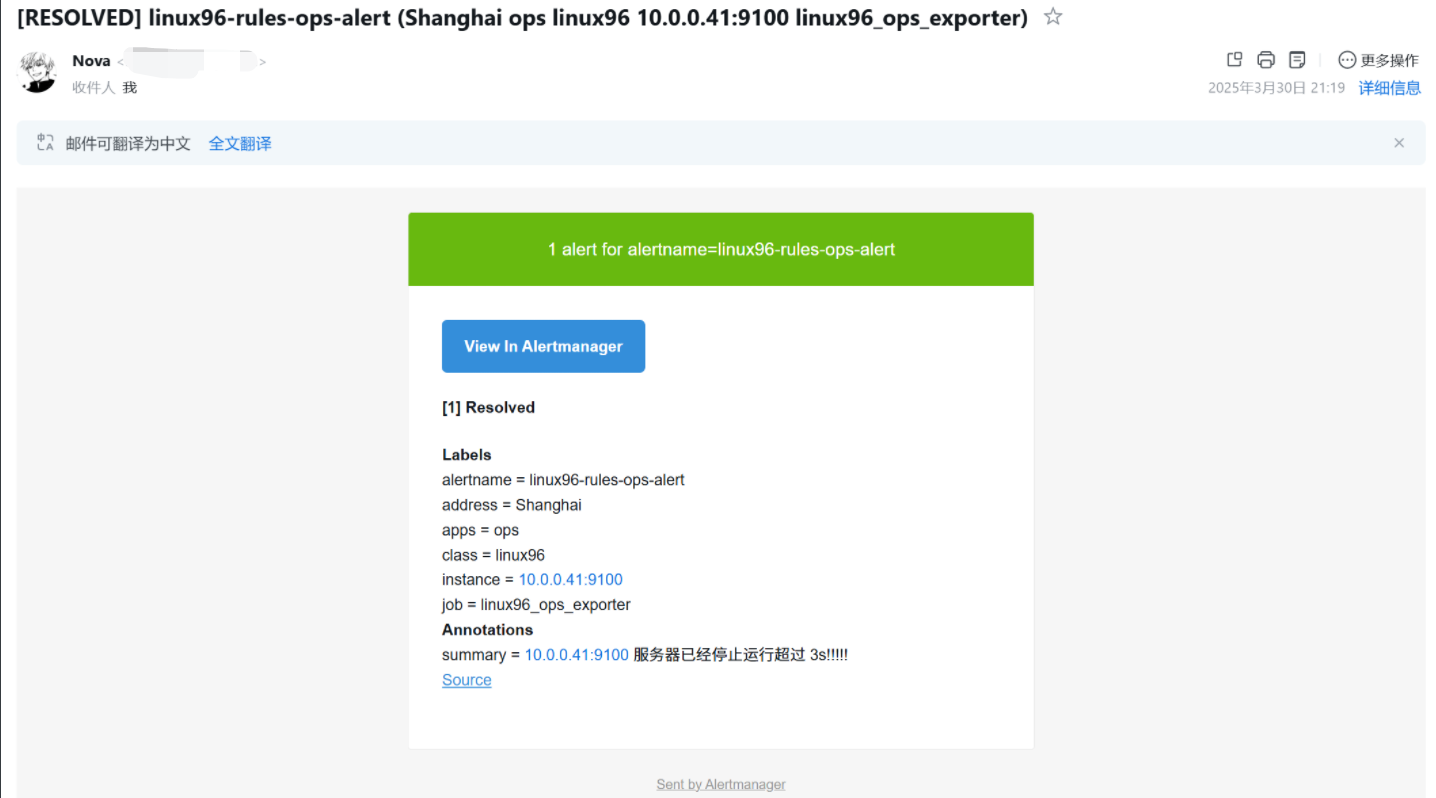
此时邮箱就会出现告警
 这时候我们去修复一下服务
[root@node-exporter41 /usr/local/alertmanager-0.28.1.linux-amd64]# systemctl start node-exporter.service
[root@node-exporter41 /usr/local/alertmanager-0.28.1.linux-amd64]# ss -ntl |grep 9100
LISTEN 0 4096 *:9100 *:* 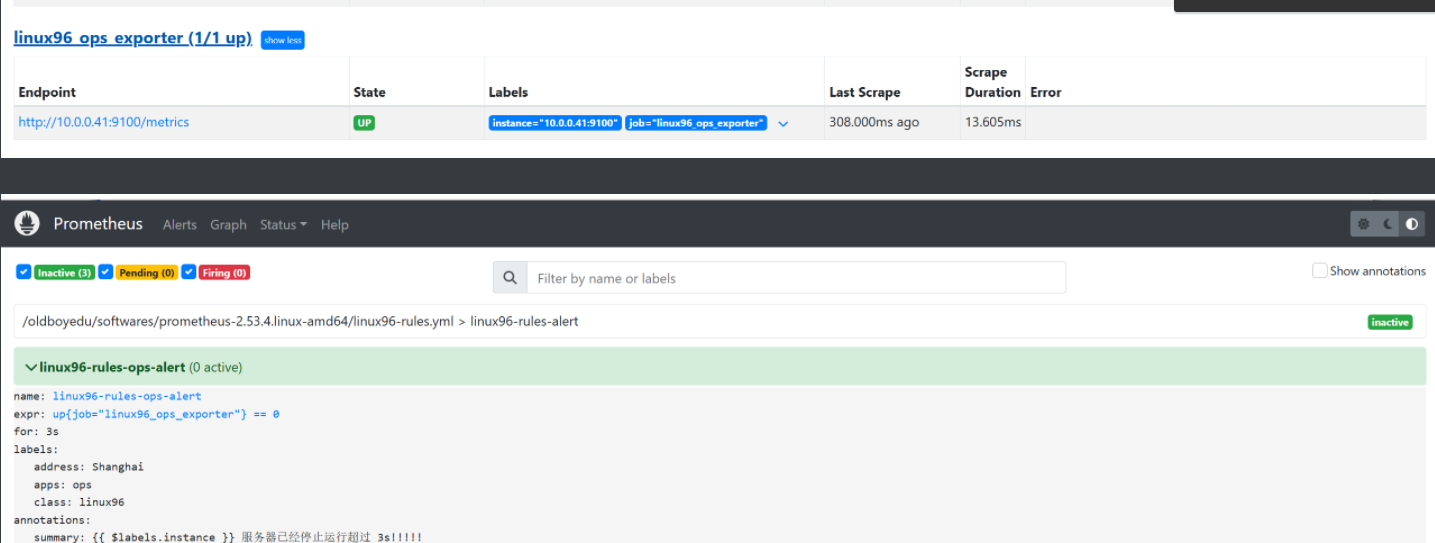
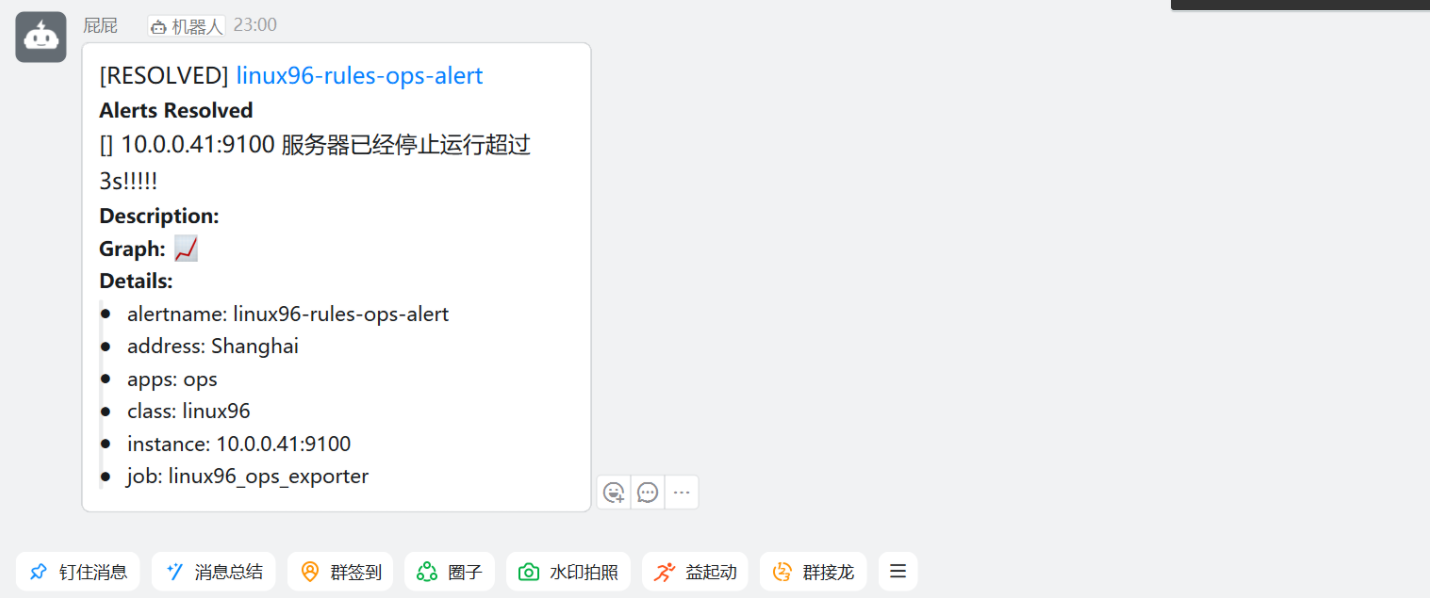
此时邮箱依旧会发送邮件告诉我们故障已解决
五、Alertmanager集成钉钉插件实现告警
参考链接:
https://github.com/timonwong/prometheus-webhook-dingtalk/
1.部署钉钉插件
	1.1 下载钉钉插件
wget https://github.com/timonwong/prometheus-webhook-dingtalk/releases/download/v2.1.0/prometheus-webhook-dingtalk-2.1.0.linux-amd64.tar.gz1.2 解压文件
[root@node-exporter43 ~]# tar xf prometheus-webhook-dingtalk-2.1.0.linux-amd64.tar.gz  -C /usr/local/
[root@node-exporter43 ~]#
[root@node-exporter43 ~]# cd /usr/local/prometheus-webhook-dingtalk-2.1.0.linux-amd64/
[root@node-exporter43 prometheus-webhook-dingtalk-2.1.0.linux-amd64]#
[root@node-exporter43 prometheus-webhook-dingtalk-2.1.0.linux-amd64]# ll
total 18752
drwxr-xr-x  3 3434 3434     4096 Apr 21  2022 ./
drwxr-xr-x 12 root root     4096 Mar 30 17:47 ../
-rw-r--r--  1 3434 3434     1299 Apr 21  2022 config.example.yml
drwxr-xr-x  4 3434 3434     4096 Apr 21  2022 contrib/
-rw-r--r--  1 3434 3434    11358 Apr 21  2022 LICENSE
-rwxr-xr-x  1 3434 3434 19172733 Apr 21  2022 prometheus-webhook-dingtalk*
[root@node-exporter43 prometheus-webhook-dingtalk-2.1.0.linux-amd64]# [root@node-exporter43 /usr/local/prometheus-webhook-dingtalk-2.1.0.linux-amd64]# cp config{.example,}.yml
[root@node-exporter43 /usr/local/prometheus-webhook-dingtalk-2.1.0.linux-amd64]# ll
total 18756
drwxr-xr-x  3 3434 3434     4096 Mar 30 13:47 ./
drwxr-xr-x 11 root root     4096 Mar 30 13:46 ../
-rw-r--r--  1 3434 3434     1299 Apr 21  2022 config.example.yml
-rw-r--r--  1 root root     1299 Mar 30 13:47 config.yml
drwxr-xr-x  4 3434 3434     4096 Apr 21  2022 contrib/
-rw-r--r--  1 3434 3434    11358 Apr 21  2022 LICENSE
-rwxr-xr-x  1 3434 3434 19172733 Apr 21  2022 prometheus-webhook-dingtalk*
[root@node-exporter43 /usr/local/prometheus-webhook-dingtalk-2.1.0.linux-amd64]#
2. 登录钉钉添加自定义机器人
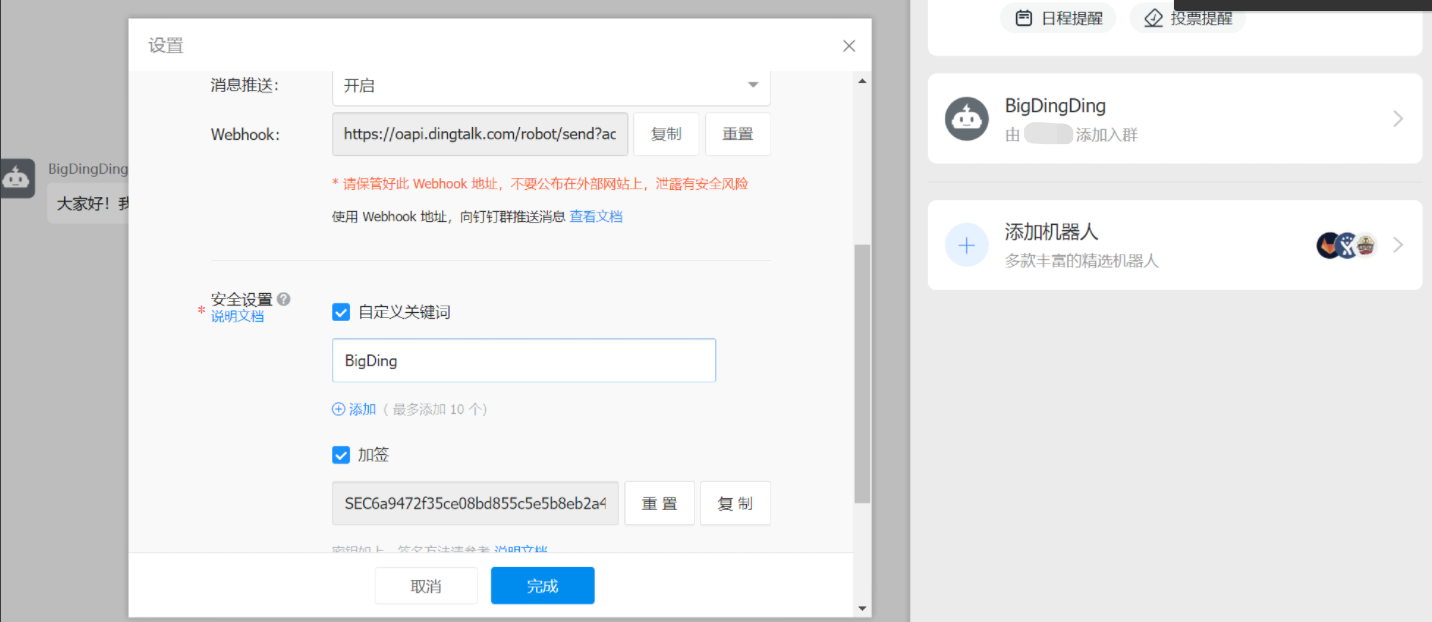
保存好配置文件信息
webhook地址:
https://oapi.dingtalk.com/robot/send?access_token=4b1f23e7286ebce1f626474534050d1cb3868f5055914d77d9217
加签信息:
SEC6a9472f35ce08bd855c5e5b8cf3b39fd57fdb99d650aa35786acd884b9e
3. 配置钉钉的config.yml
[root@node-exporter43 /usr/local/prometheus-webhook-dingtalk-2.1.0.linux-amd64]# vim config.yml
## Request timeout
.....
### 配置钉钉的config.yml
## Targets, previously was known as "profiles"
targets:webhook1:url: https://oapi.dingtalk.com/robot/send?access_token=4b1f23e7286ebce1f624dff7c4eb236474534050d1cb3868f5055914d77d9217# secret for signaturesecret: SEC6a9472f35ce08bd855c5e5b8eb2a4cf3b39fd57fdb99d650aa35786acd884b9e
.....
当前只要一个自定触发的钩子,如果有多个可以继续写
4. 启动钉钉
[root@node-exporter43 /usr/local/prometheus-webhook-dingtalk-2.1.0.linux-amd64]# ./prometheus-webhook-dingtalk --web.listen-address="10.0.0.43:8060"
..........
这里有URL和一些messages
ts=2025-03-30T14:07:59.409Z caller=main.go:97 level=info component=configuration msg="Loading templates" templates=
ts=2025-03-30T14:07:59.410Z caller=main.go:113 component=configuration msg="Webhook urls for prometheus alertmanager" urls=http://10.0.0.43:8060/dingtalk/webhook1/send
ts=2025-03-30T14:07:59.411Z caller=web.go:208 level=info component=web msg="Start listening for connections" address=10.0.0.43:8060
5. Alertmanager集成钉钉插件
[root@node-exporter41 /usr/local/alertmanager-0.28.1.linux-amd64]# vim alertmanager.yml .....### 添加此配置- name: 'sre_system'webhook_configs:# 指向的是DingDing的插件地址- url: 'http://10.0.0.43:8060/dingtalk/webhook1/send'http_config: {}max_alerts: 0send_resolved: true#- name: 'sre_system'#  email_configs:#  - to: '94@qq.com'#    send_resolved: true#    headers: { Subject: "[WARN] LINUX96报警邮件" }
"alertmanager.yml" 76L, 2274B written
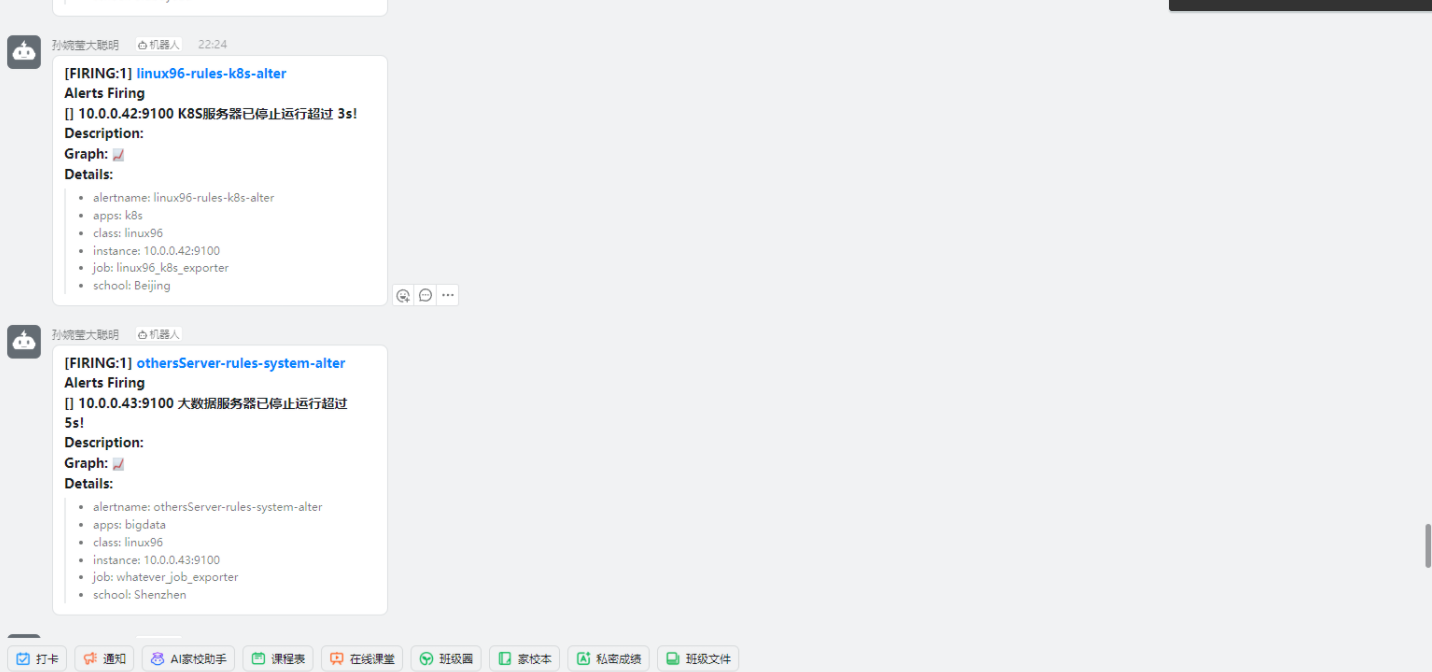
6. 测试
[root@node-exporter43 ~]# systemctl stop node-exporter.service
[root@node-exporter43 ~]#
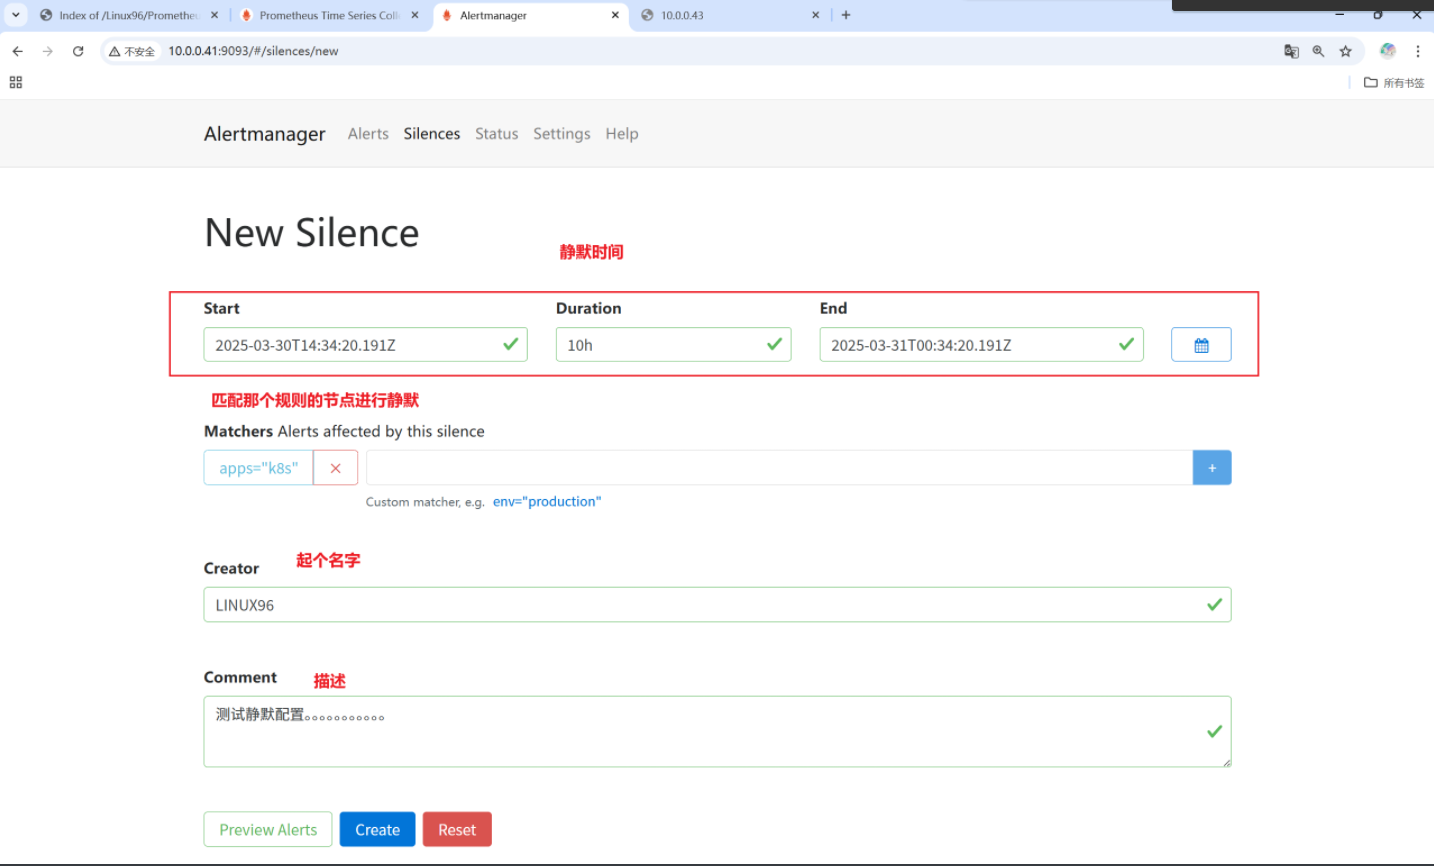
六. Alertmanager的告警静默(Silence)
1.告警静默(Silence)
一般用于系统维护,预期要做的操作,这意味着就没有必要告警。比如系统升级,需要8h,在这8h过程中,就可以考虑先不用告警。

这时候就可以说明当前标签为K8S规则的节点正在静默,所以他即使有问题也不会报警,相反其他节点就可以正常。
测试
[root@node-exporter42 ~]# systemctl stop node-exporter.service
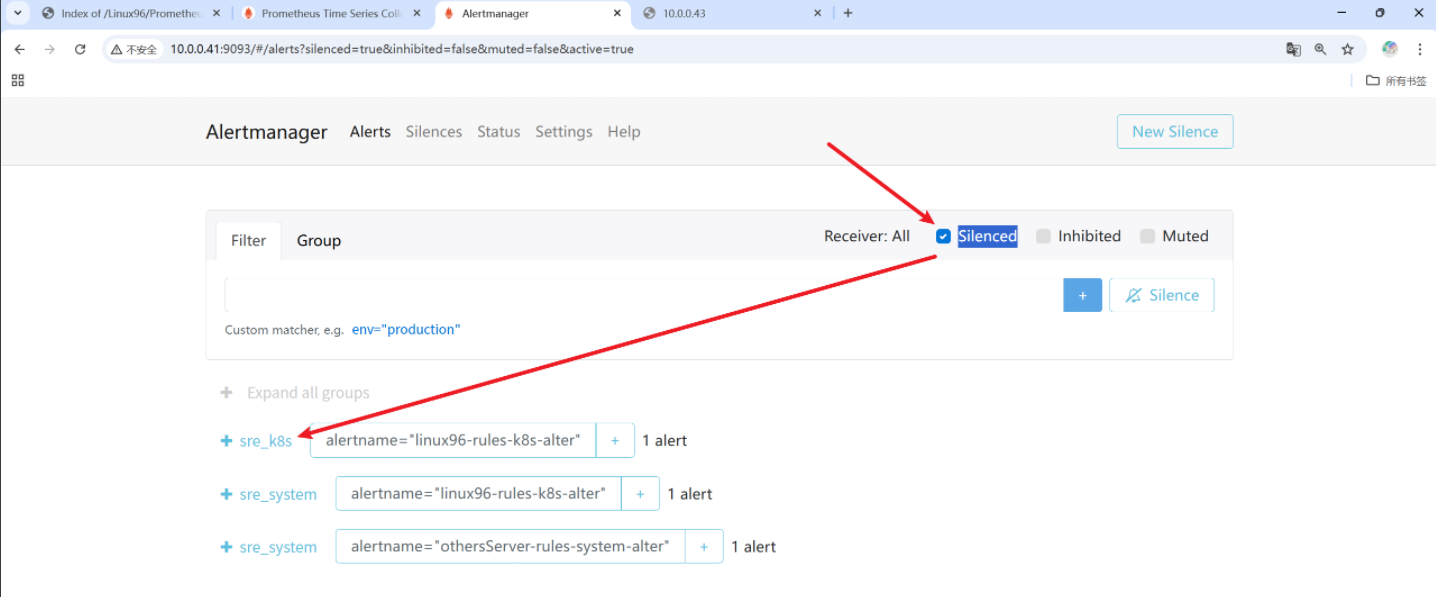
[root@node-exporter43 ~]# systemctl stop node-exporter.service 我们就可以看到42的k8s的警告就被静默了,但是43还是正常报警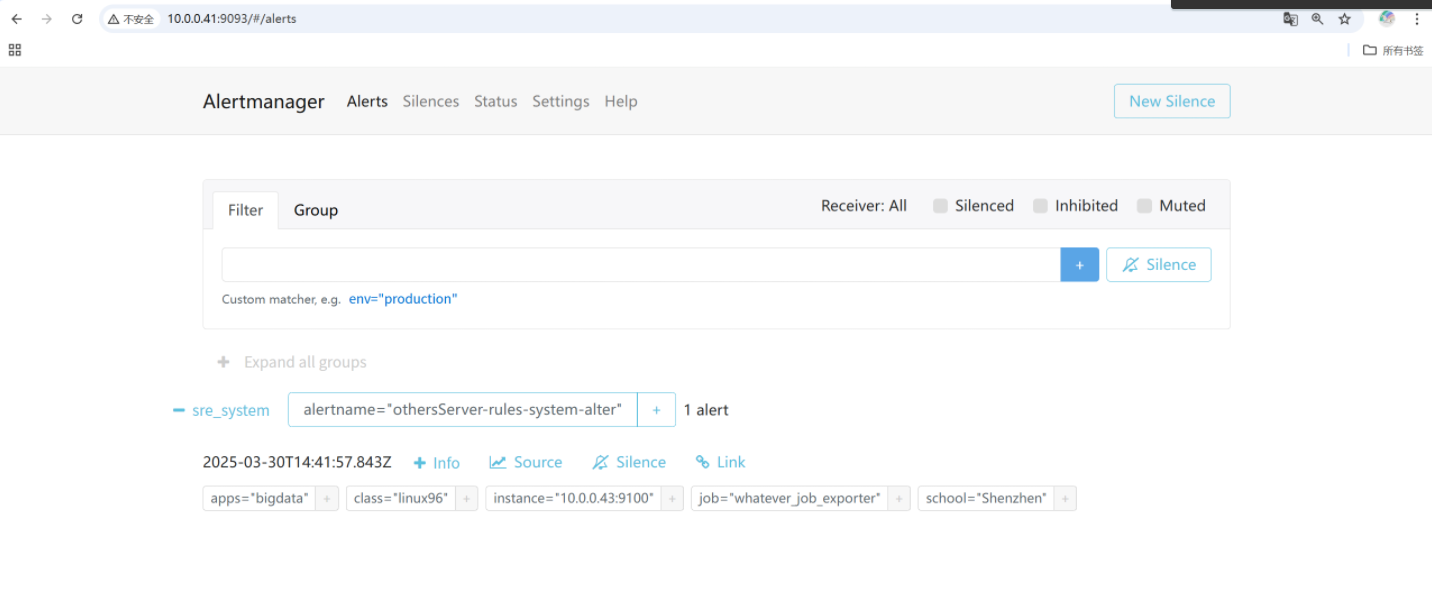 打开静默就发现了K8S
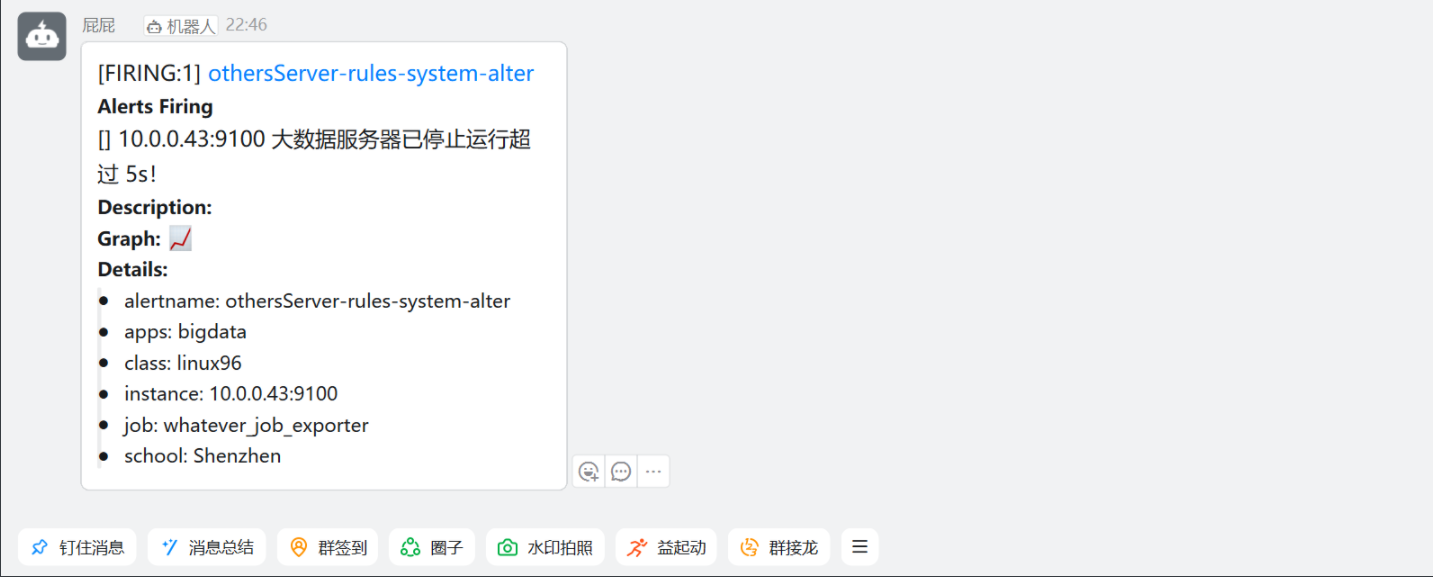
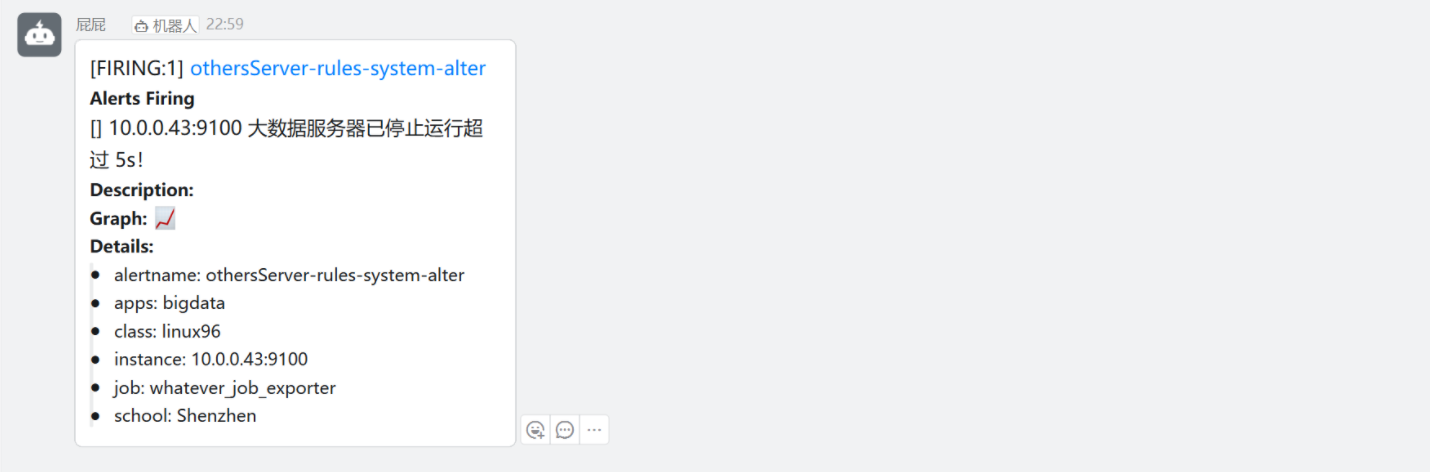
机器人的报警也是一样的
没有k8s标签的警告
恢复节点
[root@node-exporter42 ~]# systemctl start node-exporter.service
[root@node-exporter43 ~]# systemctl start node-exporter.service 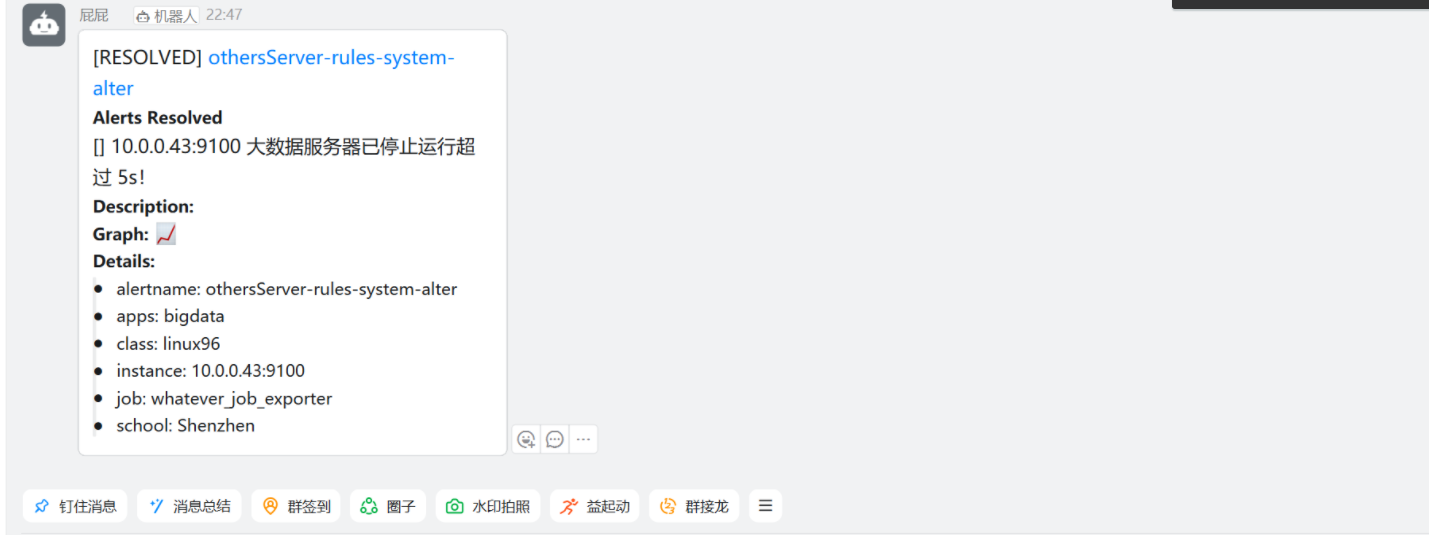
七、Alertmanager的告警抑制(inhibit)
1.什么是告警抑制
说白了,就是抑制告警,和静默不同的是,抑制的应用场景一般用于抑制符合条件的告警。举个例子:
一个数据中心有800台服务器,每台服务器有50个监控项,假设一个意味着有4w个监控告警。
如果数据中心端点,理论上来说就会有4w条告警发送到你的手机,你是处理不过来的,所以我们只需要将数据中心断电的告警发出来即可。
1. Prometheus编写规则
### 主要添加severity: criticaldc: beijing
这两行,标志着报警的级别和(可以理解为)标签[root@prometheus-server31 /softwares/prometheus-2.53.4.linux-amd64]# vim linux96-rules.yml
- name: linux96-rules-alertrules:
groups:
- name: linux96-rules-alertrules:- alert: linux96-rules-ops-alertexpr: up{job="linux96_ops_exporter"} == 0for: 3slabels:address: Shanghaiclass: linux96apps: opsseverity: criticaldc: beijingannotations:summary: "{{ $labels.instance }} 服务器已经停止运行超过 3s!!!!!"- alert: linux96-rules-k8s-alterexpr: up{job="linux96_k8s_exporter"} == 0for: 3slabels:school: Beijingclass: linux96apps: k8sseverity: warningdc: beijingannotations:summary: "{{ $labels.instance }} K8S服务器已停止运行超过 3s!"- alert: othersServer-rules-system-alterexpr: up{job="whatever_job_exporter"} == 0for: 5slabels:school: Shenzhenclass: linux96apps: bigdataseverity: warningdc: Shenzhenannotations:summary: "{{ $labels.instance }} 大数据服务器已停止运行超过 5s!"
"linux96-rules.yml" 36L, 981B written
2. Alertmanager配置告警抑制规则
......
### 在最后加入
## 配置告警抑制规则
inhibit_rules:# 如果"dc"的值相同的前提条件下。#	则当触发了"severity: critical"告警,就会抑制"severity: warning"的告警信息。
- source_match:severity: criticaltarget_match:severity: warningequal:- dc
3. 启动Alertmanager&&DingDing
[root@node-exporter43 prometheus-webhook-dingtalk-2.1.0.linux-amd64]# ./prometheus-webhook-dingtalk --web.listen-address="10.0.0.43:8060" [root@node-exporter43 alertmanager-0.28.1.linux-amd64]# ./alertmanager 4. 停止服务在钉钉验证
[root@node-exporter41 ~]# systemctl stop node-exporter.service
[root@node-exporter42 ~]# systemctl stop node-exporter.service
### 这里故意停止了相同的equal指标但是警告等级不一样,这时候只会报警我们警告时(灾难)严重级别的节点信息。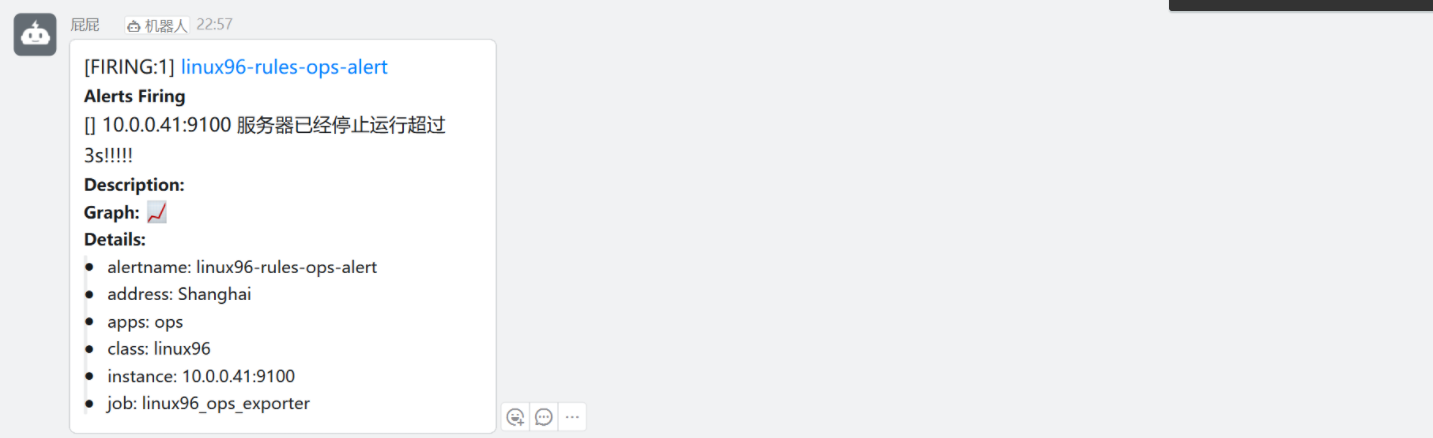
[root@node-exporter43 ~]# systemctl stop node-exporter.service
再停止一个43节点不同equal指标的,当然就可以正常通知了
5. 恢复测试
如果恢复了就正常恢复报警
[root@node-exporter41 ~]# systemctl start node-exporter.service
[root@node-exporter42 ~]# systemctl start node-exporter.service
[root@node-exporter43 ~]# systemctl start node-exporter.service
八、总结
在本博客中,我们深入探讨了 Prometheus 生态系统中的两个重要组件 ——Pushgateway 和 Alertmanager。通过学习和实践,我们了解到 Pushgateway 在特殊场景下(如短生命周期任务、防火墙限制等)弥补了 Prometheus 拉模式的不足,能够接收客户端推送的指标数据并临时存储,以便 Prometheus Server 进行拉取监控。我们还了解到 Alertmanager 的强大功能,它负责处理来自 Prometheus Server 的告警信息,实现了告警的分组、去重、抑制以及灵活的通知方式,使得告警系统更加高效和智能。
同时,我们还通过示例脚本的讲解,掌握了如何利用 Pushgateway 来推送自定义的 TCP 连接状态指标数据,进一步拓展了 Prometheus 的监控能力。理解并熟练运用 Pushgateway 和 Alertmanager 这两个组件,对于我们构建一个完整、高效、可靠的监控告警体系具有重要意义,能够更好地保障系统的稳定运行和及时响应问题。


)

:核心概念 + 命令详解 + 部署案例】)
)
 - 解堆 (行 -> 列))


