Title
题目
Predicting infant brain connectivity with federated multi-trajectory GNNs using scarce data
使用联邦多轨迹图神经网络(GNNs)结合稀缺数据预测婴儿脑连接
01
文献速递介绍
多模态影像下的婴儿脑连接演化预测:联邦学习与图神经网络的革新 多种成像模态(如T1加权MRI和fMRI)为解析脑连接的复杂动态提供了丰富工具,每种模态均能提供独特且互补的信息,对神经系统疾病的诊断至关重要。然而,获取多模态影像数据极具挑战性,因此学界致力于以最少资源预测大脑的多轨迹演化。尤其值得关注的是,婴儿出生后首年的脑连接发育是神经影像研究的核心领域——这一关键时期伴随显著的结构、形态和功能变化(Zhang et al., 2019)。理解婴儿脑连接动态不仅有助于神经发育疾病的早期诊断,相较晚期预测更能提升治疗效果(Stoessl, 2012),甚至可通过疾病易感性预测实现早期干预(Rekik et al., 2017, 2016)。探索脑连接组的发育路径对揭示其动态本质至关重要,由此催生了大量预测脑纵向演化轨迹的研究。早期研究(如Ghribi et al., 2021; Ezzine & Rekik, 2019)采用简单框架,通过样本选择策略结合K近邻(KNN)算法(Peterson, 2009)完成最终预测,而近年来更多先进深度学习方法试图突破性能瓶颈。 脑连接组可表征为图结构,其中节点对应不同脑区(ROI)(Liu, 2011),其数量取决于MRI脑分区技术(如自动解剖标记AAL或蒙特利尔神经科学研究所MNI模板,Tzourio-Mazoyer et al., 2002),边则编码脑区对间的连接强度。图神经网络(GNNs)(Veličković, 2023; Zhou et al., 2020; Bessadok et al., 2022)已在疾病分类(Rhee et al., 2017; Parisot et al., 2018)、蛋白质相互作用预测(Gainza et al., 2020; Fout et al., 2017)等生物医学任务中展现优势,逐渐成为脑网络预测的主流框架。现有研究(Göktaş et al., 2020; Hong et al., 2019; Nebli et al., 2020; Tekin et al., 2021; Demirbilek et al., 2023)提出了基于图卷积网络(GCNs,Kipf & Welling, 2016)、图生成对抗网络(gGANs,Wang et al., 2018)、图循环网络(GRNs,Liao et al., 2019; Medsker & Jain, 2001)的脑轨迹预测模型,但这类方法普遍依赖大量训练数据以确保性能和泛化能力(Hestness et al., 2017)。然而,受限于数据采集周期长、成本高及样本有限,医学数据获取难度极大。此外,现有方法多局限于单轨迹预测,而多轨迹预测(如图1所示)可从单一基线图(如结构或功能影像)生成多模态脑图,结合多源信息提升诊断准确性(如阿尔茨海默病诊断,Meng et al., 2022),因此亟需一种能应对数据稀缺的多轨迹预测模型。尽管仅有Bessadok et al. (2021) 利用师生(TS)学习范式(Hinton et al., 2015)提出小样本多轨迹演化框架,但其依赖模拟数据扩增,存在计算成本高、噪声放大及泛化偏差等缺陷。 为此,本文提出基于联邦学习的框架,通过聚合多中心小数据集提升模型性能,同时规避隐私泄露与计算负担。联邦学习支持医院等独立节点协同训练模型,在保护敏感数据的前提下融合异质数据,增强泛化能力并降低偏差。尽管近期研究(Gürler et al., 2020; Gürler & Rekik, 2022)已提出首个联邦脑图演化预测框架(4DFed-GNN及其变体),但其仅适用于单模态连接组数据,且假设同一医院内患者数据完整。本文首先提出联邦图多轨迹演化网络(FedGmTE-Net),通过联邦机制解决数据局限,继而发展出改进变体FedGmTE-Net+与FedGmTE-Net++。与Ghribi et al. (2021) 的低秩张量补全及Gürler & Rekik (2022) 的自编码方法不同,FedGmTE-Net+采用基于KNN的缺失数据填补技术,保留个体差异与时间动态,并引入辅助正则化器以最大化利用纵向脑图数据。FedGmTE-Net++进一步优化填补流程,在初始训练后通过模态与医院特异性回归器细化预测结果,提升缺失数据的补全精度。 ### 核心贡献: 1. 首个联邦多轨迹脑图预测框架:FedGmTE-Net首次将联邦学习应用于多模态脑轨迹预测,突破单轨迹建模限制。 2. 拓扑损失增强的目标函数:在标准平均绝对误差(MAE)中引入拓扑损失,保留脑图的结构特征。 3. 数据高效利用机制:FedGmTE-Net+通过KNN填补缺失数据,并利用辅助正则化器优化纵向数据利用。 4. 两步式补全优化:FedGmTE-Net++通过模态-医院特异性回归器细化初始填补结果,结合微调提升性能。 ### 期刊版新增内容: - 补全优化升级:引入填补细化步骤,针对不同模态与医院训练回归器,提升缺失数据作为“伪真值”的可靠性。 - 多场景实验扩展:在独立同分布(IID)、非IID、真实与模拟数据集上验证方法鲁棒性。 - 对比实验深化:与现有唯一多轨迹方法(TS范式)及前期框架(FedGmTE-Net*)进行全面性能对比。 - 评估指标扩充:新增皮尔逊相关系数(PCC)和杰卡德距离(JD),完善模型评价体系。 本文提出的联邦多轨迹图神经网络框架,为稀缺数据下的婴儿脑连接动态预测提供了高效、隐私保护的解决方案,有望推动早期神经发育异常的无创预测与精准干预。
Abatract
摘要
The understanding of the convoluted evolution of infant brain networks during the first postnatal year is pivotal for identifying the dynamics of early brain connectivity development. Thanks to the valuable insights into the brain’s anatomy, existing deep learning frameworks focused on forecasting the brain evolution trajectory from a single baseline observation. While yielding remarkable results, they suffer from three major limitations. First, they lack the ability to generalize to multi-trajectory prediction tasks, where each graph trajectory corresponds to a particular imaging modality or connectivity type (e.g., T1-w MRI). Second, existing models require extensive training datasets to achieve satisfactory performance which are often challenging to obtain. Third, they do not efficiently utilize incomplete time series data. To address these limitations, we introduce FedGmTE-Net++, a federated graph-based multi-trajectory evolution network. Using the power of federation, we aggregate local learnings among diverse hospitals with limited datasets. As a result, we enhance the performance of each hospital’s local generative model, while preserving data privacy. The three key innovations of FedGmTE-Net++ are: (i) presenting the first federated learning framework specifically designed for brain multi-trajectory evolution prediction in a data-scarce environment, (ii) incorporating an auxiliary regularizer in the local objective function to exploit all the longitudinal brain connectivity within the evolution trajectory and maximize data utilization, (iii) introducing a two-step imputation process, comprising a preliminary K-Nearest Neighbours based precompletion followed by an imputation refinement step that employs regressors to improve similarity scores and refine imputations. Our comprehensive experimental results showed the outperformance of FedGmTE-Net++ in brain multi-trajectory prediction from a single baseline graph in comparison with benchmark methods.
对婴儿出生后第一年脑网络复杂演化的理解,是揭示早期脑连接发育动态的关键。尽管现有深度学习框架基于单一基线观测对脑演化轨迹的预测已取得显著成果,但仍存在三大局限:首先,缺乏对多轨迹预测任务的泛化能力(每条图轨迹对应特定成像模态或连接类型,如T1加权MRI);其次,模型需大量训练数据才能达到理想性能,而这类数据往往难以获取;第三,无法高效利用不完整的时序数据。 为解决上述问题,我们提出FedGmTE-Net++,一种基于联邦图的多轨迹演化网络。通过联邦机制,我们在数据集有限的不同医院间聚合本地学习成果,在保护数据隐私的同时提升各医院本地生成模型的性能。FedGmTE-Net++的三大核心创新包括: (i)首个面向数据稀缺环境的脑多轨迹演化预测联邦学习框架,突破传统模型对单模态数据的依赖; (ii)在本地目标函数中引入辅助正则化器,充分利用演化轨迹中的纵向脑连接信息,最大化数据利用率; (iii)提出两步式数据填补流程:首先基于K近邻算法完成初步补全,随后通过回归器优化相似性分数并细化填补结果,提升缺失数据预测质量。 综合实验结果表明,与基准方法相比,FedGmTE-Net++在从单一基线脑图预测多轨迹演化任务中表现更优,为婴幼儿脑发育的多模态动态分析提供了新的技术范式。
Method
方法
In our work, we introduce FedGmTE-Net++ and its predecessor models, which are frameworks specifically designed for forecasting the multi-trajectory evolution of a baseline brain graph (i.e., one connectivity type) using federated learning. Figs. 3 and 4 provide an overview of our proposed method, while Table 1 provides a summary of the key mathematical notations used in this paper. Problem defintion. A brain connectome can be represented as a graph denoted by = {??, ??}, where ?? denotes the different ROIs of the brain. Each ROI acts as a node in the graph, resulting in the construction of the matrix ?? ∈ ????×?? , with ?? distinct ROIs, each linked to its unique ??-dimensional feature vector. The brain graph adjacency matrix, denoted as ?? ∈ ????×?? is a weighted matrix that represents the connectivity strength between different brain regions (nodes of the graph). In our framework, we vectorize each brain graph into a reduced feature vector, referred to as ??, containing a summary of the entire connectivity weights in our graph. Specifically, given that a brain graph is represented by a symmetric matrix ??, we extract its feature vector by vectorizing the off-diagonal upper-triangular part of ??. Since our problem involves the evolution prediction of multiple trajectories
在我们的研究中,我们介绍了FedGmTE-Net++及其前身模型,这些框架是专门设计用于利用联邦学习预测基线脑图(即一种连接类型)的多轨迹演化。图3和图4概述了我们提出的方法,而表1则总结了本文中使用的关键数学符号。 ### 问题定义 脑连接组可以表示为图$\mathcal{G} = {\mathcal{V}, \mathcal{E}}$,其中$\mathcal{V}$表示大脑的不同感兴趣区域(ROI)。每个ROI作为图中的节点,构成矩阵$\mathbf{X} \in \mathbb{R}^{N \times F}$,其中$N$为不同的ROI数量,每个ROI关联其唯一的$F$维特征向量。脑图邻接矩阵$\mathbf{A} \in \mathbb{R}^{N \times N}$是一个加权矩阵,表示不同脑区(图的节点)之间的连接强度。在我们的框架中,我们将每个脑图$\mathcal{G}$向量化为一个压缩特征向量$\mathbf{y}$,其中包含图中所有连接权重的汇总信息。具体来说,由于脑图由对称矩阵$\mathbf{A}$表示,我们通过向量化$\mathbf{A}$的非对角上三角部分来提取其特征向量。由于我们的问题涉及多个轨迹的演化预测,
Conclusion
结论
In conclusion, in this work, we present FedGmTE-Net++, a pioneering federated learning framework specifically designed for predicting the infant brain graph multi-trajectory evolution from a single modality graph in data-scarce environments. By combining the unique knowledge from diverse hospitals with small local training datasets, our approach substantially enhances the predictive power of each hospital’s GNN model with the help of federated learning. Additionally, we introduce an innovative auxiliary regularizer that leverages all available temporal graphs, and thus significantly enhances the accuracy of theinitial baseline model. Ultimately this leads to performance improvements across all subsequent timepoints and imaging modalities. Lastly, we introduce a supervised refined imputation technique that utilizes trained similarity regressors to elevate the quality of missing brain graph predictions at the later stages of training, further fine-tuning our models for improved performance. In our future work, we will extend Fed-GmTE-Net++ to accommodate the diverse hardware and software capabilities presented in highly heterogeneous hospital environments.
总之,本研究提出了FedGmTE-Net++,这是一种创新性联邦学习框架,专门用于在数据稀缺环境中从单一模态脑图预测婴儿脑图的多轨迹演化。通过利用联邦学习融合不同医院的小样本本地训练数据中的独特知识,我们的方法显著增强了各医院图神经网络(GNN)模型的预测能力。此外,我们引入了一种创新的辅助正则化器,该正则化器利用所有可用的时序脑图数据,从而显著提升了初始基线模型的准确性,最终实现了所有后续时间点和成像模态预测性能的提升。最后,我们提出了一种监督式细化填补技术,该技术在训练后期利用已训练的相似性回归器提高缺失脑图预测的质量,通过进一步微调模型以优化性能。在未来的工作中,我们将扩展FedGmTE-Net++,以适应高度异构的医院环境中多样化的硬件和软件能力。
Figure
图
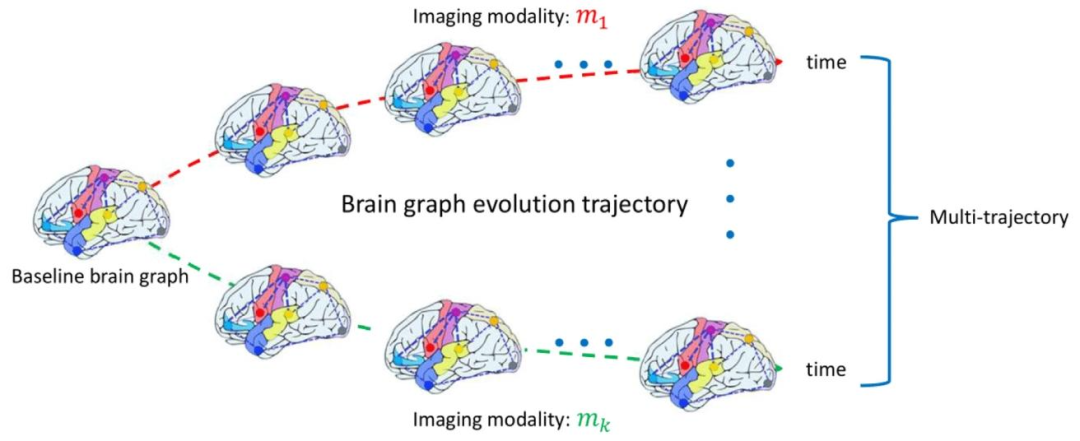
Fig. 1. Brain graph multi-trajectory evolution including different imaging modalities with a single baseline brain graph as input. We span the full multimodal space of 4D trajectories from a single brain connectome.
图 1. 脑图多轨迹演化示意图(以单一基线脑图为输入,涵盖不同成像模态)我们从单一脑连接组出发,构建跨越多模态空间的 4D 轨迹演化模型。
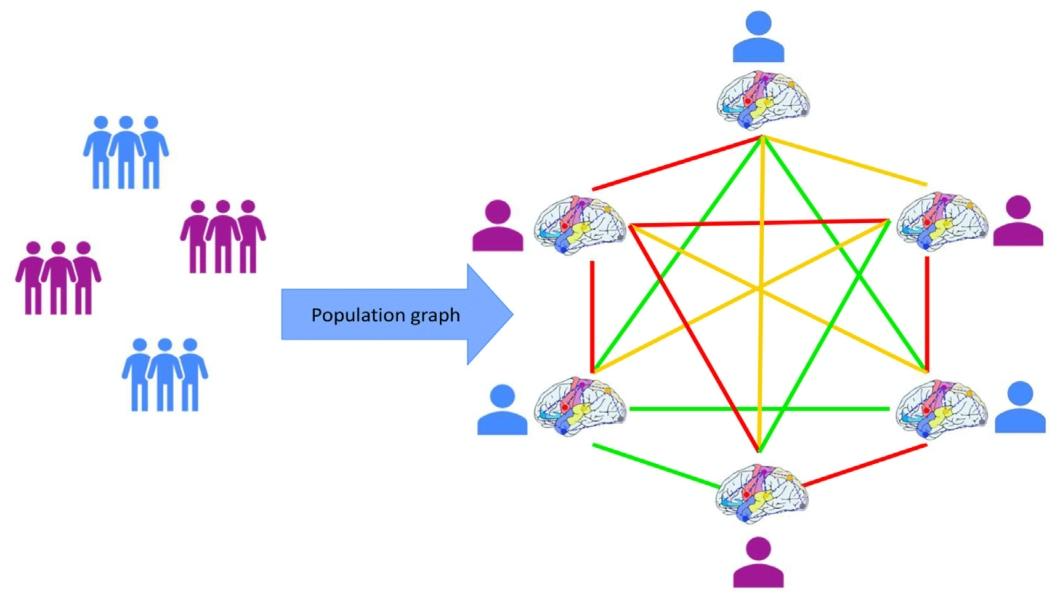
Fig. 2. Hospital-specific population graph where nodes symbolize distinct subject brain graphs within the population, and edges denote their connections. The use of various colours for the connections showcases the non-binary nature of the relationship between two subjects.
图 2. 医院特定人群脑图示意图节点表示人群中不同个体的脑图,边表示个体间的关联,连接线的不同颜色体现个体间关系的非二元特性(如关联强度或相似性程度)。
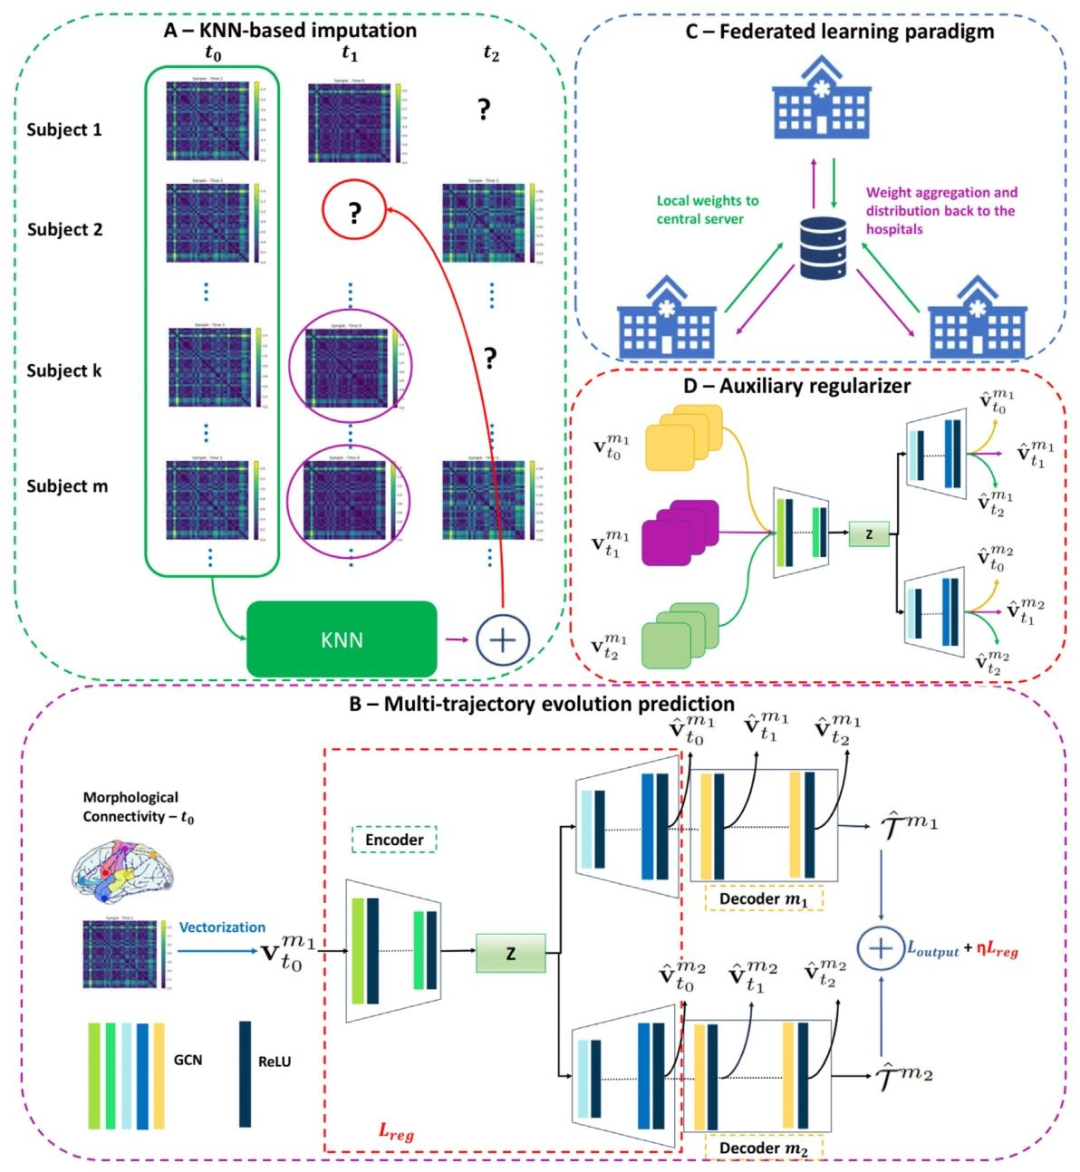
Fig. 3. Pipeline of proposed FedGmTE-Net+ for infant brain graph multi-trajectory evolution prediction from baseline. (A) KNN-based imputation Imputation technique to complete the missing graphs from each hospital’s local training set by utilizing the similarities of subjects at the baseline timepoint. (B) Multi-trajectory evolution network Each hospital’s network uses a single input modality to generate multiple trajectories spanning different imaging modalities. (C) Federated learning paradigm A decentralized learning paradigm that allows hospitals to collaborate with each other without sacrificing data privacy. (D) Auxiliary regularizer The auxiliary regularizer improves network performance by utilizing the entire local training dataset across all timepoints.
图3. 所提出的FedGmTE-Net+从基线预测婴儿脑图多轨迹演化的流程 (A)基于KNN的填补技术:利用基线时间点个体间的相似性,对各医院本地训练集中的缺失脑图进行补全。 (B)多轨迹演化网络:每个医院的网络以单一输入模态生成跨越多成像模态的演化轨迹。 (C)联邦学习范式:一种分布式学习模式,允许各医院在不牺牲数据隐私的前提下协同训练模型。 (D)辅助正则化器:通过利用所有时间点的本地训练数据,提升网络性能。 关键流程解析: 1. 数据预处理(A): - 针对各医院本地数据集的缺失时序数据,基于基线脑图计算个体间相似性(如余弦距离),通过K近邻算法推断缺失的脑图数据,生成初步完整的训练集缓解数据不完整问题。 2. 多模态轨迹生成(B): - 输入单一模态的基线脑图(如T1结构连接组),通过图神经网络(GNN)架构生成多个目标模态的演化轨迹(如fMRI功能连接、DTI纤维束连接),实现从单模态到多模态的跨空间预测。 3. **联邦协同训练(C): - 各医院在本地独立训练模型,仅向中央服务器上传模型参数更新(而非原始数据),通过多轮联邦通信(如FedAvg算法)聚合全局模型,兼顾数据隐私与跨中心数据利用。 4. 正则化优化(D): - 在本地目标函数中引入辅助正则项,强制模型学习纵向脑图数据中的时序依赖关系(如相邻时间点的平滑演化),避免过拟合并增强对稀缺数据的泛化能力。
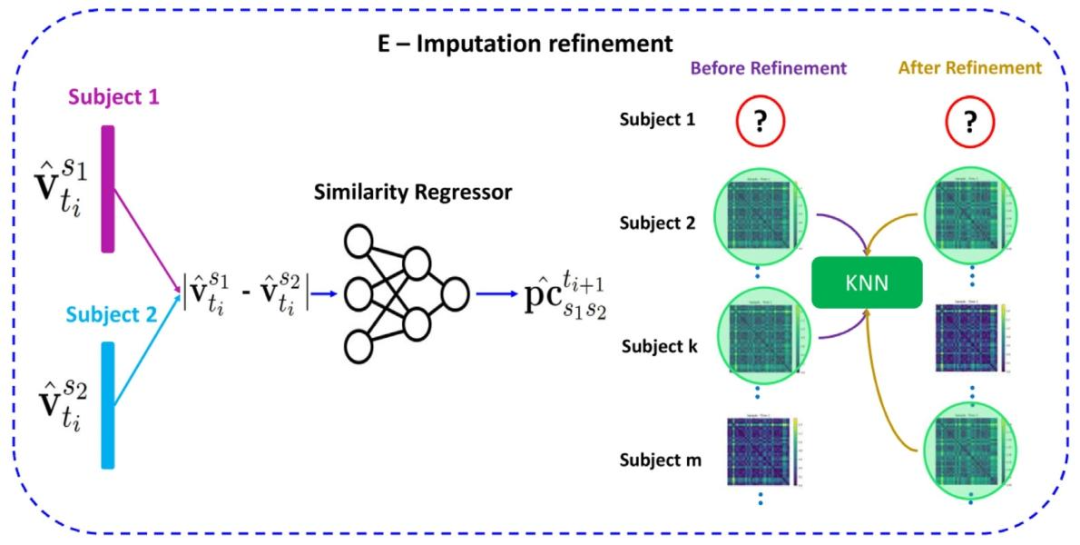
Fig. 4. (E) Imputation refinement step for the proposed FedGmTE-Net++ network. Following the initial training of the network, we proceed to train the similarity regressors. Their purpose is to update the similarity scores for subject pairs across various timepoints. The updated scores are used to improve the nearest neighbours’ selection for each subject, consequently refining the initial KNN imputation. Subsequent to this step, a series of fine-tuning rounds are executed, capitalizing on the improved dataset.
图 4. (E)所提出的 FedGmTE-Net++ 网络的填补细化步骤在网络初始训练后,我们进一步训练相似性回归器,其目的是更新各时间点个体对的相似性分数。更新后的分数用于优化每个个体的最近邻选择,从而细化初始的 KNN 填补结果。在此步骤之后,利用改进后的数据集执行一系列微调轮次。
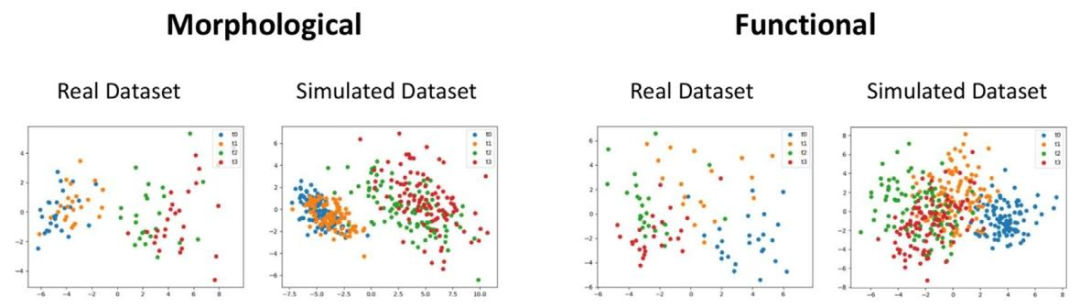
Fig. 5. PCA comparison between real and simulated datasets. Top: Comparison using the morphological connectome. Bottom: Comparison using the functional connectome.
图5. 真实数据集与模拟数据集的PCA对比。上:使用形态连接组的对比。下:使用功能连接组的对比。
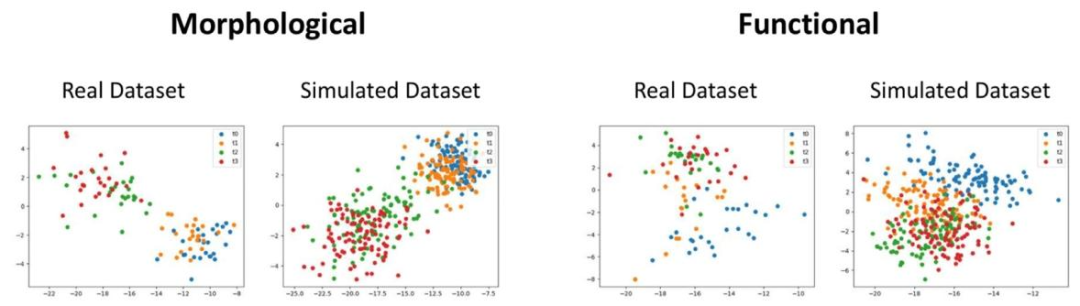
Fig. 6. SVD comparison between real and simulated datasets. Top: Comparison using the morphological connectome. Bottom: Comparison using the functional connectome.
图6. 真实数据集与模拟数据集的SVD对比。上:使用形态连接组的对比。下:使用功能连接组的对比。
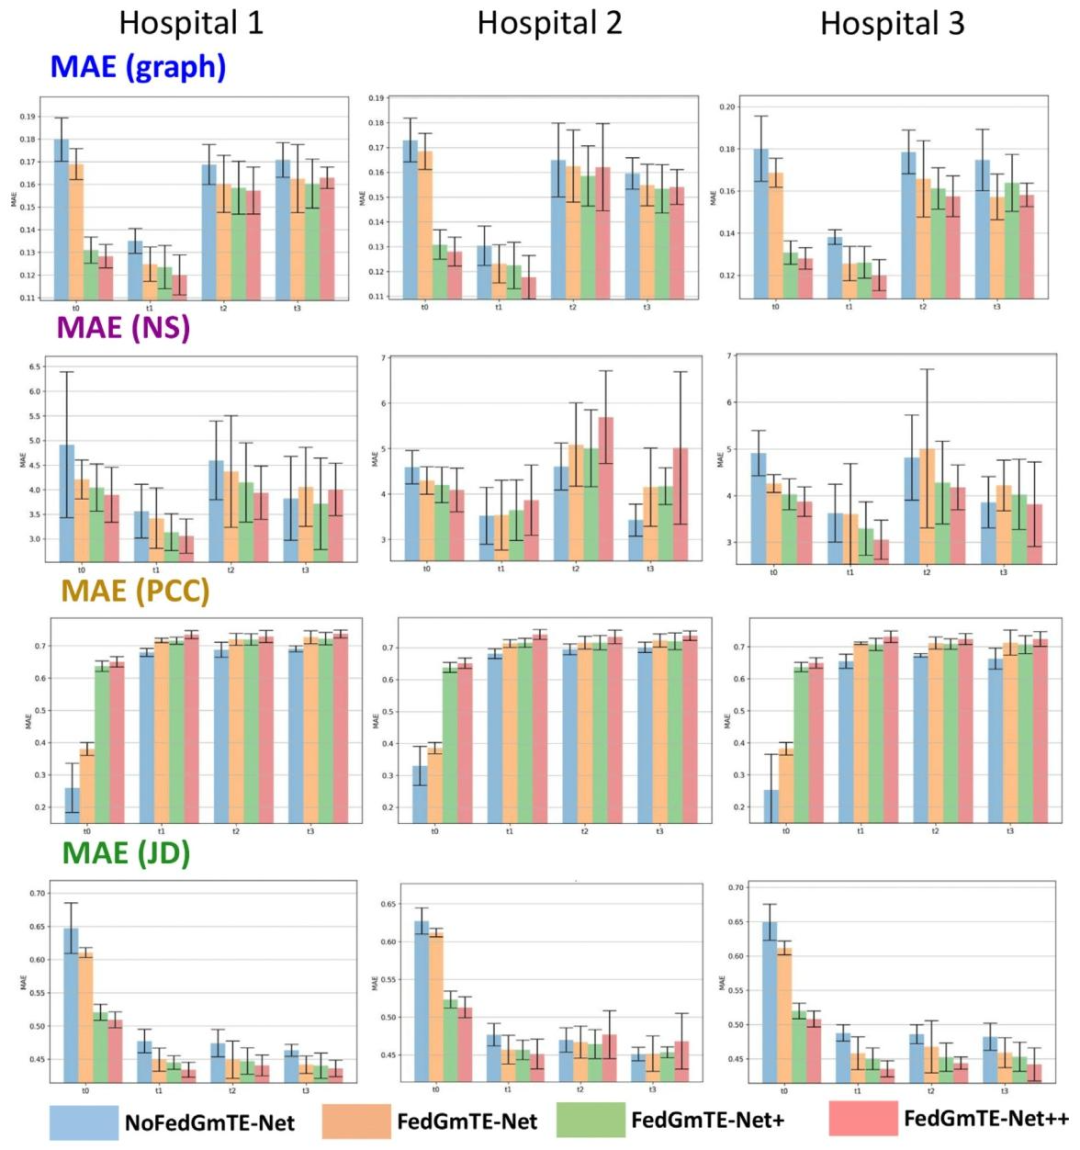
Fig. 7. Real IID data: Total MAE (graph), MAE (NS), MAE (PCC), and MAE (JD) recorded for the three hospitals at all timepoints. The average value across different modalities was taken for the NoFedGmTE-Net, FedGmTE-Net, FedGmTE-Net+, and FedGmTE-Net++ frameworks.
图7. 真实独立同分布(IID)数据:三家医院在所有时间点记录的总MAE(图)、MAE(NS)、MAE(PCC)和MAE(JD)。图中展示了NoFedGmTE-Net、FedGmTE-Net、FedGmTE-Net+和FedGmTE-Net++框架在不同模态下的平均值。
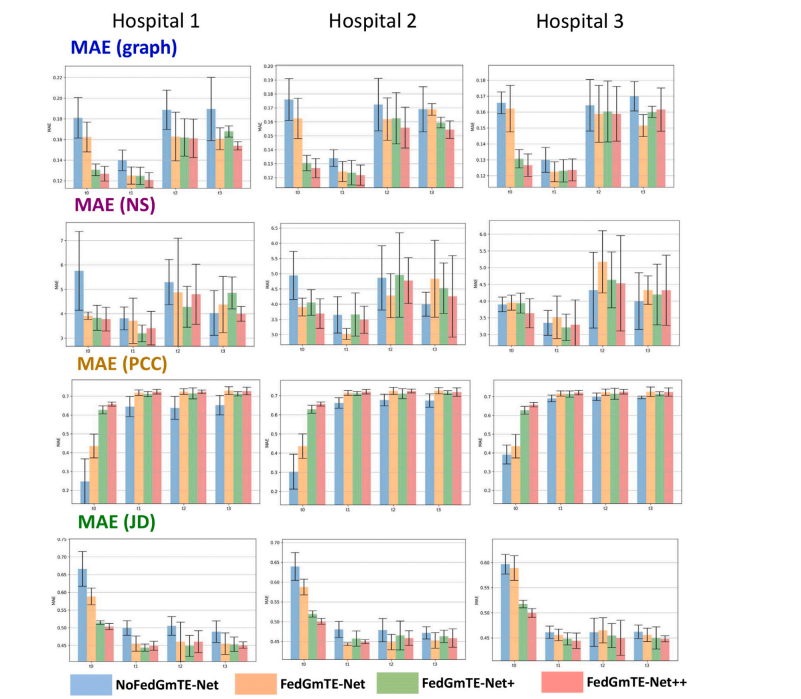
Fig. 8. Real Non-IID data: Total MAE (graph), MAE (NS), MAE (PCC), and MAE (JD) recorded for the three hospitals at all timepoints. The average value across different modalities was taken for the NoFedGmTE-Net, FedGmTE-Net, FedGmTE-Net+, and FedGmTE-Net++ frameworks.
图8. 真实非独立同分布(Non-IID)数据:三家医院在所有时间点记录的总MAE(图)、MAE(NS)、MAE(PCC)和MAE(JD)。图中展示了NoFedGmTE-Net、FedGmTE-Net、FedGmTE-Net+和FedGmTE-Net++框架在不同模态下的平均值。
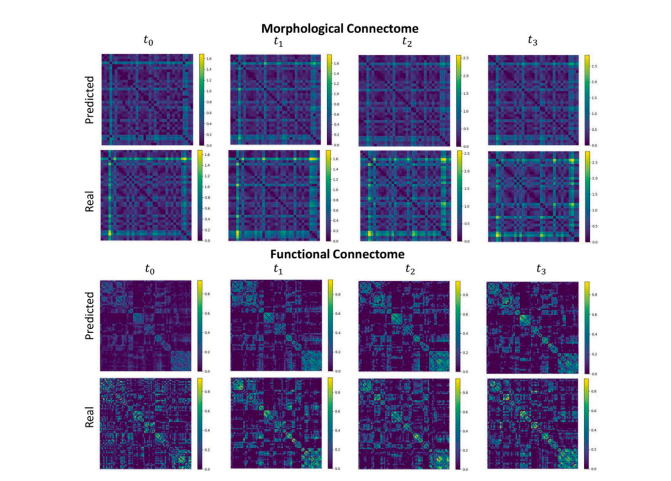
Fig. 9. Predicted against real for morphological and functional connectomes at ??0 , ??1 , ??2 and ??3 by FedGmTE-Net++ of a representative subject.
图9. FedGmTE-Net++对某典型受试者在时间点??0、??1、??2和??3的形态连接组与功能连接组的预测值与真实值对比。
Table
表
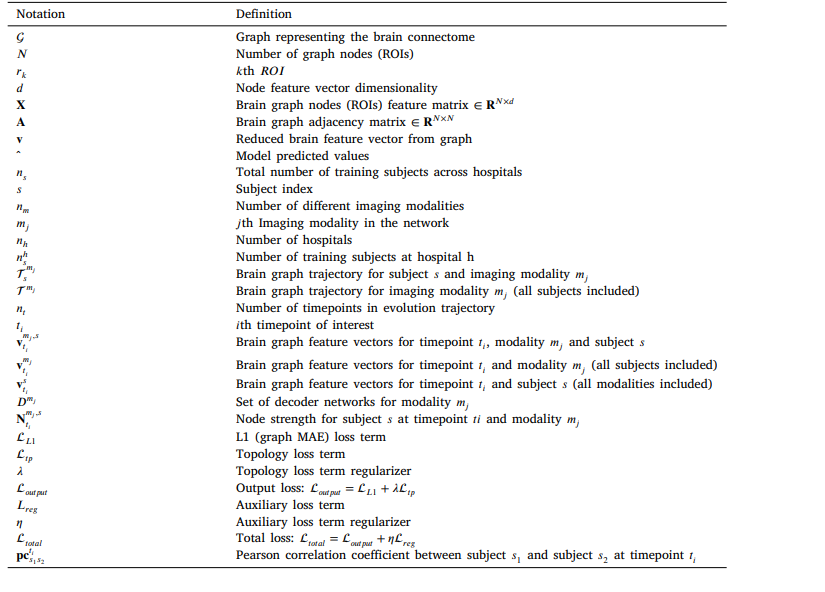
Table 1 Major mathematical notations.
表 1 主要数学符号表
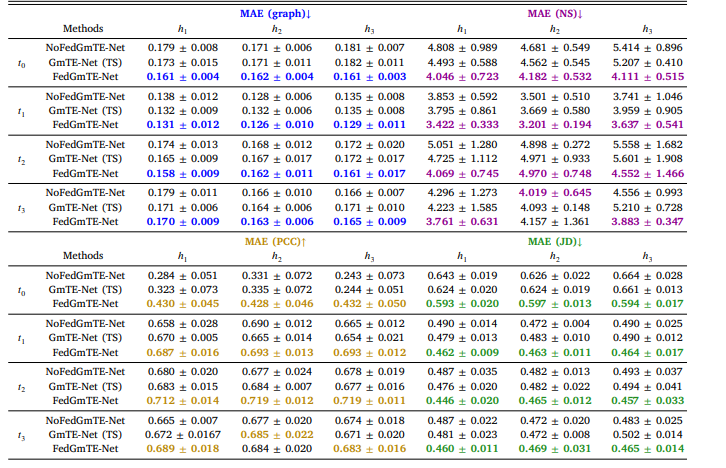
Table 2 Comparison of FedGmTE-Net, NoFedGmTE-Net, and GmTE-Net (TS). We highlight in bold, blue for MAE (graph), purple for MAE (NS), gold for MAE (PCC), and green for MAE (JD) the best performance at each hospital across timepoints. The performances for the morphological and functional trajectories are averaged.
表 2 FedGmTE-Net、NoFedGmTE-Net 与 GmTE-Net(TS)的对比, 我们以粗体标注各医院在不同时间点的最佳性能,其中MAE(图)为蓝色,MAE(NS)为紫色,MAE(PCC)为金色,MAE(JD)为绿色。形态学和功能轨迹的性能取平均值。
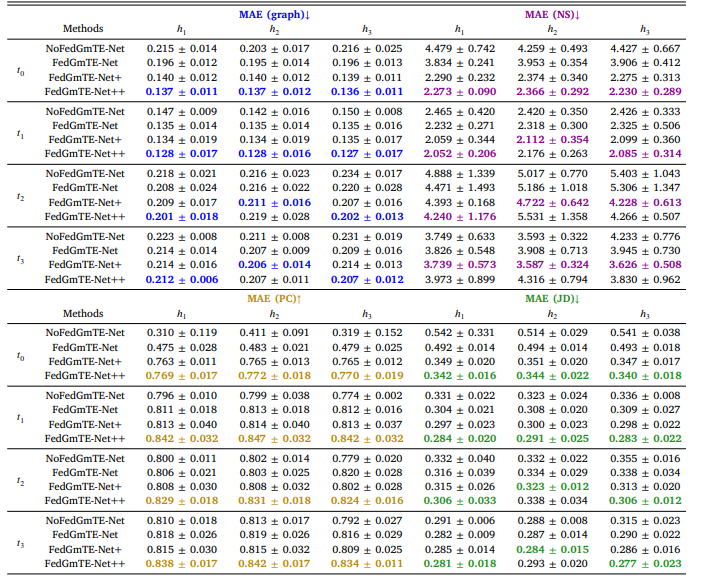
Fable 3 Real IID data: Morphological brain graph trajectory prediction by NoFedGmTE-Net, FedGmTE-Net, FedGmTE-Net+ and FedGmTE-Net++. We highlight in bold, blue for MAE (graph), purple for MAE (NS), gold for MAE (PC), and green for MAE (JD) the best performance at each hospital across timepoints
表 3 真实独立同分布(IID)数据:NoFedGmTE-Net、FedGmTE-Net、FedGmTE-Net + 和 FedGmTE-Net++ 的形态脑图轨迹预测性能
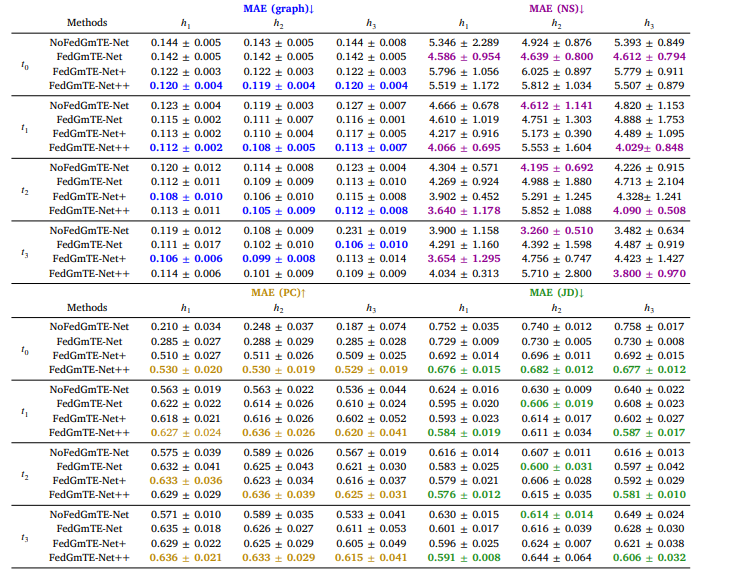
Table 4 Real IID data: Functional brain graph trajectory prediction by NoFedGmTE-Net, FedGmTE-Net, FedGmTE-Net+ and FedGmTE-Net++. We highlight in bold, blue for MAE (graph), purple for MAE (NS), gold for MAE (PC), and green for MAE (JD) the best performance at each hospital across timepoints.
表 4 真实独立同分布(IID)数据:NoFedGmTE-Net、FedGmTE-Net、FedGmTE-Net + 和 FedGmTE-Net++ 的功能脑图轨迹预测性能
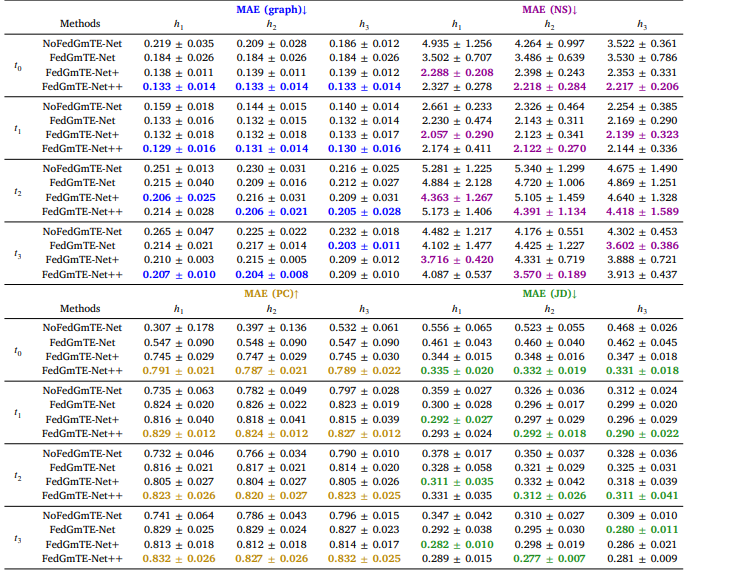
Table 5 Real Non-IID data: Morphological brain graph trajectory prediction by NoFedGmTE-Net, FedGmTE-Net, FedGmTE-Net+ and FedGmTE-Net++. We highlight in bold, blue for MAE (graph), purple for MAE (NS), gold for MAE (PC), and green for MAE (JD) the best performance at each hospital across timepoints.
表 5 真实非独立同分布(Non-IID)数据:NoFedGmTE-Net、FedGmTE-Net、FedGmTE-Net + 和 FedGmTE-Net++ 的形态脑图轨迹预测性能
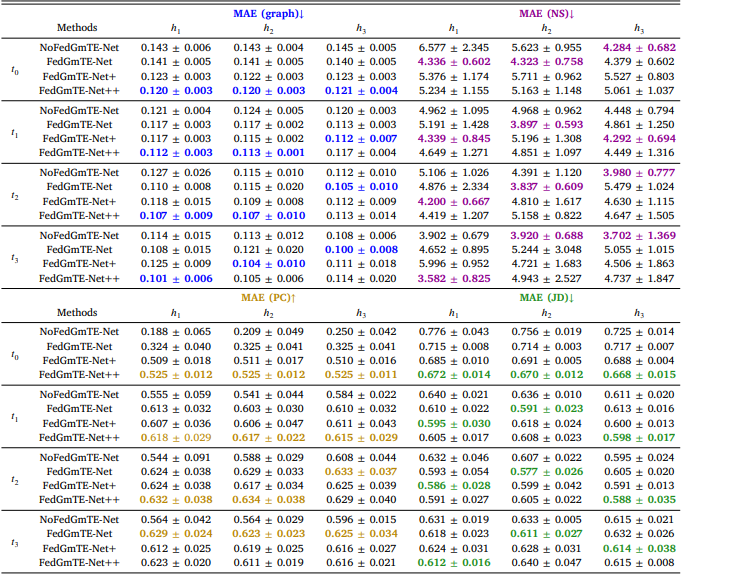
Table 6 Real Non-IID data: Functional brain graph trajectory prediction by NoFedGmTE-Net, FedGmTE-Net, FedGmTE-Net+ and FedGmTE-Net++. We highlight in bold, blue for MAE (graph), purple for MAE (NS), gold for MAE (PC), and green for MAE (JD) the best performance at each hospital across timepoints.
表6 真实非独立同分布(Non-IID)数据:NoFedGmTE-Net、FedGmTE-Net、FedGmTE-Net+和FedGmTE-Net++的功能脑图轨迹预测性能 注:各医院在不同时间点的最佳性能以粗体标注,MAE(图)为蓝色,MAE(NS)为紫色,MAE(PC)为金色,MAE(JD)为绿色。
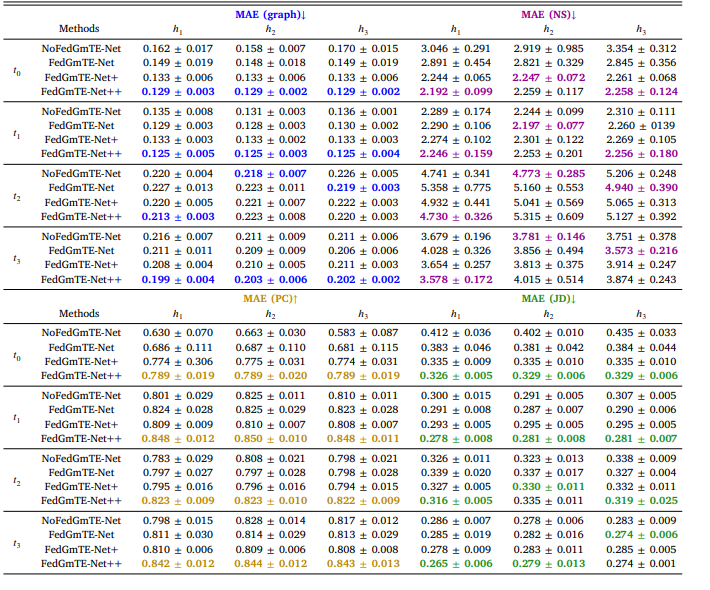
Table 7 Simulated IID data: Morphological brain graph trajectory prediction by NoFedGmTE-Net, FedGmTE-Net, FedGmTE-Net+ and FedGmTE-Net++. We highlight in bold, blue for MAE (graph), purple for MAE (NS), gold for MAE (PC), and green for MAE (JD) the best performance at each hospital across timepoints.
表7 模拟独立同分布(IID)数据:NoFedGmTE-Net、FedGmTE-Net、FedGmTE-Net+和FedGmTE-Net++的形态脑图轨迹预测性能 注:各医院在不同时间点的最佳性能以粗体标注,MAE(图)为蓝色,MAE(NS)为紫色,MAE(PC)为金色,MAE(JD)为绿色。
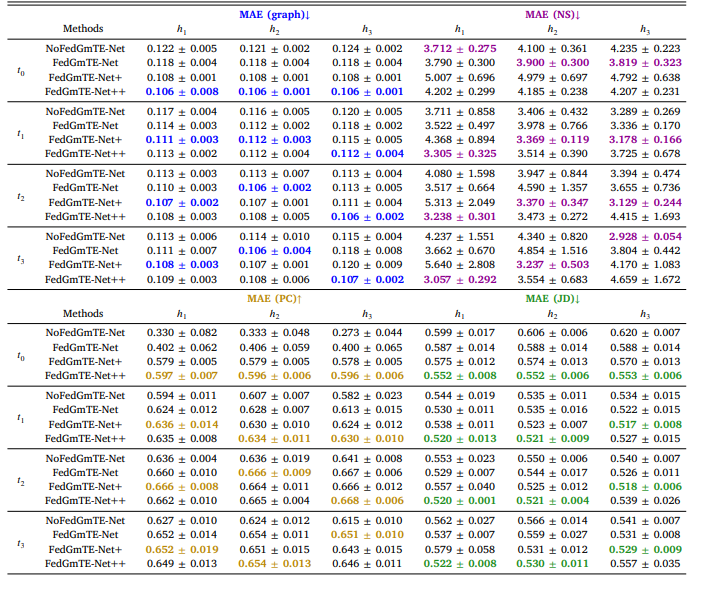
Table 8 Simulated IID data: Functional brain graph trajectory prediction by NoFedGmTE-Net, FedGmTE-Net, FedGmTE-Net+ and FedGmTE-Net++. We highlight in bold, blue for MAE (graph), purple for MAE (NS), gold for MAE (PC), and green for MAE (JD) the best performance at each hospital across timepoints.
表8 模拟独立同分布(IID)数据:NoFedGmTE-Net、FedGmTE-Net、FedGmTE-Net+和FedGmTE-Net++的功能脑图轨迹预测性能 注:各医院在不同时间点的最佳性能以粗体标注,MAE(图)为蓝色,MAE(NS)为紫色,MAE(PC)为金色,MAE(JD)为绿色。
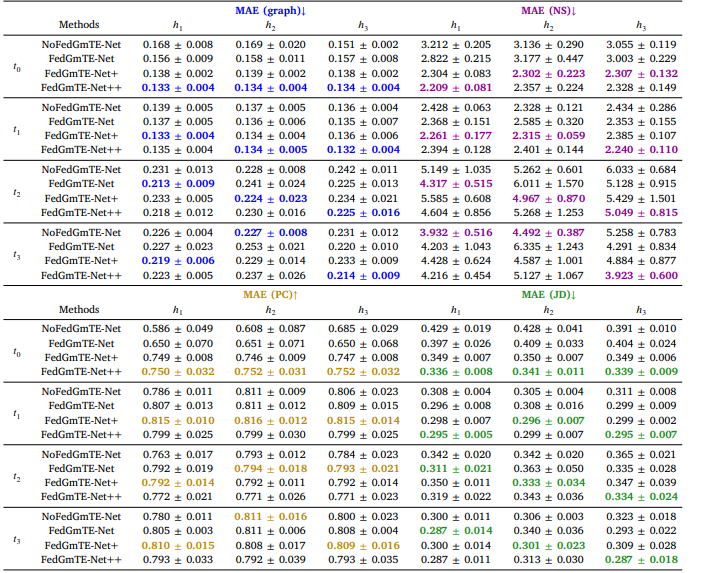
Table 9 Simulated Non-IID data: Morphological brain graph trajectory prediction by NoFedGmTE-Net, FedGmTE-Net, FedGmTE-Net+ and FedGmTENet++. We highlight in bold, blue for MAE (graph), purple for MAE (NS), gold for MAE (PC), and green for MAE (JD) the best performance at each hospital across timepoints.
表9 模拟非独立同分布(Non-IID)数据:NoFedGmTE-Net、FedGmTE-Net、FedGmTE-Net+和FedGmTE-Net++的形态脑图轨迹预测性能 注:各医院在不同时间点的最佳性能以粗体标注,MAE(图)为蓝色,MAE(NS)为紫色,MAE(PC)为金色,MAE(JD)为绿色。
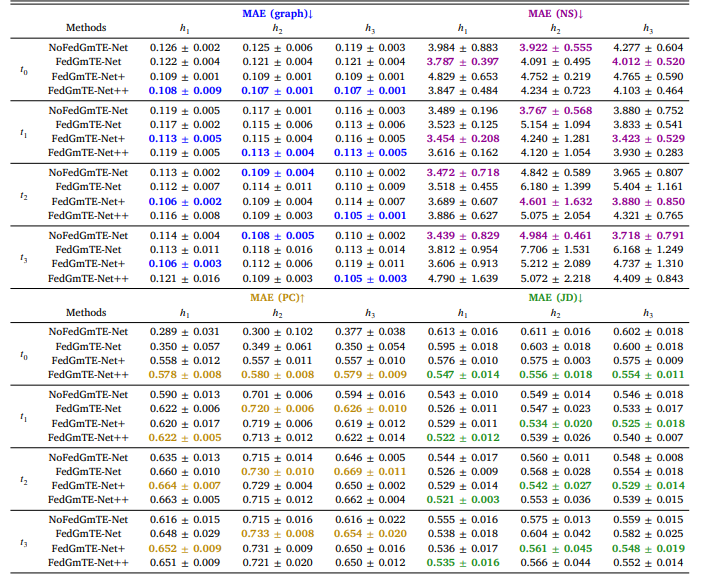
Table 10 Simulated Non-IID data: Functional brain graph trajectory prediction by NoFedGmTE-Net, FedGmTE-Net, FedGmTE-Net+ and FedGmTENet++. We highlight in bold, blue for MAE (graph), purple for MAE (NS), gold for MAE (PC), and green for MAE (JD) the best performance at each hospital across timepoints.
表10 模拟非独立同分布(Non-IID)数据:NoFedGmTE-Net、FedGmTE-Net、FedGmTE-Net+和FedGmTE-Net++的功能脑图轨迹预测性能 注:各医院在不同时间点的最佳性能以粗体标注,MAE(图)为蓝色,MAE(NS)为紫色,MAE(PC)为金色,MAE(JD)为绿色。
![[特殊字符] 深入理解 Linux 内核进程管理:架构、核心函数与调度机制](http://pic.xiahunao.cn/[特殊字符] 深入理解 Linux 内核进程管理:架构、核心函数与调度机制)


)


)


