目录
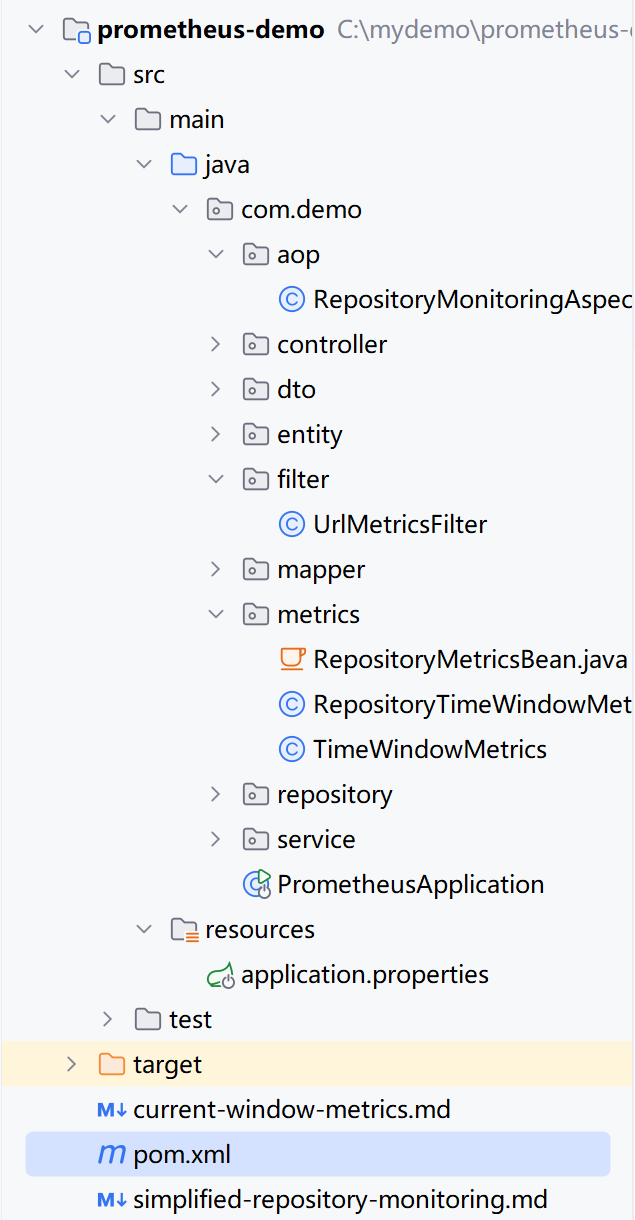
完整代码(纯Cursor生成)
1、pom
2、配置和启动类
3、自定义指标bean
4、上报
5、业务代码
一、统计API请求(次数、响应码等)
1、统计总数
关键代码:
(1)自定义指标DTO
(2)filter拦截HTTP请求并上报数据
后台监控查看
结合Grafana
2、监控峰值
关键代码
(1)计算
(2)上报
测试
二、统计Repository接口的入参出参数量
1、简单统计
关键代码
(1)bean定义
(2)AOP
测试
编辑
编辑
2、监控峰值
关键代码
(1)bean定义
(2)APO上报
测试
完整代码(纯Cursor生成)
1、pom
<?xml version="1.0" encoding="UTF-8"?>
<project xmlns="http://maven.apache.org/POM/4.0.0"xmlns:xsi="http://www.w3.org/2001/XMLSchema-instance"xsi:schemaLocation="http://maven.apache.org/POM/4.0.0 http://maven.apache.org/xsd/maven-4.0.0.xsd"><modelVersion>4.0.0</modelVersion><groupId>com.demo</groupId><artifactId>prometheus-demo</artifactId><version>1.0-SNAPSHOT</version><properties><maven.compiler.source>17</maven.compiler.source><maven.compiler.target>17</maven.compiler.target><project.build.sourceEncoding>UTF-8</project.build.sourceEncoding></properties><parent><groupId>org.springframework.boot</groupId><artifactId>spring-boot-starter-parent</artifactId><version>3.2.4</version><relativePath/></parent><dependencies><!-- Web --><dependency><groupId>org.springframework.boot</groupId><artifactId>spring-boot-starter-web</artifactId></dependency><!-- Actuator --><dependency><groupId>org.springframework.boot</groupId><artifactId>spring-boot-starter-actuator</artifactId></dependency><!-- Prometheus Registry --><dependency><groupId>io.micrometer</groupId><artifactId>micrometer-registry-prometheus</artifactId></dependency><dependency><groupId>org.projectlombok</groupId><artifactId>lombok</artifactId></dependency><!-- AOP --><dependency><groupId>org.springframework.boot</groupId><artifactId>spring-boot-starter-aop</artifactId></dependency><!--尽量不要同时导入mybatis 和 mybatis_plus,避免版本差异--><dependency><groupId>com.baomidou</groupId><artifactId>mybatis-plus-spring-boot3-starter</artifactId><version>3.5.5</version></dependency><dependency><groupId>mysql</groupId><artifactId>mysql-connector-java</artifactId><version>8.0.13</version></dependency><dependency><groupId>org.springframework.boot</groupId><artifactId>spring-boot-starter-data-redis</artifactId></dependency></dependencies><build><plugins><plugin><groupId>org.springframework.boot</groupId><artifactId>spring-boot-maven-plugin</artifactId></plugin></plugins></build></project>
2、配置和启动类
server.port=3333
server.servlet.context-path=/prometheusDemomanagement.endpoints.web.exposure.include=health,info,prometheus
management.endpoint.prometheus.enabled=true#mysql
spring.datasource.driver-class-name=com.mysql.cj.jdbc.Driver
spring.datasource.url=jdbc:mysql://localhost:3308/demo?useUnicode=true&characterEncoding=utf-8&useSSL=false&allowMultiQueries=true
spring.datasource.username=root
spring.datasource.password=wtyy
#mybatis
mybatis.mapper-locations=classpath*:mapper/*Mapper.xml
#??SQL
mybatis-plus.configuration.log-impl=org.apache.ibatis.logging.stdout.StdOutImpl
@SpringBootApplication
public class PrometheusApplication {public static void main(String[] args) {SpringApplication.run(PrometheusApplication.class, args);}
}
3、自定义指标bean
()API的
package com.demo.metrics;import lombok.extern.slf4j.Slf4j;import java.time.LocalDateTime;
import java.time.format.DateTimeFormatter;
import java.util.concurrent.ConcurrentHashMap;
import java.util.concurrent.atomic.AtomicInteger;/*** 时间窗口指标统计(仅统计当前窗口调用量)*/
@Slf4j
public class TimeWindowMetrics {// 时间窗口大小(秒)private final int windowSizeSeconds;// 存储每个时间窗口的统计数据private final ConcurrentHashMap<String, WindowStats> windowStatsMap = new ConcurrentHashMap<>();public TimeWindowMetrics(int windowSizeSeconds) {this.windowSizeSeconds = windowSizeSeconds;}/*** 记录一次API调用*/public void recordApiCall(String uri, String method, int status) {String currentWindow = getCurrentTimeWindow();String key = uri + "#" + method + "#" + status;String windowKey = currentWindow + "#" + key;// 记录当前时间窗口的统计WindowStats windowStats = windowStatsMap.computeIfAbsent(windowKey, k -> new WindowStats());int currentCount = windowStats.increment();// 清理过期的时间窗口数据cleanExpiredWindows();log.debug("📊 时间窗口统计: {} 在窗口 {} 中调用次数: {}", key, currentWindow, currentCount);}/*** 获取指定URI的当前时间窗口调用量*/public int getCurrentWindowCount(String uri, String method, int status) {String currentWindow = getCurrentTimeWindow();String key = uri + "#" + method + "#" + status;String windowKey = currentWindow + "#" + key;WindowStats stats = windowStatsMap.get(windowKey);return stats != null ? stats.getCount() : 0;}/*** 获取当前时间窗口标识*/private String getCurrentTimeWindow() {LocalDateTime now = LocalDateTime.now();// 根据窗口大小计算时间窗口int windowIndex = now.getSecond() / windowSizeSeconds;return now.format(DateTimeFormatter.ofPattern("yyyy-MM-dd HH:mm:")) + String.format("%02d", windowIndex * windowSizeSeconds);}/*** 清理过期的时间窗口数据*/private void cleanExpiredWindows() {if (windowStatsMap.size() > 1000) { // 避免内存泄漏String currentWindow = getCurrentTimeWindow();windowStatsMap.entrySet().removeIf(entry -> !entry.getKey().contains(currentWindow));log.debug("🧹 清理过期时间窗口数据,当前窗口: {}", currentWindow);}}/*** 时间窗口内的统计数据*/private static class WindowStats {private final AtomicInteger count = new AtomicInteger(0);public int increment() {return count.incrementAndGet();}public int getCount() {return count.get();}}
}
(2)Repo的
package com.demo.metrics;import lombok.extern.slf4j.Slf4j;import java.time.LocalDateTime;
import java.time.format.DateTimeFormatter;
import java.util.concurrent.ConcurrentHashMap;
import java.util.concurrent.atomic.AtomicInteger;/*** Repository层时间窗口指标统计*/
@Slf4j
public class RepositoryTimeWindowMetrics {// 时间窗口大小(秒)private final int windowSizeSeconds;// 存储每个时间窗口的Repository统计数据private final ConcurrentHashMap<String, RepositoryWindowStats> windowStatsMap = new ConcurrentHashMap<>();public RepositoryTimeWindowMetrics(int windowSizeSeconds) {this.windowSizeSeconds = windowSizeSeconds;}/*** 记录一次Repository方法调用*/public void recordMethodCall(String className, String methodName, int listElementCount) {String currentWindow = getCurrentTimeWindow();String key = className + "#" + methodName;String windowKey = currentWindow + "#" + key;// 记录当前时间窗口的统计RepositoryWindowStats windowStats = windowStatsMap.computeIfAbsent(windowKey, k -> new RepositoryWindowStats());windowStats.record(listElementCount);// 清理过期的时间窗口数据cleanExpiredWindows();log.debug("📊 Repository时间窗口统计: {} 在窗口 {} 中调用次数: {}, 元素总数: {}, 最大值: {}", key, currentWindow, windowStats.getCallCount(), windowStats.getTotalElements(), windowStats.getMaxElements());}/*** 获取指定方法的当前时间窗口调用次数*/public int getCurrentWindowCallCount(String className, String methodName) {String currentWindow = getCurrentTimeWindow();String key = className + "#" + methodName;String windowKey = currentWindow + "#" + key;RepositoryWindowStats stats = windowStatsMap.get(windowKey);return stats != null ? stats.getCallCount() : 0;}/*** 获取指定方法的当前时间窗口元素总数*/public int getCurrentWindowTotalElements(String className, String methodName) {String currentWindow = getCurrentTimeWindow();String key = className + "#" + methodName;String windowKey = currentWindow + "#" + key;RepositoryWindowStats stats = windowStatsMap.get(windowKey);return stats != null ? stats.getTotalElements() : 0;}/*** 获取指定方法的当前时间窗口最大元素个数*/public int getCurrentWindowMaxElements(String className, String methodName) {String currentWindow = getCurrentTimeWindow();String key = className + "#" + methodName;String windowKey = currentWindow + "#" + key;RepositoryWindowStats stats = windowStatsMap.get(windowKey);return stats != null ? stats.getMaxElements() : 0;}/*** 获取指定方法的当前时间窗口平均元素个数*/public double getCurrentWindowAvgElements(String className, String methodName) {String currentWindow = getCurrentTimeWindow();String key = className + "#" + methodName;String windowKey = currentWindow + "#" + key;RepositoryWindowStats stats = windowStatsMap.get(windowKey);if (stats != null && stats.getCallCount() > 0) {return (double) stats.getTotalElements() / stats.getCallCount();}return 0.0;}/*** 获取当前时间窗口标识*/private String getCurrentTimeWindow() {LocalDateTime now = LocalDateTime.now();// 根据窗口大小计算时间窗口int windowIndex = now.getSecond() / windowSizeSeconds;return now.format(DateTimeFormatter.ofPattern("yyyy-MM-dd HH:mm:")) + String.format("%02d", windowIndex * windowSizeSeconds);}/*** 清理过期的时间窗口数据*/private void cleanExpiredWindows() {if (windowStatsMap.size() > 1000) { // 避免内存泄漏String currentWindow = getCurrentTimeWindow();windowStatsMap.entrySet().removeIf(entry -> !entry.getKey().contains(currentWindow));log.debug("🧹 清理过期Repository时间窗口数据,当前窗口: {}", currentWindow);}}/*** Repository时间窗口内的统计数据*/private static class RepositoryWindowStats {private final AtomicInteger callCount = new AtomicInteger(0);private final AtomicInteger totalElements = new AtomicInteger(0);private final AtomicInteger maxElements = new AtomicInteger(0);public void record(int elementCount) {callCount.incrementAndGet();totalElements.addAndGet(elementCount);// 更新最大值maxElements.updateAndGet(current -> Math.max(current, elementCount));}public int getCallCount() {return callCount.get();}public int getTotalElements() {return totalElements.get();}public int getMaxElements() {return maxElements.get();}}
}
4、上报
(1)API的
package com.demo.filter;import com.demo.metrics.TimeWindowMetrics;
import io.micrometer.core.instrument.Gauge;
import io.micrometer.core.instrument.MeterRegistry;
import jakarta.servlet.FilterChain;
import jakarta.servlet.ServletException;
import jakarta.servlet.http.HttpServletRequest;
import jakarta.servlet.http.HttpServletResponse;
import lombok.extern.slf4j.Slf4j;
import org.springframework.beans.factory.annotation.Autowired;
import org.springframework.core.annotation.Order;
import org.springframework.stereotype.Component;
import org.springframework.web.filter.OncePerRequestFilter;import java.io.IOException;@Component
@Slf4j
@Order(1)
public class UrlMetricsFilter extends OncePerRequestFilter {@Autowiredprivate MeterRegistry meterRegistry;// 时间窗口统计(60秒窗口)private final TimeWindowMetrics timeWindowMetrics = new TimeWindowMetrics(60);@Overrideprotected void doFilterInternal(HttpServletRequest request, HttpServletResponse response, FilterChain filterChain) throws ServletException, IOException {// 过滤掉 actuator 相关的监控端点if (shouldSkipFiltering(request)) {log.debug("忽略监控: {}", request.getRequestURI());filterChain.doFilter(request, response);return;}log.debug("进入UrlMetricsFilter - API: {} {}", request.getMethod(), request.getRequestURI());try {// 执行请求filterChain.doFilter(request, response);// 记录到时间窗口统计timeWindowMetrics.recordApiCall(request.getRequestURI(), request.getMethod(), response.getStatus());// 注册当前窗口指标registerCurrentWindowMetric(request.getRequestURI(), request.getMethod(), response.getStatus());} catch (Exception e) {log.error("UrlMetricsFilter处理异常", e);throw e;}}/*** 判断是否应该跳过过滤* @param request HTTP请求* @return true表示跳过,false表示需要过滤*/private boolean shouldSkipFiltering(HttpServletRequest request) {String requestURI = request.getRequestURI();// 过滤掉 actuator 相关的监控端点if (requestURI.contains("/actuator/")) {log.debug("跳过监控端点: {}", requestURI);return true;}// 可以添加更多需要跳过的路径// 例如:静态资源、健康检查等String[] skipPaths = {"/favicon.ico","/static/","/css/","/js/","/images/"};for (String skipPath : skipPaths) {if (requestURI.contains(skipPath)) {log.debug("跳过静态资源: {}", requestURI);return true;}}return false;}/*** 注册当前时间窗口监控指标*/private void registerCurrentWindowMetric(String uri, String method, int status) {String metricName = "api_requests_current_window";// 检查指标是否已存在if (meterRegistry.find(metricName).tag("uri", uri).tag("method", method)  .tag("status", String.valueOf(status)).gauge() == null) {try {Gauge.builder(metricName, () -> (double) timeWindowMetrics.getCurrentWindowCount(uri, method, status)).description("Current time window API request count").tag("uri", uri).tag("method", method).tag("status", String.valueOf(status)).register(meterRegistry);log.debug("✅ 注册当前窗口指标: {}#{} status:{}", uri, method, status);} catch (Exception e) {log.debug("当前窗口指标已存在: {}#{} status:{}", uri, method, status);}}}
}
(2)Repo的AOP
package com.demo.aop;import io.micrometer.core.instrument.Gauge;
import io.micrometer.core.instrument.MeterRegistry;
import lombok.extern.slf4j.Slf4j;
import org.aspectj.lang.JoinPoint;
import org.aspectj.lang.annotation.After;
import org.aspectj.lang.annotation.Aspect;
import org.springframework.beans.factory.annotation.Autowired;
import org.springframework.stereotype.Component;import com.demo.metrics.RepositoryTimeWindowMetrics;import java.util.Collection;@Aspect
@Component
@Slf4j
public class RepositoryMonitoringAspect {@Autowiredprivate MeterRegistry meterRegistry;// Repository时间窗口统计(60秒窗口)private final RepositoryTimeWindowMetrics timeWindowMetrics = new RepositoryTimeWindowMetrics(60);// ========== 注释掉原有累计统计功能 ==========// 使用ConcurrentHashMap存储每个方法的统计Bean// private final ConcurrentHashMap<String, RepositoryMetricsBean> methodMetricsBeans = new ConcurrentHashMap<>();/** * Repository时间窗口统计指标:* - repository_method_calls_current_window (当前窗口调用量)* - repository_method_list_elements_max_current_window (当前窗口最大值)* - repository_method_list_elements_avg_current_window (当前窗口平均值)* - repository_method_list_elements_sum_current_window (当前窗口元素总数)** @param joinPoint*/@After("execution(* com.demo.repository.*.*(..))")public void monitorRepositoryMethod(JoinPoint joinPoint) {String className = joinPoint.getTarget().getClass().getSimpleName();String methodName = joinPoint.getSignature().getName();log.info("🔍 AOP拦截到Repository方法: {}#{}", className, methodName);// 获取List参数中的元素个数Object[] args = joinPoint.getArgs();int listElementCount = extractListElementCount(args);// ========== 注释掉原有累计统计功能 ==========/*// 1. 统计调用量 - 先查找已存在的,不存在才创建Counter callsCounter = meterRegistry.find("repository_method_calls_total").tag("class", className).tag("method", methodName).counter();if (callsCounter == null) {try {callsCounter = Counter.builder("repository_method_calls_total").description("Repository method call count").tag("class", className).tag("method", methodName).register(meterRegistry);} catch (IllegalArgumentException e) {callsCounter = meterRegistry.find("repository_method_calls_total").tag("class", className).tag("method", methodName).counter();}}if (callsCounter != null) {callsCounter.increment();}// 2. 记录List元素总数 - 先查找已存在的,不存在才创建Counter sumCounter = meterRegistry.find("repository_method_list_elements_sum").tag("class", className).tag("method", methodName).counter();if (sumCounter == null) {try {sumCounter = Counter.builder("repository_method_list_elements_sum").description("Total number of list elements").tag("class", className).tag("method", methodName).register(meterRegistry);} catch (IllegalArgumentException e) {sumCounter = meterRegistry.find("repository_method_list_elements_sum").tag("class", className).tag("method", methodName).counter();}}if (sumCounter != null) {sumCounter.increment(listElementCount);}// 3. 记录List元素统计 - 使用独立的MetricsBean处理recordListElementMetrics(className, methodName, listElementCount);// 4. 从Prometheus获取数据并计算平均值,repository_method_list_elements_avgcalculateAndReportAverage(className, methodName);*/// ========== 时间窗口统计 (保留功能) ==========// 记录到时间窗口统计timeWindowMetrics.recordMethodCall(className, methodName, listElementCount);// 注册时间窗口监控指标registerTimeWindowMetrics(className, methodName);log.info("📊 Repository时间窗口监控统计: {}#{} 调用,List元素个数: {}", className, methodName, listElementCount);}/*** 提取方法参数中List的元素个数* @param args 方法参数数组* @return List中元素的总个数*/private int extractListElementCount(Object[] args) {if (args == null || args.length == 0) {return 0;}int totalElements = 0;for (Object arg : args) {if (arg instanceof Collection) {Collection<?> collection = (Collection<?>) arg;totalElements += collection.size();log.debug("发现Collection参数,元素个数: {}", collection.size());}}return totalElements;}// ========== 注释掉原有累计统计相关方法 ==========/*/*** 记录List元素统计 - 使用独立的MetricsBean处理* @param className 类名* @param methodName 方法名  * @param listElementCount 当前List元素个数*//*private void recordListElementMetrics(String className, String methodName, int listElementCount) {// 1. 查找或创建对应方法的MetricsBeanRepositoryMetricsBean metricsBean = findOrCreateMetricsBean(className, methodName);// 2. 记录当前调用数据metricsBean.record(listElementCount);// 3. 聚合计算平均值metricsBean.aggregate();// 4. 确保Prometheus指标已注册ensurePrometheusMetricsRegistered(metricsBean);}/*** 查找或创建方法的MetricsBean*//*private RepositoryMetricsBean findOrCreateMetricsBean(String className, String methodName) {String methodKey = className + "#" + methodName;return methodMetricsBeans.computeIfAbsent(methodKey, key -> {log.debug("✅ 创建新的MetricsBean: {}", key);return new RepositoryMetricsBean(className, methodName);});}/*** 确保Prometheus指标已注册*//*private void ensurePrometheusMetricsRegistered(RepositoryMetricsBean metricsBean) {String className = metricsBean.getClassName();String methodName = metricsBean.getMethodName();// 注册最大值GaugeGauge maxGauge = meterRegistry.find("repository_method_list_elements_max").tag("class", className).tag("method", methodName).gauge();if (maxGauge == null) {try {Gauge.builder("repository_method_list_elements_max", () -> (double) metricsBean.getMaxElements()).description("Maximum number of list elements from MetricsBean").tag("class", className).tag("method", methodName).register(meterRegistry);log.debug("✅ 注册最大值Gauge: {}#{}", className, methodName);} catch (IllegalArgumentException e) {log.debug("Gauge已存在,跳过注册: {}#{}", className, methodName);}}}/*** 从Prometheus获取指标数据,计算平均值并上报* @param className 类名* @param methodName 方法名*//*private void calculateAndReportAverage(String className, String methodName) {// 使用安全的获取或创建方式try {// 捕获当前的className和methodName,避免闭包问题final String finalClassName = className;final String finalMethodName = methodName;Gauge.builder("repository_method_list_elements_avg", () -> calculateAverage(finalClassName, finalMethodName)).description("Average number of list elements (calculated from Prometheus data)").tag("class", finalClassName).tag("method", finalMethodName).register(meterRegistry);log.debug("🎯 注册平均值Gauge: {}#{}", finalClassName, finalMethodName);} catch (IllegalArgumentException e) {// 如果已存在,什么都不做,Gauge会继续工作log.debug("Gauge已存在,跳过注册: {}#{}", className, methodName);}}/*** 从MeterRegistry中获取指标值并计算平均值* @param className 类名* @param methodName 方法名* @return 平均值*//*private double calculateAverage(String className, String methodName) {try {// 从MeterRegistry获取调用次数Counter callsCounter = meterRegistry.find("repository_method_calls_total").tag("class", className).tag("method", methodName).counter();// 从MeterRegistry获取元素总数Counter sumCounter = meterRegistry.find("repository_method_list_elements_sum").tag("class", className).tag("method", methodName).counter();if (callsCounter != null && sumCounter != null) {double calls = callsCounter.count();double sum = sumCounter.count();if (calls > 0) {double average = sum / calls;log.debug("📊 计算平均值: {}#{} = {} / {} = {}", className, methodName, sum, calls, average);return average;}}log.debug("📊 暂无足够数据计算平均值: {}#{}", className, methodName);return 0.0;} catch (Exception e) {log.error("❌ 计算平均值失败: {}#{}, 错误: {}", className, methodName, e.getMessage());return 0.0;}}*//*** 注册时间窗口监控指标*/private void registerTimeWindowMetrics(String className, String methodName) {// 1. 当前时间窗口调用量String callsMetricName = "repository_method_calls_current_window";if (meterRegistry.find(callsMetricName).tag("class", className).tag("method", methodName).gauge() == null) {try {Gauge.builder(callsMetricName, () -> (double) timeWindowMetrics.getCurrentWindowCallCount(className, methodName)).description("Current time window repository method call count").tag("class", className).tag("method", methodName).register(meterRegistry);log.debug("✅ 注册时间窗口调用量指标: {}#{}", className, methodName);} catch (Exception e) {log.debug("时间窗口调用量指标已存在: {}#{}", className, methodName);}}// 2. 当前时间窗口元素总数String sumMetricName = "repository_method_list_elements_sum_current_window";if (meterRegistry.find(sumMetricName).tag("class", className).tag("method", methodName).gauge() == null) {try {Gauge.builder(sumMetricName, () -> (double) timeWindowMetrics.getCurrentWindowTotalElements(className, methodName)).description("Current time window total list elements").tag("class", className).tag("method", methodName).register(meterRegistry);log.debug("✅ 注册时间窗口元素总数指标: {}#{}", className, methodName);} catch (Exception e) {log.debug("时间窗口元素总数指标已存在: {}#{}", className, methodName);}}// 3. 当前时间窗口最大值String maxMetricName = "repository_method_list_elements_max_current_window";if (meterRegistry.find(maxMetricName).tag("class", className).tag("method", methodName).gauge() == null) {try {Gauge.builder(maxMetricName, () -> (double) timeWindowMetrics.getCurrentWindowMaxElements(className, methodName)).description("Current time window maximum list elements").tag("class", className).tag("method", methodName).register(meterRegistry);log.debug("✅ 注册时间窗口最大值指标: {}#{}", className, methodName);} catch (Exception e) {log.debug("时间窗口最大值指标已存在: {}#{}", className, methodName);}}// 4. 当前时间窗口平均值String avgMetricName = "repository_method_list_elements_avg_current_window";if (meterRegistry.find(avgMetricName).tag("class", className).tag("method", methodName).gauge() == null) {try {Gauge.builder(avgMetricName, () -> timeWindowMetrics.getCurrentWindowAvgElements(className, methodName)).description("Current time window average list elements").tag("class", className).tag("method", methodName).register(meterRegistry);log.debug("✅ 注册时间窗口平均值指标: {}#{}", className, methodName);} catch (Exception e) {log.debug("时间窗口平均值指标已存在: {}#{}", className, methodName);}}}
}
5、业务代码
controller--》service-->repo->mapper,随便举几个
UserController
@RestController
@RequestMapping("/user")
public class UserController {@Autowiredprivate UserService userService;@GetMapping("/queryByUserId")public User queryByUserId(@RequestParam("userId") Long userId) {return userService.queryByUserId(userId);}@PostMapping("/batchQueryByUserIds")public List<User> batchQueryByUserIdsPost(@RequestBody BatchQueryRequest request) {return userService.queryByUserIds(request.getUserIds());}
}
RoleRepository:
public Role findByRoleId(Long roleId) {return roleMapper.selectById(roleId);}public List<Role> findByRoleIds(List<Long> roleIds) {if (roleIds == null || roleIds.isEmpty()) {return new ArrayList<>();}return roleMapper.selectBatchIds(roleIds);}一、统计API请求(次数、响应码等)
监控API接口的调用次数、错误码等。在filter中实现。
1、统计总数
使用Cursor自动生成代码

关键代码:
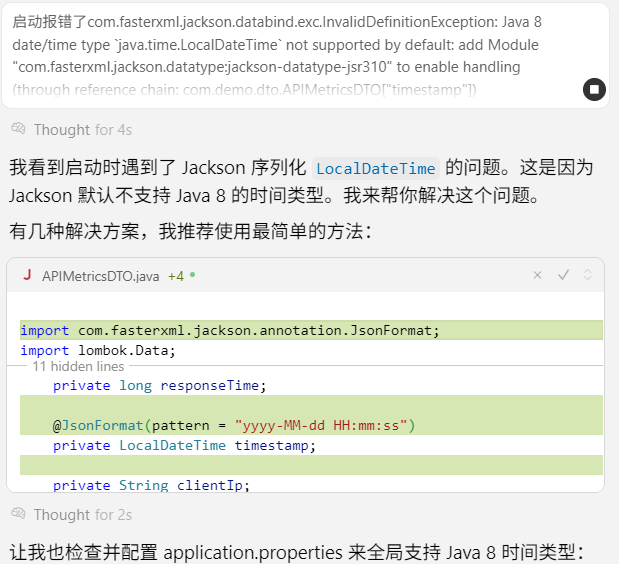
(1)自定义指标DTO
package com.demo.metrics;import lombok.Data;
import java.util.Map;@Data
public class APIMetricsMetricsBean {private String url;private String httpMethod;private String apiName;private Map<String, String[]> parameters;private String responseBody;private int statusCode;private long responseTime;private String time;private String clientIp;
}
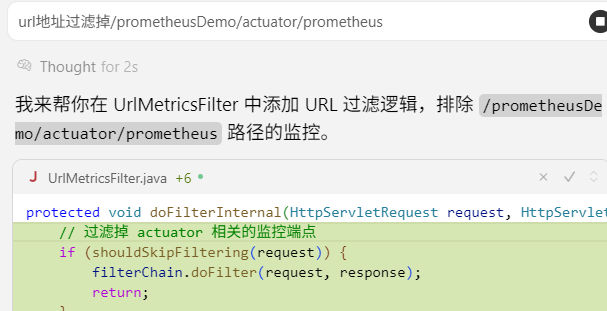
(2)filter拦截HTTP请求并上报数据
package com.demo.filter;import com.demo.metrics.APIMetricsMetricsBean;
import com.fasterxml.jackson.databind.ObjectMapper;
import io.micrometer.core.instrument.Counter;
import io.micrometer.core.instrument.MeterRegistry;
import io.micrometer.core.instrument.Timer;
import jakarta.servlet.FilterChain;
import jakarta.servlet.ServletException;
import jakarta.servlet.http.HttpServletRequest;
import jakarta.servlet.http.HttpServletResponse;
import lombok.Data;
import lombok.extern.slf4j.Slf4j;
import org.springframework.beans.factory.annotation.Autowired;
import org.springframework.core.annotation.Order;
import org.springframework.stereotype.Component;
import org.springframework.web.filter.OncePerRequestFilter;
import org.springframework.web.util.ContentCachingResponseWrapper;import java.io.IOException;
import java.text.SimpleDateFormat;
import java.time.LocalDateTime;
import java.util.Date;@Component
@Slf4j
@Order(1)
public class UrlMetricsFilter extends OncePerRequestFilter {@Autowiredprivate MeterRegistry meterRegistry;private final ObjectMapper objectMapper = new ObjectMapper();@Overrideprotected void doFilterInternal(HttpServletRequest request, HttpServletResponse response, FilterChain filterChain) throws ServletException, IOException {// 过滤掉 actuator 相关的监控端点if (shouldSkipFiltering(request)) {log.info("忽略上报");filterChain.doFilter(request, response);return;}log.info("进入UrlMetricsFilter - API: {} {}", request.getMethod(), request.getRequestURI());long startTime = System.currentTimeMillis();Timer.Sample sample = Timer.start(meterRegistry);// 使用ContentCachingResponseWrapper来捕获响应内容ContentCachingResponseWrapper responseWrapper = new ContentCachingResponseWrapper(response);try {// 执行请求filterChain.doFilter(request, responseWrapper);// 计算响应时间long responseTime = System.currentTimeMillis() - startTime;// 获取或注册TimerTimer durationTimer = meterRegistry.find("api_requests_duration_seconds").tag("uri", request.getRequestURI()).tag("method", request.getMethod()).tag("status", String.valueOf(responseWrapper.getStatus())).timer();if (durationTimer == null) {durationTimer = Timer.builder("api_requests_duration_seconds").description("API request duration in seconds").tag("uri", request.getRequestURI()).tag("method", request.getMethod()).tag("status", String.valueOf(responseWrapper.getStatus())).register(meterRegistry);}sample.stop(durationTimer);// 收集API指标数据APIMetricsMetricsBean metricsDTO = collectMetrics(request, responseWrapper, responseTime);// 上报指标reportMetrics(metricsDTO);// 记录API调用次数Counter requestCounter = meterRegistry.find("api_request_total").tag("uri", request.getRequestURI()).tag("method", request.getMethod()).tag("status", String.valueOf(responseWrapper.getStatus())).counter();if (requestCounter == null) {requestCounter = Counter.builder("api_request_total").description("Total number of API requests").tag("uri", request.getRequestURI()).tag("method", request.getMethod()).tag("status", String.valueOf(responseWrapper.getStatus())).register(meterRegistry);}requestCounter.increment();} catch (Exception e) {log.error("上报指标error", e);// 记录错误次数Counter errorCounter = meterRegistry.find("api_requests_errors_total").tag("uri", request.getRequestURI()).tag("method", request.getMethod()).counter();if (errorCounter == null) {errorCounter = Counter.builder("api_requests_errors_total").description("Total number of API request errors").tag("uri", request.getRequestURI()).tag("method", request.getMethod()).register(meterRegistry);}errorCounter.increment();} finally {// 确保响应内容被写回responseWrapper.copyBodyToResponse();}}private APIMetricsMetricsBean collectMetrics(HttpServletRequest request, ContentCachingResponseWrapper response, long responseTime) {APIMetricsMetricsBean metricsDTO = new APIMetricsMetricsBean();// 基本信息metricsDTO.setUrl(request.getRequestURL().toString());metricsDTO.setHttpMethod(request.getMethod());metricsDTO.setApiName(request.getRequestURI());SimpleDateFormat simpleDateFormat = new SimpleDateFormat("yyyy-MM-dd HH:mm:ss");metricsDTO.setTime(simpleDateFormat.format(new Date()));metricsDTO.setResponseTime(responseTime);metricsDTO.setStatusCode(response.getStatus());// 客户端IPString clientIp = getClientIpAddress(request);metricsDTO.setClientIp(clientIp);// 请求参数metricsDTO.setParameters(request.getParameterMap());// 响应内容try {byte[] responseBody = response.getContentAsByteArray();if (responseBody.length > 0) {String responseContent = new String(responseBody, response.getCharacterEncoding());// 限制响应内容长度,避免过大的日志if (responseContent.length() > 1000) {responseContent = responseContent.substring(0, 1000) + "...";}metricsDTO.setResponseBody(responseContent);}} catch (Exception e) {log.warn("获取响应内容失败");metricsDTO.setResponseBody("获取响应内容失败: " + e.getMessage());}return metricsDTO;}private void reportMetrics(APIMetricsMetricsBean metricsDTO) {try {// 记录详细的API调用日志log.info("API指标上报: {}", objectMapper.writeValueAsString(metricsDTO));// 可以在这里添加其他上报逻辑,比如发送到监控系统// 例如:发送到Kafka、写入数据库、发送到外部监控服务等} catch (Exception e) {log.error("上报API指标失败", e);}}private String getClientIpAddress(HttpServletRequest request) {String clientIp = request.getHeader("X-Forwarded-For");if (clientIp == null || clientIp.isEmpty() || "unknown".equalsIgnoreCase(clientIp)) {clientIp = request.getHeader("X-Real-IP");}if (clientIp == null || clientIp.isEmpty() || "unknown".equalsIgnoreCase(clientIp)) {clientIp = request.getHeader("Proxy-Client-IP");}if (clientIp == null || clientIp.isEmpty() || "unknown".equalsIgnoreCase(clientIp)) {clientIp = request.getHeader("WL-Proxy-Client-IP");}if (clientIp == null || clientIp.isEmpty() || "unknown".equalsIgnoreCase(clientIp)) {clientIp = request.getRemoteAddr();}// 处理多个IP的情况,取第一个if (clientIp != null && clientIp.contains(",")) {clientIp = clientIp.split(",")[0].trim();}return clientIp;}/*** 判断是否应该跳过过滤* @param request HTTP请求* @return true表示跳过,false表示需要过滤*/private boolean shouldSkipFiltering(HttpServletRequest request) {String requestURI = request.getRequestURI();// 过滤掉 actuator 相关的监控端点if (requestURI.contains("/actuator/")) {log.debug("跳过监控端点: {}", requestURI);return true;}// 可以添加更多需要跳过的路径// 例如:静态资源、健康检查等String[] skipPaths = {"/favicon.ico","/static/","/css/","/js/","/images/"};for (String skipPath : skipPaths) {if (requestURI.contains(skipPath)) {log.debug("跳过静态资源: {}", requestURI);return true;}}return false;}
}
启动项目发现在自动上报
2025-08-04T11:24:15.461+08:00  INFO 33060 --- [           main] o.s.b.a.e.web.EndpointLinksResolver      : Exposing 3 endpoint(s) beneath base path '/actuator'
2025-08-04T11:24:15.500+08:00  INFO 33060 --- [           main] o.s.b.w.embedded.tomcat.TomcatWebServer  : Tomcat started on port 3333 (http) with context path '/prometheusDemo'
2025-08-04T11:24:15.507+08:00  INFO 33060 --- [           main] com.demo.PrometheusApplication           : Started PrometheusApplication in 1.362 seconds (process running for 1.908)
2025-08-04T11:24:15.755+08:00  INFO 33060 --- [-10.100.168.183] o.a.c.c.C.[.[.[/prometheusDemo]          : Initializing Spring DispatcherServlet 'dispatcherServlet'
2025-08-04T11:24:15.755+08:00  INFO 33060 --- [-10.100.168.183] o.s.web.servlet.DispatcherServlet        : Initializing Servlet 'dispatcherServlet'
2025-08-04T11:24:15.756+08:00  INFO 33060 --- [-10.100.168.183] o.s.web.servlet.DispatcherServlet        : Completed initialization in 1 ms
2025-08-04T11:24:17.861+08:00  INFO 33060 --- [nio-3333-exec-1] com.demo.filter.UrlMetricsFilter         : 忽略上报
2025-08-04T11:24:22.775+08:00  INFO 33060 --- [nio-3333-exec-2] com.demo.filter.UrlMetricsFilter         : 忽略上报
2025-08-04T11:24:27.775+08:00  INFO 33060 --- [nio-3333-exec-3] com.demo.filter.UrlMetricsFilter         : 忽略上报
后台监控查看
启动本地Prometheus ,访问 http://localhost:9090/ 进入Prometheus UI页面。
① 输入api_request_total可以看到总览
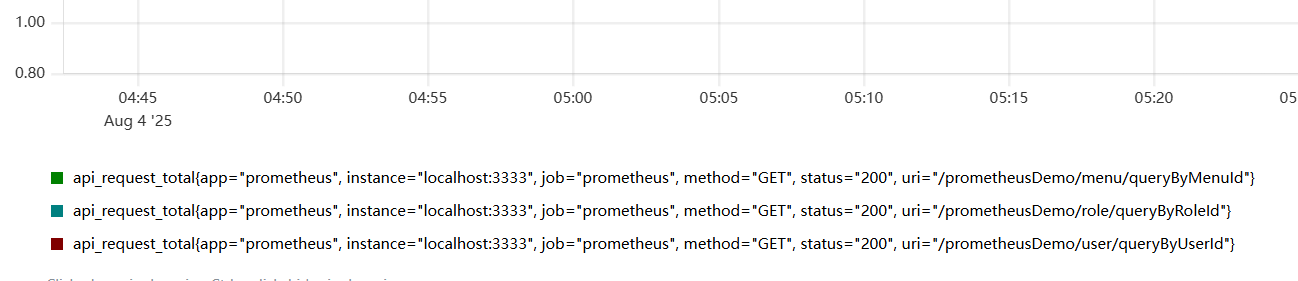
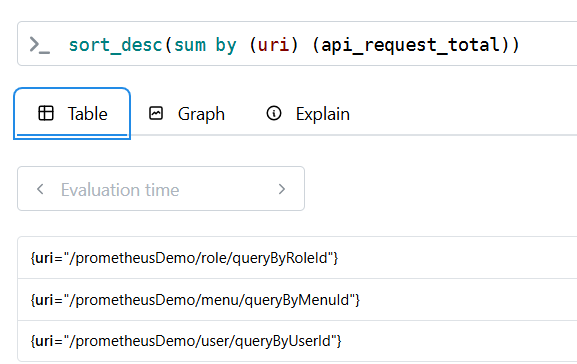
② 输入sort_desc(sum by (uri) (api_request_total))可以看到按接口访问次数倒序排列情况:
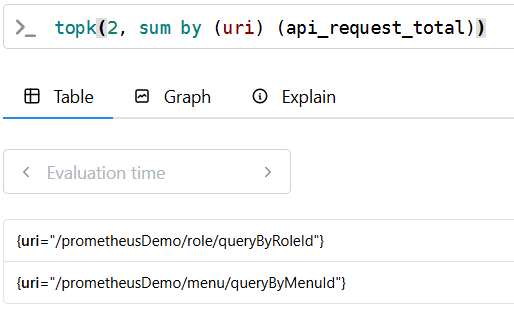
③ 输入topk(2, sum by (uri) (api_request_total)) # 按URI分组,显示访问次数最多的前2个
更多预览方法参考官方说明。
结合Grafana
对于项目上报的数据,如果需要监控多个维度,可以在Prometheus UI新建多个query,但是很不直观。下面结合Grafana展示自定义报表。
2、监控峰值
上面统计的是API的调用总数,那在服务正常运行期间肯定会一直增长,对我们意义不大。如果能监控每个时间段的调用量,这样就能看出来低峰期、高峰期,预防恶意接口攻击。
这种统计本身就随着时间变化,所以前面提到的重启服务会重新计数也不用care了。
关键代码
(1)计算
package com.demo.metrics;import lombok.extern.slf4j.Slf4j;import java.time.LocalDateTime;
import java.time.format.DateTimeFormatter;
import java.util.concurrent.ConcurrentHashMap;
import java.util.concurrent.atomic.AtomicInteger;/*** 时间窗口指标统计(仅统计当前窗口调用量)*/
@Slf4j
public class TimeWindowMetrics {// 时间窗口大小(秒)private final int windowSizeSeconds;// 存储每个时间窗口的统计数据private final ConcurrentHashMap<String, WindowStats> windowStatsMap = new ConcurrentHashMap<>();public TimeWindowMetrics(int windowSizeSeconds) {this.windowSizeSeconds = windowSizeSeconds;}/*** 记录一次API调用*/public void recordApiCall(String uri, String method, int status) {String currentWindow = getCurrentTimeWindow();String key = uri + "#" + method + "#" + status;String windowKey = currentWindow + "#" + key;// 记录当前时间窗口的统计WindowStats windowStats = windowStatsMap.computeIfAbsent(windowKey, k -> new WindowStats());int currentCount = windowStats.increment();// 清理过期的时间窗口数据cleanExpiredWindows();log.debug("📊 时间窗口统计: {} 在窗口 {} 中调用次数: {}", key, currentWindow, currentCount);}/*** 获取指定URI的当前时间窗口调用量*/public int getCurrentWindowCount(String uri, String method, int status) {String currentWindow = getCurrentTimeWindow();String key = uri + "#" + method + "#" + status;String windowKey = currentWindow + "#" + key;WindowStats stats = windowStatsMap.get(windowKey);return stats != null ? stats.getCount() : 0;}/*** 获取当前时间窗口标识*/private String getCurrentTimeWindow() {LocalDateTime now = LocalDateTime.now();// 根据窗口大小计算时间窗口int windowIndex = now.getSecond() / windowSizeSeconds;return now.format(DateTimeFormatter.ofPattern("yyyy-MM-dd HH:mm:")) + String.format("%02d", windowIndex * windowSizeSeconds);}/*** 清理过期的时间窗口数据*/private void cleanExpiredWindows() {if (windowStatsMap.size() > 1000) { // 避免内存泄漏String currentWindow = getCurrentTimeWindow();windowStatsMap.entrySet().removeIf(entry -> !entry.getKey().contains(currentWindow));log.debug("🧹 清理过期时间窗口数据,当前窗口: {}", currentWindow);}}/*** 时间窗口内的统计数据*/private static class WindowStats {private final AtomicInteger count = new AtomicInteger(0);public int increment() {return count.incrementAndGet();}public int getCount() {return count.get();}}
}
(2)上报
package com.demo.filter;import com.demo.metrics.TimeWindowMetrics;
import io.micrometer.core.instrument.Gauge;
import io.micrometer.core.instrument.MeterRegistry;
import jakarta.servlet.FilterChain;
import jakarta.servlet.ServletException;
import jakarta.servlet.http.HttpServletRequest;
import jakarta.servlet.http.HttpServletResponse;
import lombok.extern.slf4j.Slf4j;
import org.springframework.beans.factory.annotation.Autowired;
import org.springframework.core.annotation.Order;
import org.springframework.stereotype.Component;
import org.springframework.web.filter.OncePerRequestFilter;import java.io.IOException;@Component
@Slf4j
@Order(1)
public class UrlMetricsFilter extends OncePerRequestFilter {@Autowiredprivate MeterRegistry meterRegistry;// 时间窗口统计(60秒窗口)private final TimeWindowMetrics timeWindowMetrics = new TimeWindowMetrics(60);@Overrideprotected void doFilterInternal(HttpServletRequest request, HttpServletResponse response, FilterChain filterChain) throws ServletException, IOException {// 过滤掉 actuator 相关的监控端点if (shouldSkipFiltering(request)) {log.debug("忽略监控: {}", request.getRequestURI());filterChain.doFilter(request, response);return;}log.debug("进入UrlMetricsFilter - API: {} {}", request.getMethod(), request.getRequestURI());try {// 执行请求filterChain.doFilter(request, response);// 记录到时间窗口统计timeWindowMetrics.recordApiCall(request.getRequestURI(), request.getMethod(), response.getStatus());// 注册当前窗口指标registerCurrentWindowMetric(request.getRequestURI(), request.getMethod(), response.getStatus());} catch (Exception e) {log.error("UrlMetricsFilter处理异常", e);throw e;}}/*** 判断是否应该跳过过滤* @param request HTTP请求* @return true表示跳过,false表示需要过滤*/private boolean shouldSkipFiltering(HttpServletRequest request) {String requestURI = request.getRequestURI();// 过滤掉 actuator 相关的监控端点if (requestURI.contains("/actuator/")) {log.debug("跳过监控端点: {}", requestURI);return true;}// 可以添加更多需要跳过的路径// 例如:静态资源、健康检查等String[] skipPaths = {"/favicon.ico","/static/","/css/","/js/","/images/"};for (String skipPath : skipPaths) {if (requestURI.contains(skipPath)) {log.debug("跳过静态资源: {}", requestURI);return true;}}return false;}/*** 注册当前时间窗口监控指标*/private void registerCurrentWindowMetric(String uri, String method, int status) {String metricName = "api_requests_current_window";// 检查指标是否已存在if (meterRegistry.find(metricName).tag("uri", uri).tag("method", method)  .tag("status", String.valueOf(status)).gauge() == null) {try {Gauge.builder(metricName, () -> (double) timeWindowMetrics.getCurrentWindowCount(uri, method, status)).description("Current time window API request count").tag("uri", uri).tag("method", method).tag("status", String.valueOf(status)).register(meterRegistry);log.debug("✅ 注册当前窗口指标: {}#{} status:{}", uri, method, status);} catch (Exception e) {log.debug("当前窗口指标已存在: {}#{} status:{}", uri, method, status);}}}
}
测试
前面也提到了这个自带的UI不太好用,可以看到中间有没有连线的部分(服务重启造成的),
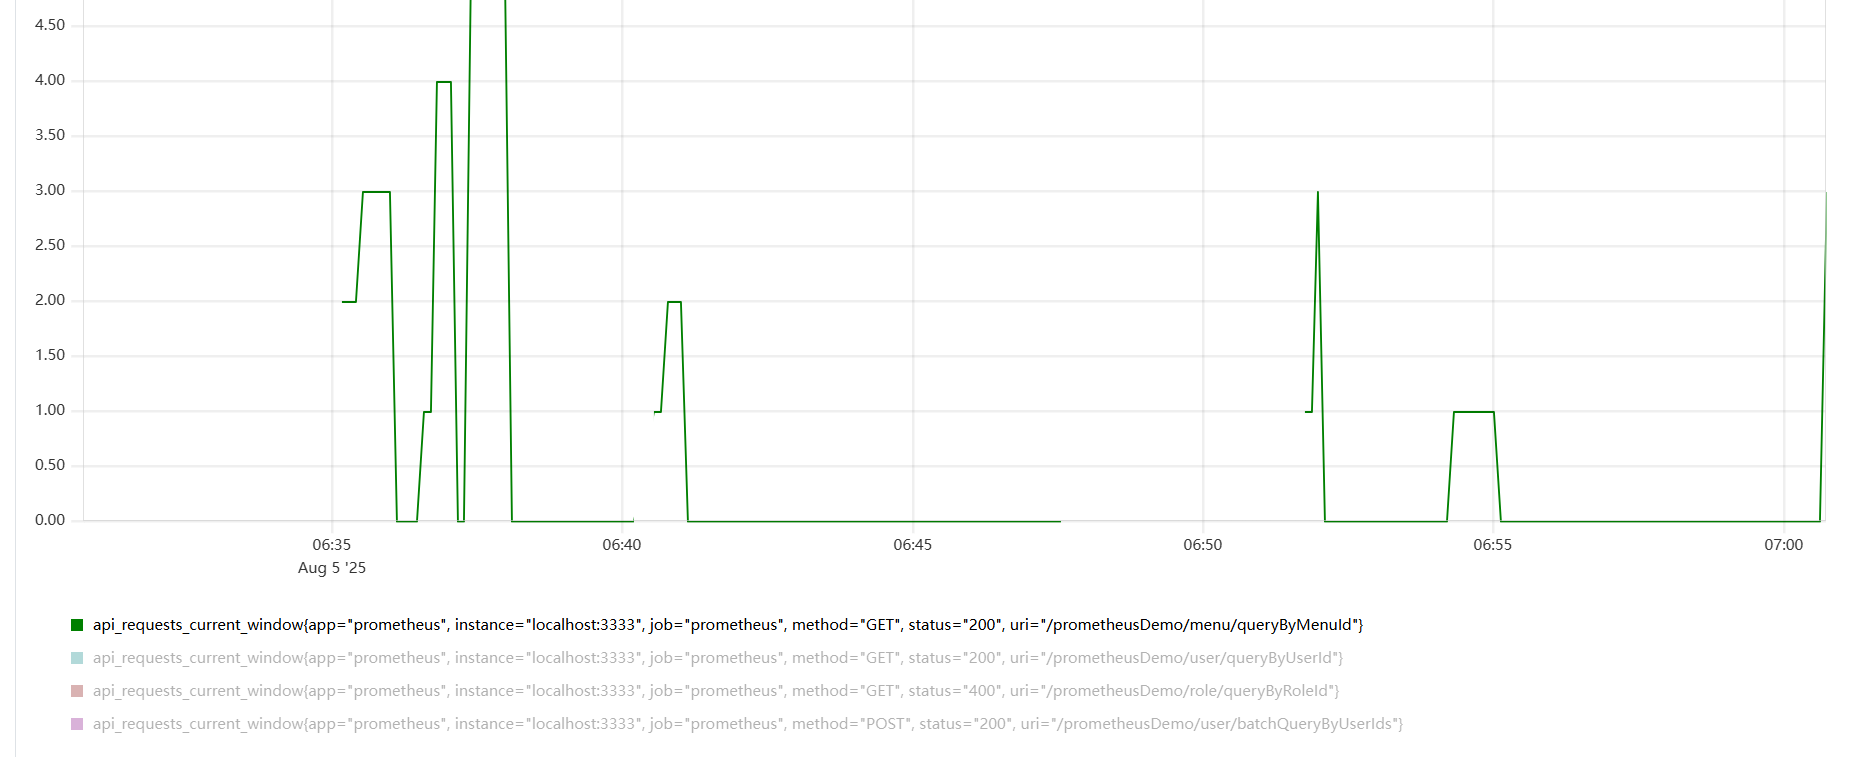
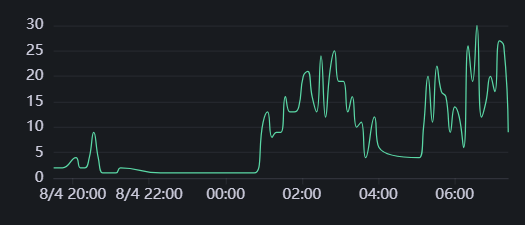
如果能像下面这样连接起来会好看一点。
二、统计Repository接口的入参出参数量
监控Repository接口的调用总量、入参List个数平均值、入参List个数最大值,防止慢查询。用AOP实现。
1、简单统计
关键代码
(1)bean定义
package com.demo.metrics;import lombok.Data;
import lombok.extern.slf4j.Slf4j;import java.util.concurrent.atomic.LongAdder;/*** Repository方法统计指标Bean*/
@Data
@Slf4j
public class RepositoryMetricsBean {// 方法标识private String className;private String methodName;// 统计字段private int callCount;private long totalElements;private long averageElements;private long maxElements = -1; // 初始值为-1,表示还没有数据// 内部累加器private transient final LongAdder callCountAdder = new LongAdder();private transient final LongAdder totalElementsAdder = new LongAdder();public RepositoryMetricsBean(String className, String methodName) {this.className = className;this.methodName = methodName;}/*** 记录一次方法调用* @param elementCount List参数的元素个数*/public void record(int elementCount) {// 1. 增加调用次数callCountAdder.add(1);callCount = callCountAdder.intValue();// 2. 累加元素总数totalElementsAdder.add(elementCount);totalElements = totalElementsAdder.longValue();// 3. 比较并更新最大值if (elementCount > maxElements) {maxElements = elementCount;log.debug("📈 更新最大值: {}#{} -> {}", className, methodName, maxElements);} else {log.debug("📊 当前值不大于最大值: {}#{} {} <= {}", className, methodName, elementCount, maxElements);}}/*** 聚合计算平均值*/public void aggregate() {if (callCount > 0) {averageElements = totalElements / callCount;}}/*** 获取方法的唯一标识*/public String getMethodKey() {return className + "#" + methodName;}
}
(2)AOP
package com.demo.aop;import io.micrometer.core.instrument.Counter;
import io.micrometer.core.instrument.Gauge;
import io.micrometer.core.instrument.MeterRegistry;
import lombok.extern.slf4j.Slf4j;
import org.aspectj.lang.JoinPoint;
import org.aspectj.lang.annotation.After;
import org.aspectj.lang.annotation.Aspect;
import org.springframework.beans.factory.annotation.Autowired;
import org.springframework.stereotype.Component;import com.demo.metrics.RepositoryMetricsBean;import java.util.Collection;
import java.util.concurrent.ConcurrentHashMap;@Aspect
@Component
@Slf4j
public class RepositoryMonitoringAspect {@Autowiredprivate MeterRegistry meterRegistry;// 使用ConcurrentHashMap存储每个方法的统计Beanprivate final ConcurrentHashMap<String, RepositoryMetricsBean> methodMetricsBeans = new ConcurrentHashMap<>();/** 接口调用量 repository_method_calls_total* List元素个数最大值  repository_method_list_elements_max* List元素个数平均值  repository_method_list_elements_avg** @param joinPoint*/@After("execution(* com.demo.repository.*.*(..))")public void monitorRepositoryMethod(JoinPoint joinPoint) {String className = joinPoint.getTarget().getClass().getSimpleName();String methodName = joinPoint.getSignature().getName();log.info("🔍 AOP拦截到Repository方法: {}#{}", className, methodName);// 获取List参数中的元素个数Object[] args = joinPoint.getArgs();int listElementCount = extractListElementCount(args);// 1. 统计调用量 - 先查找已存在的,不存在才创建Counter callsCounter = meterRegistry.find("repository_method_calls_total").tag("class", className).tag("method", methodName).counter();if (callsCounter == null) {try {callsCounter = Counter.builder("repository_method_calls_total").description("Repository method call count").tag("class", className).tag("method", methodName).register(meterRegistry);} catch (IllegalArgumentException e) {callsCounter = meterRegistry.find("repository_method_calls_total").tag("class", className).tag("method", methodName).counter();}}if (callsCounter != null) {callsCounter.increment();}// 2. 记录List元素总数 - 先查找已存在的,不存在才创建Counter sumCounter = meterRegistry.find("repository_method_list_elements_sum").tag("class", className).tag("method", methodName).counter();if (sumCounter == null) {try {sumCounter = Counter.builder("repository_method_list_elements_sum").description("Total number of list elements").tag("class", className).tag("method", methodName).register(meterRegistry);} catch (IllegalArgumentException e) {sumCounter = meterRegistry.find("repository_method_list_elements_sum").tag("class", className).tag("method", methodName).counter();}}if (sumCounter != null) {sumCounter.increment(listElementCount);}// 3. 记录List元素统计 - 使用独立的MetricsBean处理recordListElementMetrics(className, methodName, listElementCount);// 4. 从Prometheus获取数据并计算平均值,repository_method_list_elements_avgcalculateAndReportAverage(className, methodName);log.info("📊 Repository监控统计: {}#{} 调用,List元素个数: {}", className, methodName, listElementCount);}/*** 提取方法参数中List的元素个数* @param args 方法参数数组* @return List中元素的总个数*/private int extractListElementCount(Object[] args) {if (args == null || args.length == 0) {return 0;}int totalElements = 0;for (Object arg : args) {if (arg instanceof Collection) {Collection<?> collection = (Collection<?>) arg;totalElements += collection.size();log.debug("发现Collection参数,元素个数: {}", collection.size());}}return totalElements;}/*** 记录List元素统计 - 使用独立的MetricsBean处理* @param className 类名* @param methodName 方法名  * @param listElementCount 当前List元素个数*/private void recordListElementMetrics(String className, String methodName, int listElementCount) {// 1. 查找或创建对应方法的MetricsBeanRepositoryMetricsBean metricsBean = findOrCreateMetricsBean(className, methodName);// 2. 记录当前调用数据metricsBean.record(listElementCount);// 3. 聚合计算平均值metricsBean.aggregate();// 4. 确保Prometheus指标已注册ensurePrometheusMetricsRegistered(metricsBean);}/*** 查找或创建方法的MetricsBean*/private RepositoryMetricsBean findOrCreateMetricsBean(String className, String methodName) {String methodKey = className + "#" + methodName;return methodMetricsBeans.computeIfAbsent(methodKey, key -> {log.debug("✅ 创建新的MetricsBean: {}", key);return new RepositoryMetricsBean(className, methodName);});}/*** 确保Prometheus指标已注册*/private void ensurePrometheusMetricsRegistered(RepositoryMetricsBean metricsBean) {String className = metricsBean.getClassName();String methodName = metricsBean.getMethodName();// 注册最大值GaugeGauge maxGauge = meterRegistry.find("repository_method_list_elements_max").tag("class", className).tag("method", methodName).gauge();if (maxGauge == null) {try {Gauge.builder("repository_method_list_elements_max", () -> (double) metricsBean.getMaxElements()).description("Maximum number of list elements from MetricsBean").tag("class", className).tag("method", methodName).register(meterRegistry);log.debug("✅ 注册最大值Gauge: {}#{}", className, methodName);} catch (IllegalArgumentException e) {log.debug("Gauge已存在,跳过注册: {}#{}", className, methodName);}}}/*** 从Prometheus获取指标数据,计算平均值并上报* @param className 类名* @param methodName 方法名*/private void calculateAndReportAverage(String className, String methodName) {// 使用安全的获取或创建方式try {// 捕获当前的className和methodName,避免闭包问题final String finalClassName = className;final String finalMethodName = methodName;Gauge.builder("repository_method_list_elements_avg", () -> calculateAverage(finalClassName, finalMethodName)).description("Average number of list elements (calculated from Prometheus data)").tag("class", finalClassName).tag("method", finalMethodName).register(meterRegistry);log.debug("🎯 注册平均值Gauge: {}#{}", finalClassName, finalMethodName);} catch (IllegalArgumentException e) {// 如果已存在,什么都不做,Gauge会继续工作log.debug("Gauge已存在,跳过注册: {}#{}", className, methodName);}}/*** 从MeterRegistry中获取指标值并计算平均值* @param className 类名* @param methodName 方法名* @return 平均值*/private double calculateAverage(String className, String methodName) {try {// 从MeterRegistry获取调用次数Counter callsCounter = meterRegistry.find("repository_method_calls_total").tag("class", className).tag("method", methodName).counter();// 从MeterRegistry获取元素总数Counter sumCounter = meterRegistry.find("repository_method_list_elements_sum").tag("class", className).tag("method", methodName).counter();if (callsCounter != null && sumCounter != null) {double calls = callsCounter.count();double sum = sumCounter.count();if (calls > 0) {double average = sum / calls;log.debug("📊 计算平均值: {}#{} = {} / {} = {}", className, methodName, sum, calls, average);return average;}}log.debug("📊 暂无足够数据计算平均值: {}#{}", className, methodName);return 0.0;} catch (Exception e) {log.error("❌ 计算平均值失败: {}#{}, 错误: {}", className, methodName, e.getMessage());return 0.0;}}
}
测试
调用一次
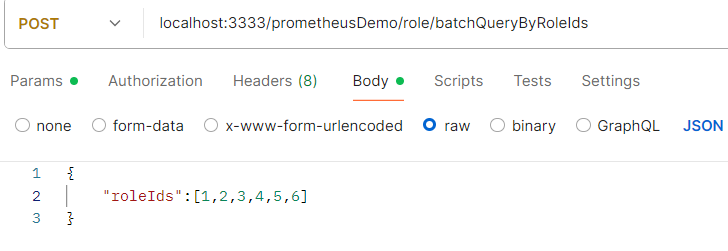
调用两次localhost:3333/prometheusDemo/user/batchQueryByUserIds
一次传16个参数,一次传17个参数。看下UI统计
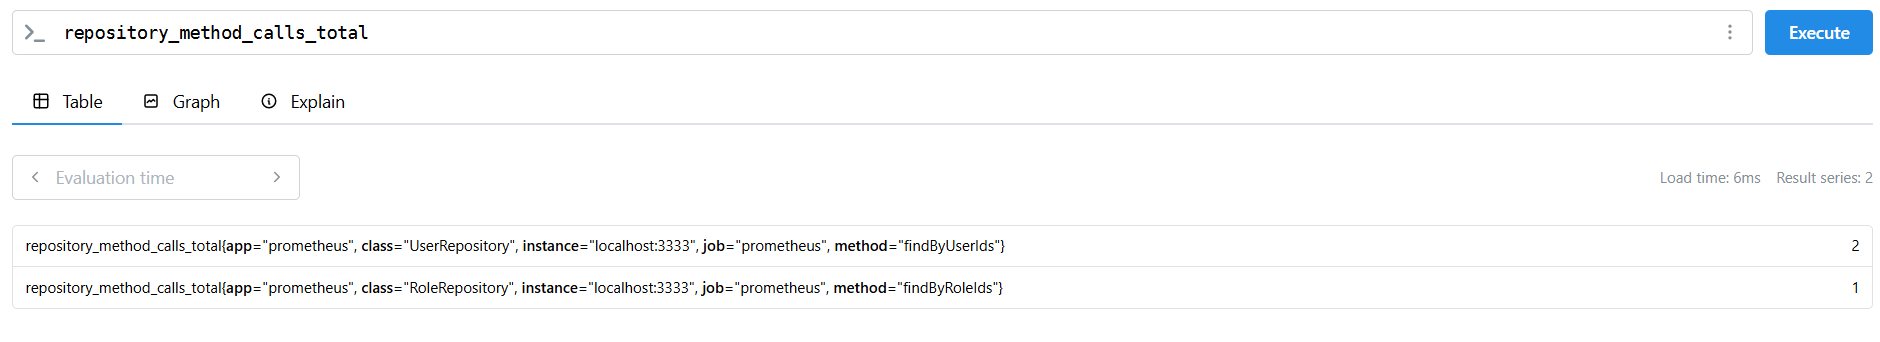
① 调用量
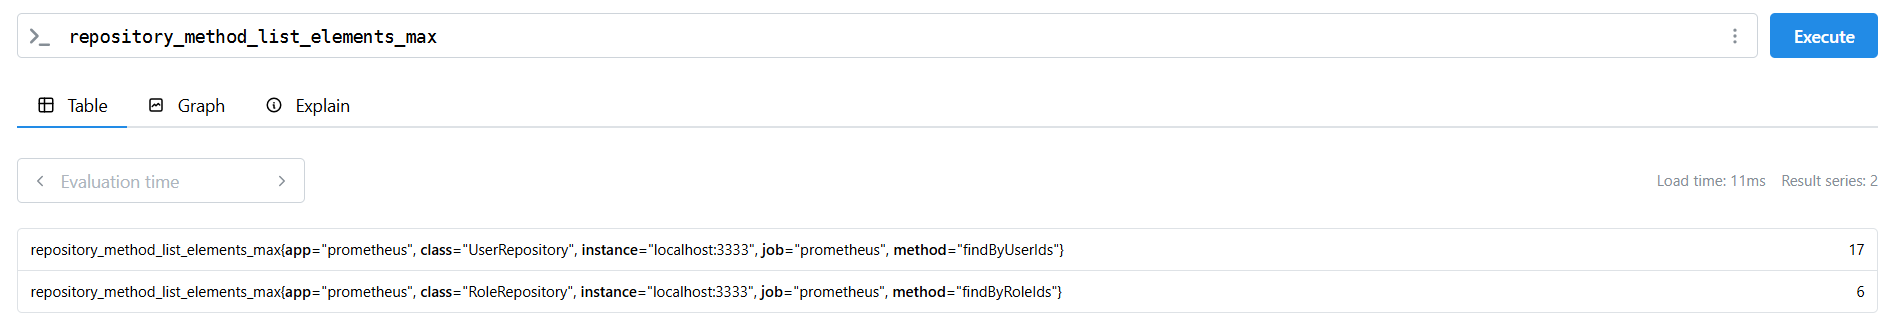
② 最大个数
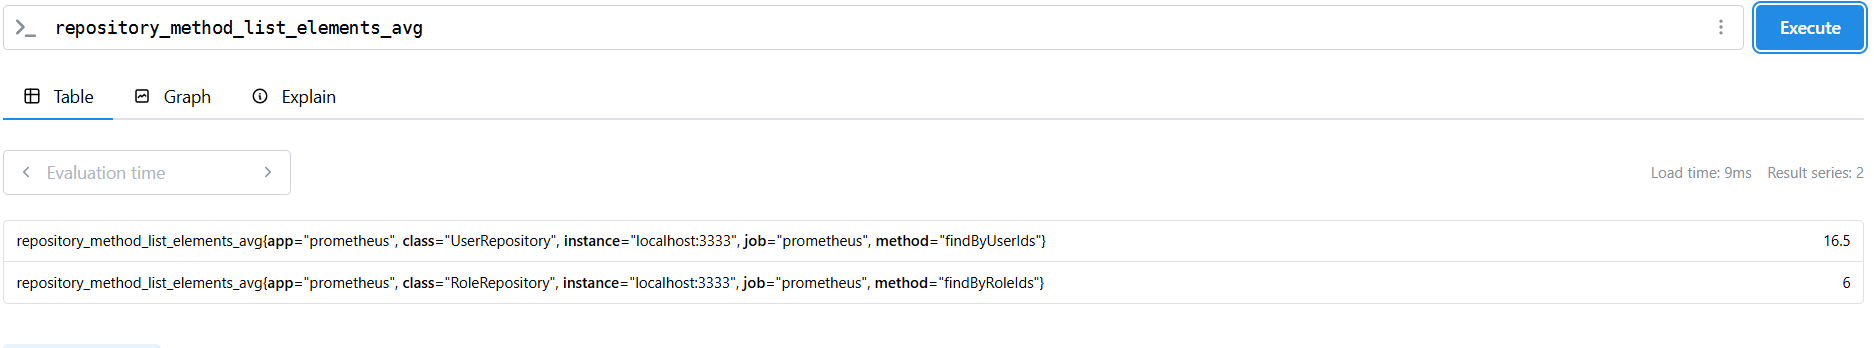
③ 平均个数
重启项目测试
访问一次localhost:3333/prometheusDemo/user/batchQueryByUserIds带18个参数,重新计算了
2、监控峰值
和上面API的监控一样,如果只是单纯的累加,那么总调用量一直在累加、max始终只有一个数字,没有意义,我们需要监控峰值。
查询1: repository_method_calls_current_window (调用量曲线)
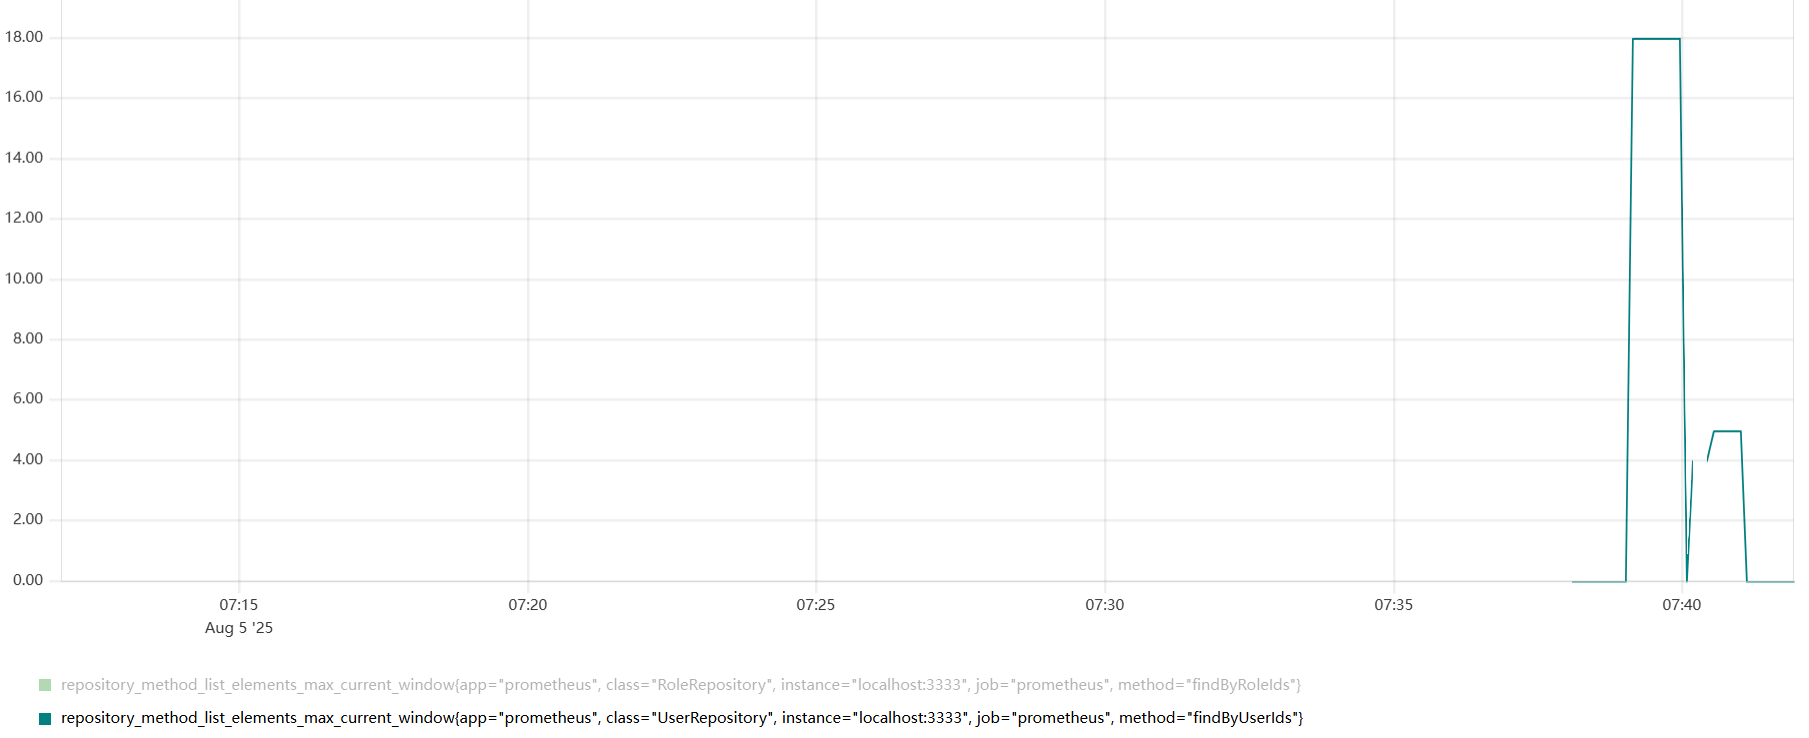
查询2: repository_method_list_elements_max_current_window (最大值曲线)
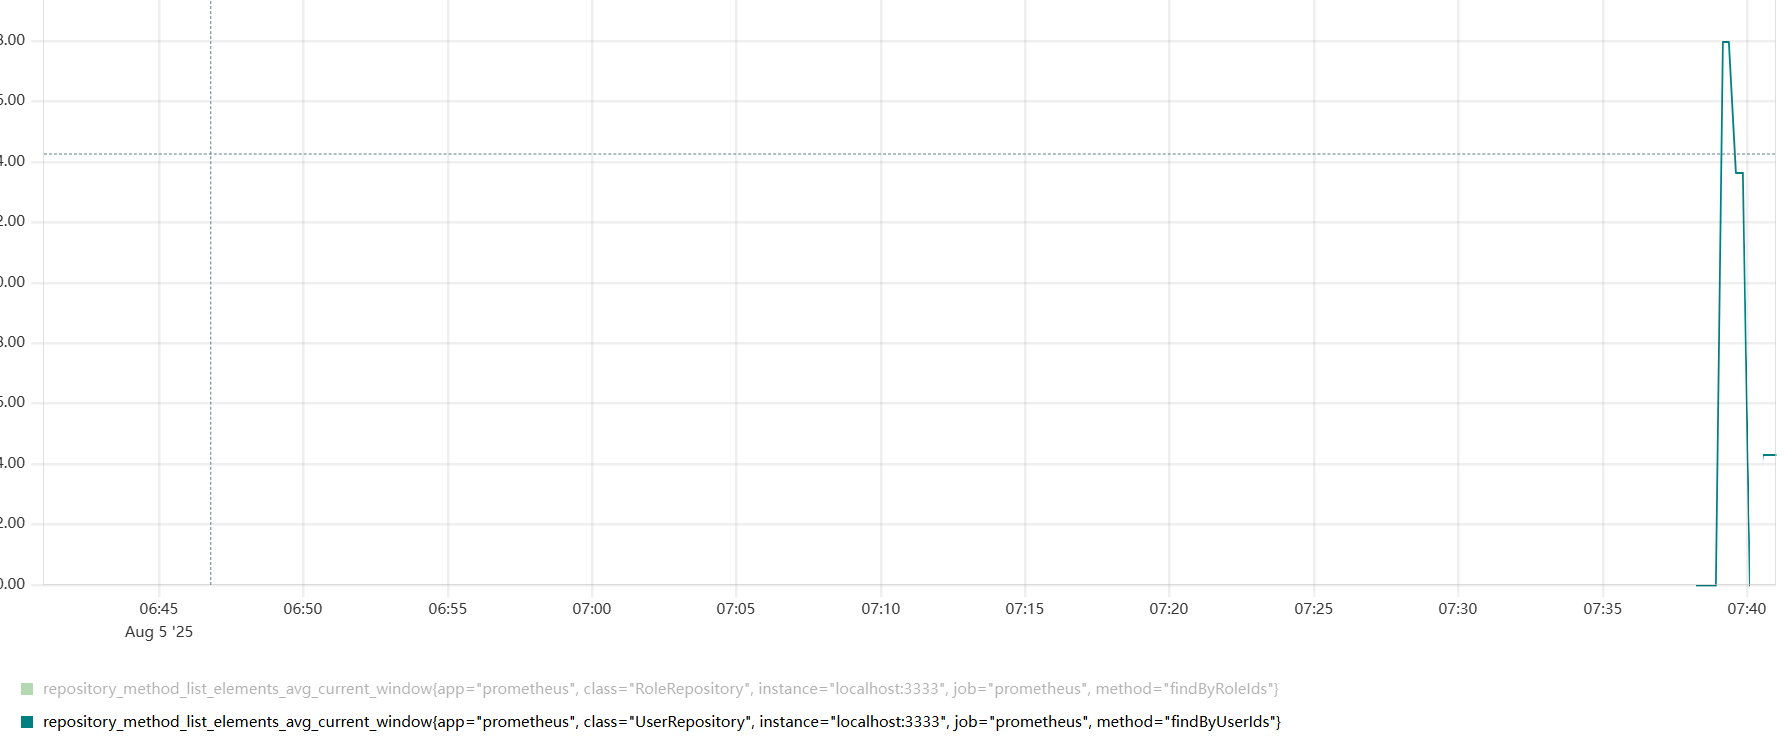
查询3: repository_method_list_elements_avg_current_window (平均值曲线)
关键代码
(1)bean定义
package com.demo.metrics;import lombok.extern.slf4j.Slf4j;import java.time.LocalDateTime;
import java.time.format.DateTimeFormatter;
import java.util.concurrent.ConcurrentHashMap;
import java.util.concurrent.atomic.AtomicInteger;/*** Repository层时间窗口指标统计*/
@Slf4j
public class RepositoryTimeWindowMetrics {// 时间窗口大小(秒)private final int windowSizeSeconds;// 存储每个时间窗口的Repository统计数据private final ConcurrentHashMap<String, RepositoryWindowStats> windowStatsMap = new ConcurrentHashMap<>();public RepositoryTimeWindowMetrics(int windowSizeSeconds) {this.windowSizeSeconds = windowSizeSeconds;}/*** 记录一次Repository方法调用*/public void recordMethodCall(String className, String methodName, int listElementCount) {String currentWindow = getCurrentTimeWindow();String key = className + "#" + methodName;String windowKey = currentWindow + "#" + key;// 记录当前时间窗口的统计RepositoryWindowStats windowStats = windowStatsMap.computeIfAbsent(windowKey, k -> new RepositoryWindowStats());windowStats.record(listElementCount);// 清理过期的时间窗口数据cleanExpiredWindows();log.debug("📊 Repository时间窗口统计: {} 在窗口 {} 中调用次数: {}, 元素总数: {}, 最大值: {}", key, currentWindow, windowStats.getCallCount(), windowStats.getTotalElements(), windowStats.getMaxElements());}/*** 获取指定方法的当前时间窗口调用次数*/public int getCurrentWindowCallCount(String className, String methodName) {String currentWindow = getCurrentTimeWindow();String key = className + "#" + methodName;String windowKey = currentWindow + "#" + key;RepositoryWindowStats stats = windowStatsMap.get(windowKey);return stats != null ? stats.getCallCount() : 0;}/*** 获取指定方法的当前时间窗口元素总数*/public int getCurrentWindowTotalElements(String className, String methodName) {String currentWindow = getCurrentTimeWindow();String key = className + "#" + methodName;String windowKey = currentWindow + "#" + key;RepositoryWindowStats stats = windowStatsMap.get(windowKey);return stats != null ? stats.getTotalElements() : 0;}/*** 获取指定方法的当前时间窗口最大元素个数*/public int getCurrentWindowMaxElements(String className, String methodName) {String currentWindow = getCurrentTimeWindow();String key = className + "#" + methodName;String windowKey = currentWindow + "#" + key;RepositoryWindowStats stats = windowStatsMap.get(windowKey);return stats != null ? stats.getMaxElements() : 0;}/*** 获取指定方法的当前时间窗口平均元素个数*/public double getCurrentWindowAvgElements(String className, String methodName) {String currentWindow = getCurrentTimeWindow();String key = className + "#" + methodName;String windowKey = currentWindow + "#" + key;RepositoryWindowStats stats = windowStatsMap.get(windowKey);if (stats != null && stats.getCallCount() > 0) {return (double) stats.getTotalElements() / stats.getCallCount();}return 0.0;}/*** 获取当前时间窗口标识*/private String getCurrentTimeWindow() {LocalDateTime now = LocalDateTime.now();// 根据窗口大小计算时间窗口int windowIndex = now.getSecond() / windowSizeSeconds;return now.format(DateTimeFormatter.ofPattern("yyyy-MM-dd HH:mm:")) + String.format("%02d", windowIndex * windowSizeSeconds);}/*** 清理过期的时间窗口数据*/private void cleanExpiredWindows() {if (windowStatsMap.size() > 1000) { // 避免内存泄漏String currentWindow = getCurrentTimeWindow();windowStatsMap.entrySet().removeIf(entry -> !entry.getKey().contains(currentWindow));log.debug("🧹 清理过期Repository时间窗口数据,当前窗口: {}", currentWindow);}}/*** Repository时间窗口内的统计数据*/private static class RepositoryWindowStats {private final AtomicInteger callCount = new AtomicInteger(0);private final AtomicInteger totalElements = new AtomicInteger(0);private final AtomicInteger maxElements = new AtomicInteger(0);public void record(int elementCount) {callCount.incrementAndGet();totalElements.addAndGet(elementCount);// 更新最大值maxElements.updateAndGet(current -> Math.max(current, elementCount));}public int getCallCount() {return callCount.get();}public int getTotalElements() {return totalElements.get();}public int getMaxElements() {return maxElements.get();}}
}
(2)APO上报
package com.demo.aop;import io.micrometer.core.instrument.Gauge;
import io.micrometer.core.instrument.MeterRegistry;
import lombok.extern.slf4j.Slf4j;
import org.aspectj.lang.JoinPoint;
import org.aspectj.lang.annotation.After;
import org.aspectj.lang.annotation.Aspect;
import org.springframework.beans.factory.annotation.Autowired;
import org.springframework.stereotype.Component;import com.demo.metrics.RepositoryTimeWindowMetrics;import java.util.Collection;@Aspect
@Component
@Slf4j
public class RepositoryMonitoringAspect {@Autowiredprivate MeterRegistry meterRegistry;// Repository时间窗口统计(60秒窗口)private final RepositoryTimeWindowMetrics timeWindowMetrics = new RepositoryTimeWindowMetrics(60);// ========== 注释掉原有累计统计功能 ==========// 使用ConcurrentHashMap存储每个方法的统计Bean// private final ConcurrentHashMap<String, RepositoryMetricsBean> methodMetricsBeans = new ConcurrentHashMap<>();/** * Repository时间窗口统计指标:* - repository_method_calls_current_window (当前窗口调用量)* - repository_method_list_elements_max_current_window (当前窗口最大值)* - repository_method_list_elements_avg_current_window (当前窗口平均值)* - repository_method_list_elements_sum_current_window (当前窗口元素总数)** @param joinPoint*/@After("execution(* com.demo.repository.*.*(..))")public void monitorRepositoryMethod(JoinPoint joinPoint) {String className = joinPoint.getTarget().getClass().getSimpleName();String methodName = joinPoint.getSignature().getName();log.info("🔍 AOP拦截到Repository方法: {}#{}", className, methodName);// 获取List参数中的元素个数Object[] args = joinPoint.getArgs();int listElementCount = extractListElementCount(args);// ========== 注释掉原有累计统计功能 ==========/*// 1. 统计调用量 - 先查找已存在的,不存在才创建Counter callsCounter = meterRegistry.find("repository_method_calls_total").tag("class", className).tag("method", methodName).counter();if (callsCounter == null) {try {callsCounter = Counter.builder("repository_method_calls_total").description("Repository method call count").tag("class", className).tag("method", methodName).register(meterRegistry);} catch (IllegalArgumentException e) {callsCounter = meterRegistry.find("repository_method_calls_total").tag("class", className).tag("method", methodName).counter();}}if (callsCounter != null) {callsCounter.increment();}// 2. 记录List元素总数 - 先查找已存在的,不存在才创建Counter sumCounter = meterRegistry.find("repository_method_list_elements_sum").tag("class", className).tag("method", methodName).counter();if (sumCounter == null) {try {sumCounter = Counter.builder("repository_method_list_elements_sum").description("Total number of list elements").tag("class", className).tag("method", methodName).register(meterRegistry);} catch (IllegalArgumentException e) {sumCounter = meterRegistry.find("repository_method_list_elements_sum").tag("class", className).tag("method", methodName).counter();}}if (sumCounter != null) {sumCounter.increment(listElementCount);}// 3. 记录List元素统计 - 使用独立的MetricsBean处理recordListElementMetrics(className, methodName, listElementCount);// 4. 从Prometheus获取数据并计算平均值,repository_method_list_elements_avgcalculateAndReportAverage(className, methodName);*/// ========== 时间窗口统计 (保留功能) ==========// 记录到时间窗口统计timeWindowMetrics.recordMethodCall(className, methodName, listElementCount);// 注册时间窗口监控指标registerTimeWindowMetrics(className, methodName);log.info("📊 Repository时间窗口监控统计: {}#{} 调用,List元素个数: {}", className, methodName, listElementCount);}/*** 提取方法参数中List的元素个数* @param args 方法参数数组* @return List中元素的总个数*/private int extractListElementCount(Object[] args) {if (args == null || args.length == 0) {return 0;}int totalElements = 0;for (Object arg : args) {if (arg instanceof Collection) {Collection<?> collection = (Collection<?>) arg;totalElements += collection.size();log.debug("发现Collection参数,元素个数: {}", collection.size());}}return totalElements;}// ========== 注释掉原有累计统计相关方法 ==========/*/*** 记录List元素统计 - 使用独立的MetricsBean处理* @param className 类名* @param methodName 方法名  * @param listElementCount 当前List元素个数*//*private void recordListElementMetrics(String className, String methodName, int listElementCount) {// 1. 查找或创建对应方法的MetricsBeanRepositoryMetricsBean metricsBean = findOrCreateMetricsBean(className, methodName);// 2. 记录当前调用数据metricsBean.record(listElementCount);// 3. 聚合计算平均值metricsBean.aggregate();// 4. 确保Prometheus指标已注册ensurePrometheusMetricsRegistered(metricsBean);}/*** 查找或创建方法的MetricsBean*//*private RepositoryMetricsBean findOrCreateMetricsBean(String className, String methodName) {String methodKey = className + "#" + methodName;return methodMetricsBeans.computeIfAbsent(methodKey, key -> {log.debug("✅ 创建新的MetricsBean: {}", key);return new RepositoryMetricsBean(className, methodName);});}/*** 确保Prometheus指标已注册*//*private void ensurePrometheusMetricsRegistered(RepositoryMetricsBean metricsBean) {String className = metricsBean.getClassName();String methodName = metricsBean.getMethodName();// 注册最大值GaugeGauge maxGauge = meterRegistry.find("repository_method_list_elements_max").tag("class", className).tag("method", methodName).gauge();if (maxGauge == null) {try {Gauge.builder("repository_method_list_elements_max", () -> (double) metricsBean.getMaxElements()).description("Maximum number of list elements from MetricsBean").tag("class", className).tag("method", methodName).register(meterRegistry);log.debug("✅ 注册最大值Gauge: {}#{}", className, methodName);} catch (IllegalArgumentException e) {log.debug("Gauge已存在,跳过注册: {}#{}", className, methodName);}}}/*** 从Prometheus获取指标数据,计算平均值并上报* @param className 类名* @param methodName 方法名*//*private void calculateAndReportAverage(String className, String methodName) {// 使用安全的获取或创建方式try {// 捕获当前的className和methodName,避免闭包问题final String finalClassName = className;final String finalMethodName = methodName;Gauge.builder("repository_method_list_elements_avg", () -> calculateAverage(finalClassName, finalMethodName)).description("Average number of list elements (calculated from Prometheus data)").tag("class", finalClassName).tag("method", finalMethodName).register(meterRegistry);log.debug("🎯 注册平均值Gauge: {}#{}", finalClassName, finalMethodName);} catch (IllegalArgumentException e) {// 如果已存在,什么都不做,Gauge会继续工作log.debug("Gauge已存在,跳过注册: {}#{}", className, methodName);}}/*** 从MeterRegistry中获取指标值并计算平均值* @param className 类名* @param methodName 方法名* @return 平均值*//*private double calculateAverage(String className, String methodName) {try {// 从MeterRegistry获取调用次数Counter callsCounter = meterRegistry.find("repository_method_calls_total").tag("class", className).tag("method", methodName).counter();// 从MeterRegistry获取元素总数Counter sumCounter = meterRegistry.find("repository_method_list_elements_sum").tag("class", className).tag("method", methodName).counter();if (callsCounter != null && sumCounter != null) {double calls = callsCounter.count();double sum = sumCounter.count();if (calls > 0) {double average = sum / calls;log.debug("📊 计算平均值: {}#{} = {} / {} = {}", className, methodName, sum, calls, average);return average;}}log.debug("📊 暂无足够数据计算平均值: {}#{}", className, methodName);return 0.0;} catch (Exception e) {log.error("❌ 计算平均值失败: {}#{}, 错误: {}", className, methodName, e.getMessage());return 0.0;}}*//*** 注册时间窗口监控指标*/private void registerTimeWindowMetrics(String className, String methodName) {// 1. 当前时间窗口调用量String callsMetricName = "repository_method_calls_current_window";if (meterRegistry.find(callsMetricName).tag("class", className).tag("method", methodName).gauge() == null) {try {Gauge.builder(callsMetricName, () -> (double) timeWindowMetrics.getCurrentWindowCallCount(className, methodName)).description("Current time window repository method call count").tag("class", className).tag("method", methodName).register(meterRegistry);log.debug("✅ 注册时间窗口调用量指标: {}#{}", className, methodName);} catch (Exception e) {log.debug("时间窗口调用量指标已存在: {}#{}", className, methodName);}}// 2. 当前时间窗口元素总数String sumMetricName = "repository_method_list_elements_sum_current_window";if (meterRegistry.find(sumMetricName).tag("class", className).tag("method", methodName).gauge() == null) {try {Gauge.builder(sumMetricName, () -> (double) timeWindowMetrics.getCurrentWindowTotalElements(className, methodName)).description("Current time window total list elements").tag("class", className).tag("method", methodName).register(meterRegistry);log.debug("✅ 注册时间窗口元素总数指标: {}#{}", className, methodName);} catch (Exception e) {log.debug("时间窗口元素总数指标已存在: {}#{}", className, methodName);}}// 3. 当前时间窗口最大值String maxMetricName = "repository_method_list_elements_max_current_window";if (meterRegistry.find(maxMetricName).tag("class", className).tag("method", methodName).gauge() == null) {try {Gauge.builder(maxMetricName, () -> (double) timeWindowMetrics.getCurrentWindowMaxElements(className, methodName)).description("Current time window maximum list elements").tag("class", className).tag("method", methodName).register(meterRegistry);log.debug("✅ 注册时间窗口最大值指标: {}#{}", className, methodName);} catch (Exception e) {log.debug("时间窗口最大值指标已存在: {}#{}", className, methodName);}}// 4. 当前时间窗口平均值String avgMetricName = "repository_method_list_elements_avg_current_window";if (meterRegistry.find(avgMetricName).tag("class", className).tag("method", methodName).gauge() == null) {try {Gauge.builder(avgMetricName, () -> timeWindowMetrics.getCurrentWindowAvgElements(className, methodName)).description("Current time window average list elements").tag("class", className).tag("method", methodName).register(meterRegistry);log.debug("✅ 注册时间窗口平均值指标: {}#{}", className, methodName);} catch (Exception e) {log.debug("时间窗口平均值指标已存在: {}#{}", className, methodName);}}}
}
测试
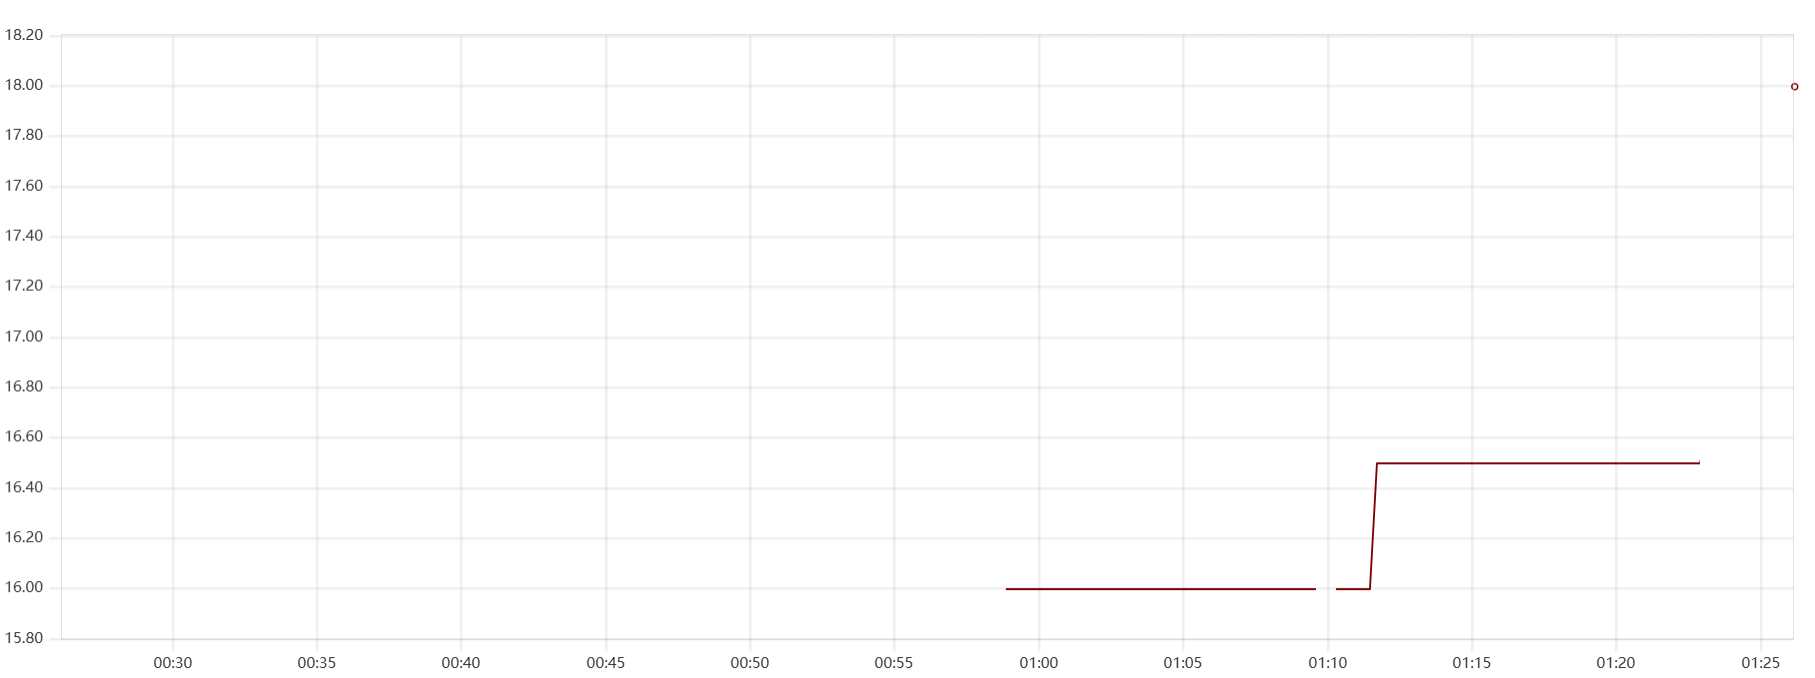
平均值,期间重启服务的同样断开了连线
最大值,期间重启服务的同样断开了连线

)

)


和 ::v-deep选择器的区别)


![【BUUCTF系列】[极客大挑战 2019]LoveSQL 1](http://pic.xiahunao.cn/【BUUCTF系列】[极客大挑战 2019]LoveSQL 1)


的 Qt 程序)


是 右Ctrl 键(即键盘右侧的 Ctrl 键)笔记250802)

)
